Detection of high velocity outflows in Seyfert 1 Mrk 590
Abstract
We report on the detection of ultra-fast outflows in the Seyfert 1 galaxy Mrk 590. These outflows are identified through highly blue-shifted absorption lines of O viii & Ne ix in the medium energy grating spectrum and Si xiv & Mg xii in the high energy grating spectrum on board Chandra X-ray observatory. Our best fit photoionization model requires two absorber components at outflow velocities of 0.176c and 0.0738c and a third tentative component at 0.0867c. The components at 0.0738c and 0.0867c have high ionization parameter and high column density, similar to other ultra-fast outflows detected at low resolution by Tombesi et al. These outflows carry sufficient mass and energy to provide effective feedback proposed by theoretical models. The component at 0.176c, on the other hand, has low ionization parameter and low column density, similar to those detected by Gupta et al. in Ark 564. These absorbers occupy a different locus on the velocity vs. ionization parameter plane and have opened up a new parameter space of AGN outflows. The presence of ultra-fast outflows in moderate luminosity AGNs poses a challenge to models of AGN outflows.
1 Introduction
Outflows are ubiquitous in AGNs, manifested by high-ionization absorption lines in X-rays and UV (Mathur et al. 1995; 1997, and references therein). The X-ray absorbers, commonly known as warm absorbers (WAs), have typical outflow velocities of km s-1. The discovery of ultra-fast outflows (UFOs) at velocities in the hard X-ray band has added an intriguing aspect to the rich field of AGN outflows. These outflows are exhibited by blueshifted absorption lines, produced mostly by highly ionized iron (Pounds et al. 2003a; b, Tombesi et al. 2010, and references therein). The mass outflow rate of UFOs can be comparable to the accretion rate and their kinetic energy can correspond to a significant fraction of the bolometric luminosity (Tombesi et al. 2013, Pounds et al. 2003a; b, Reeves et al. 2009). Thus these outflows can provide effective feedback that is required by theoretical models of galaxy formation (e.g., Hopkins & Elvis 2010, Silk & Rees 1998).
While WAs are detected unambiguously in the high-resolution soft X-ray spectra and their physical properties and kinematics are well determined (e.g., Krongold et al. 2003), the same cannot be said about UFOs. The UFOs in PG 1211+143 and PG 0844+349 (Pounds et al. 2003a; b) were detected in high-resolution grating spectra, but the rest of the UFOs are detected in low-resolution CCD spectra, observed with the XMM-Newton and Suzaku . The rest frame energy of the Fe-K line transition is 6.38 keV, and at outflow velocity of 0.1c the UFOs are observed at about 7.0 keV. This falls in the region of the spectrum where the effective area and resolution are low. As a result the significance of the absorption line detection in the hard X-ray band is often questioned (e.g., Laha et al. 2014) and with only a few lines observed, accurate parameterization of the photoionized plasma becomes difficult. These difficulties were alleviated with our discovery of relativistic outflows in the soft X-ray band in high-resolution spectra.
We recently discovered relativistic outflows in Chandra HETG spectra of Seyfert 1 galaxy Ark 564 (Gupta et al. 2013b); these detections are robust, with high statistical significance. We identified highly blueshifted absorption lines of O vi, O vii and O viii and successfully fitted them with a two-component photo-ionization model. The detection of multiple lines at the same velocity makes the identification of the relativistic outflow robust. This opens up an exciting new opportunity of probing the relativistic disk winds in the soft X-ray band where we have the best diagnostic power from multiple lines of multiples ionization states of several elements and where the gratings response is the best.
Excited by the discovery of relativistic outflows in Ark 564, we looked for their presence in other AGNs; could it be that they were not found because nobody looked for them? The Chandra HETGS data of Mrk 590 are tantalizing. Mrk 590 is a bright Seyfert 1 galaxy (recently appears to have changed from Type 1 to Type ; Denney et al. 2014) at that has been observed by the Einstein observatory (Kriss et al. 1980), the HEAO 1 (Piccinotti et al. 1982), the BATSE (Malizia et al. 1999) and recently by Chandra and XMM-Newton . Gallo et al. (2006) first reported the presence of a strong Fe K emission line revealed in the 2002 ks XMM-Newton EPIC data. Later Longinotti et al. (2007) presented its complex spectrum with a reflection component using the ks observations with Chandra and XMM-Newton and confirmed the presence of the Fe K emission line. Here we present a detailed reanalysis of the Chandra HETG observation of Mrk 590.
2 Observation and data reduction
Mrk 590 was observed by Chandra High Energy Transmission Grating (HETG) in 2004 for (ObsID: 4924). The HETG is comprised of two gratings: the medium energy gratings (MEG) and the high energy gratings (HEG), which disperse spectra into positive and negative spectral orders. We reduced the data for both gratings using the standard Chandra Interactive Analysis of Observations (CIAO) software (v4.3) and Chandra Calibration Database (CALDB, v4.4.2) and followed the standard Chandra data reduction threads111http://cxc.harvard.edu/ciao/threads/index.html. To increase S/N we co-added the negative and positive first-order spectra and built the effective area files (ARFs) using the fullgarf CIAO script.
3 Spectral Analysis
For the spectral analysis, we binned the MEG and HEG spectra to their resolution element of and respectively and analyzed using the CIAO fitting package Sherpa. Throughout this paper the quoted errors correspond to significance.
3.1 Continuum Modeling
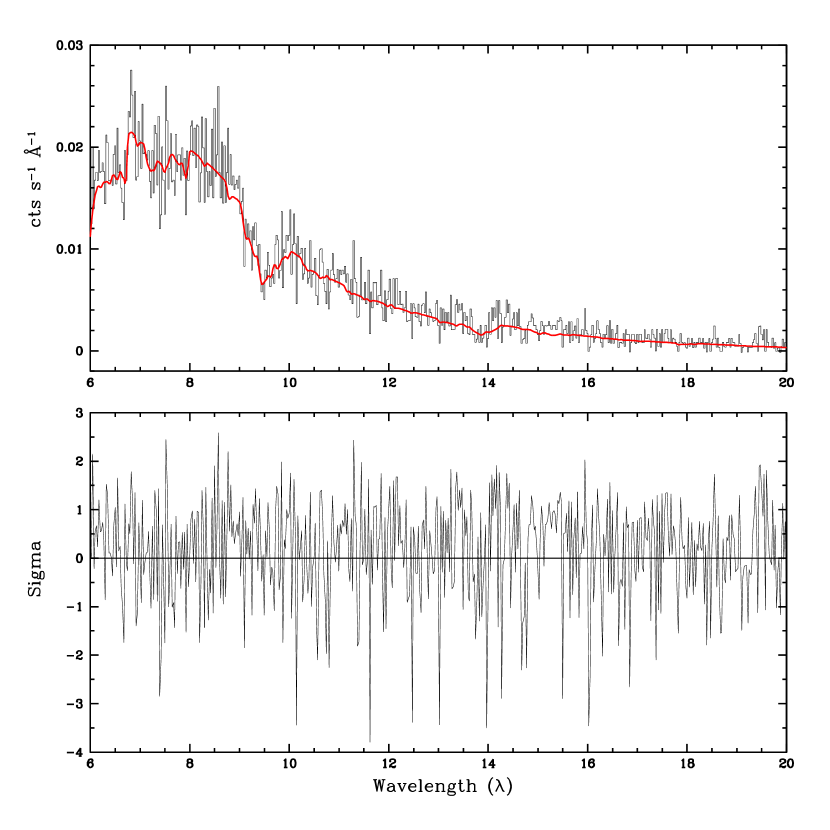
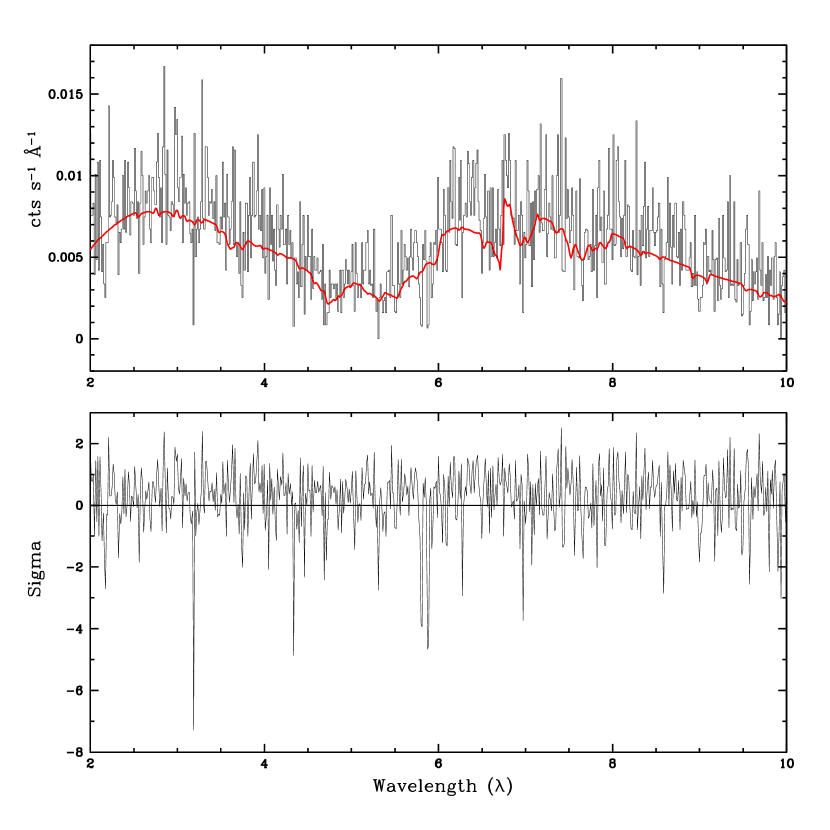
We fit the intrinsic continuum of the source with an absorbed (Galactic ; Dickey & Lockman 1990) powerlaw; the fit parameters are reported in the Table 1. In the energy band of , the integrated flux is , which corresponds to an unabsorbed X-ray luminosity of .
Although absorbed powerlaw fits the continuum well (MEG: , HEG: ), there are residual absorption line-like features in the spectral regions of Å and Å in the MEG and HEG spectra respectively (Fig. 1 & 2). In the subsequent sections we discuss the identification, statistical significance and possible origin of these absorption lines.
3.2 Identification of the Absorption Lines
3.2.1 Medium Energy Grating Spectrum
In the MEG spectrum of Mrk 590 the most prominent absorption feature (; Fig. 3) is present at Å. Addition of a gaussian absorption feature (at ) to continuum model improves the fit ( for 2 fewer d.o.f.) at the confidence level of 99.97% according to the F-test (Bevington & Robinson 1992). The measured equivalent width (EW) is mÅ. Errors are at confidence level and are calculated using the “projection” command in Sherpa. According to the Gaussian probability distribution the probability of detecting the line by chance is . There are 681 wavelength bins in the MEG spectrum, so the probability of finding an absorption line at the observed significance anywhere in the spectrum due to random statistical fluctuations is 0.88%. Thus it is highly unlikely that this absorption feature is due to random statistical fluctuations.
We tried to identify the absorption feature detected at Å. There is no known instrumental feature near this energy (Chandra Proposers Observatory Guide, or POG). Though this line could be associated with O viii K line (Å), we rule out this possibility because there is no corresponding O viii K line (Å). Assuming this feature is produced by Fe xvii (Å) ions in an intervening warm-hot intergalactic medium (WHIM; Mathur et al. 2003, Nicastro et al. 2005), the system redshift would be which is greater than the . Thus this feature could not be from an intervening WHIM system and no other intervening absorption line is likely either. Therefore we assume that this absorption line is intrinsic to the source.
We identify this line based on a combination of chemical abundance, line strength and assuming a very broad range of inflow/outflow velocities of km s-1. The likely candidates for the feature are Fe xvii (; , wavelength at the source redshift) with inflow velocity of , or O viii (; ) with outflow velocity of . To distinguish between the two possibilities of inflow and outflow, we search for possible associations of other lines. We do not find any possible association for inflows but found a 2.8 line at corresponding to Ne ix (; , Fig. 3) at the similar outflow velocity of .
3.2.2 High Energy Grating Spectrum
In the Mrk 590 HEG spectrum, we detected two absorption features at and (Fig. 4) with EW of mÅ and mÅ respectively. The HEG and MEG overlap in this wavelength range, so if real, these lines should also be present in the MEG spectrum. We searched for these absorption features in the MEG spectrum and found one at Åwith EW of mÅ; this is consistent with the ÅHEG line, though the error on the line EW in the MEG spectrum is large. There is no absorption feature in the MEG spectrum corresponding to the HEG feature, but again the EW limit in the MEG spectrum is large, mÅ, so the discrepancy is less than . In the following we will treat both of these features as real lines, but keeping in mind that our confidence in the feature is not as strong as that in the feature.
In the HEG spectrum, both lines are present at high significance with a very low probability of finding them by chance (% and %) anywhere in the spectrum. The only possible identification we found for them is of Si xiii and Si xiv at outflow velocities of –. We will see later that the photo-ionization model supports the identification of these lines as Si xiv .
4 Photo-ionization model: fitting with PHASE
To test the validity of our tentative identifications of absorption features with high-velocity outflows, we fitted them with our photo-ionization model code PHASE (Krongold et al. 2003). The code has 4 free parameters per absorbing component, namely 1) the ionization parameter ; where Q(H) is the rate of H ionizing photons, r is the distance to the source, is the hydrogen number density and c is the speed of light; 2) the hydrogen equivalent column density ; 3) the outflow velocity of the absorbing material and 4) the micro-turbulent velocity of the material. PHASE has the advantage of producing a self-consistent model for each absorbing component, because the code starts without any prior constraint on the column density or ionization fraction of any ion. We have assumed solar elemental abundances (Grevesse et al. 1993) in the following analysis.
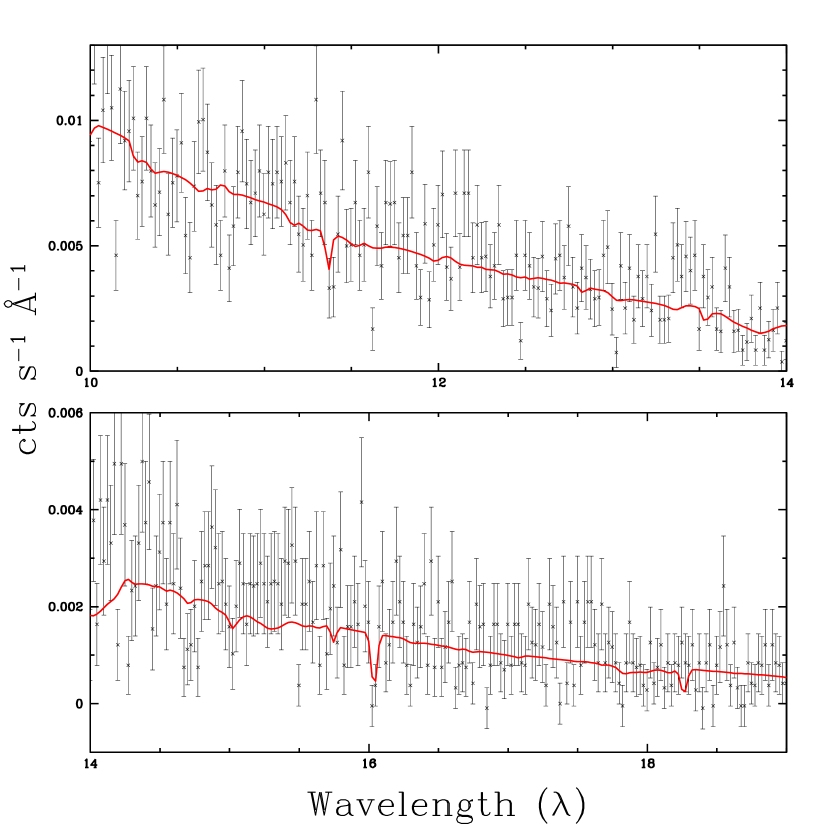
The residual features at and in the MEG spectrum are well fitted with one PHASE component of and and outflow velocity of (Fig. 5) and the lines are indeed O viii K and Ne ix . The addition of the PHASE component to the continuum model significantly improves the fit ( for 3 fewer d.o.f.). According to F-test, the absorber is present at a confidence level of 99.66%. We call this component as the “high-velocity–low-ionization-phase (HV-LIP)” absorber. Our best fit absorber model also predicts absorption from O vii at Å. As shown in figure 5, the data are consistent with the prediction. However, to securely detect the O vii feature, we require higher signal to noise data.
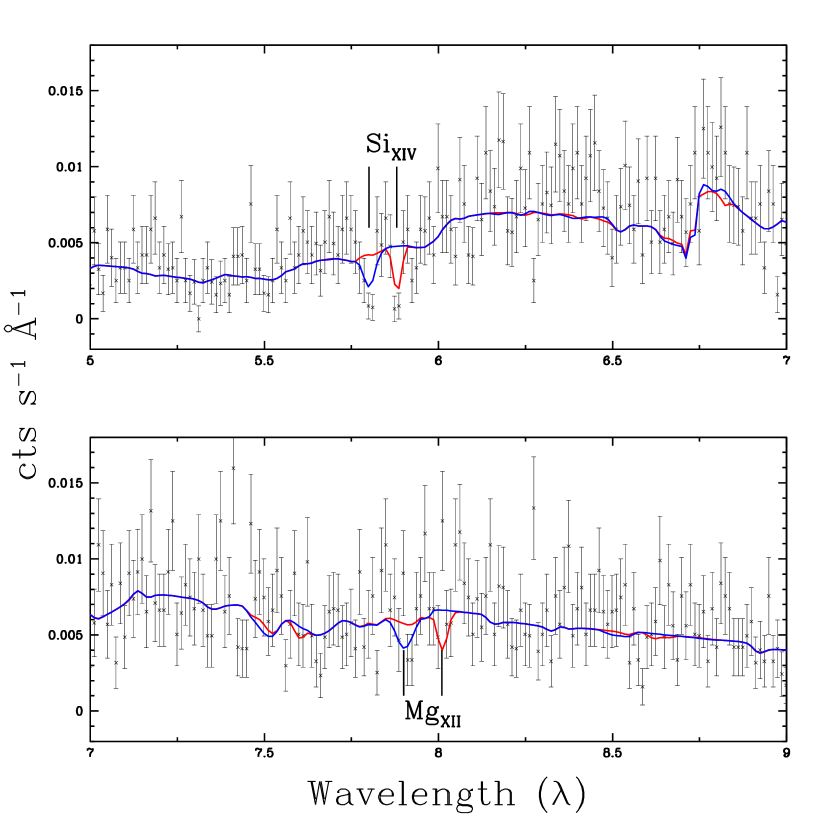
To model the HEG absorption features (at and ) identified as Si xiii or Si xiv , required two PHASE components with and at different outflow velocities (Fig. 6). The photo-ionization model fitting favors the identification of these features as ionic transition of Si xiv produced in highly ionized medium outflowing with velocity of and respectively. Both the absorbers are required at high significance of 99.999% ( for 4 fewer d.o.f.) and 99.996% ( for 4 fewer d.o.f.) respectively. The HEG best fit model with two absorbers also requires Mg xii absorption features at and ; these lines are in fact present and are well fitted by the model. The best fit PHASE parameters are reported in Table 2 and the best fit models are shown in Fig. 6. These absorbers fit the high ionization lines, so we will refer to these absorbers as the “high-velocity–high-ionization phase I (HV-HIP-I)” and “high-velocity–high-ionization phase II (HV-HIP-II)” components. Successfully modeling the residuals in the MEG and HEG spectra further supports the presence of high-velocity outflows in Mrk 590.
5 Mass and Energy ouflow rate estimates
Without knowing the location of the absorber, its mass and energy outflow rates cannot be well constrained. The lower limit on the absorber location can be determined assuming that the observed outflow velocity is the escape velocity at the launch radius : i.e. . Peterson et al. (2004) determine the central black hole mass of Mrk 590 to be . Using the above expression we get the minimum distance of Mrk 590 HV-LIP and HV-HIP absorbers of pc and pc respectively. This is 0.17 and 0.72 light-days from the nuclear black hole, and inside the broad emission line region.
For a bi-conical wind, the mass outflow rate is (Krongold et al. 2007). Substituting with and using outflow velocities of 52800 km s-1 and 26010 km s-1, we obtain lower limit on mass outflow rates of Ms-1 and Ms-1, respectively. These corresponds to kinetic luminosity of LIP and HIP high velocity outflows of erg s-1 and erg s-1, respectively. The kinetic luminosity of HIP high velocity outflows is much larger than X-ray (2-10 keV) luminosity of erg s-1. Thus in principle these outflows have the potential to provide effective feedback.
6 Discussion
The Chandra observation of Mrk 590 has revealed low- and high-ionization high-velocity outflows. The low-ionization and low-column (HV-LIP) component is similar to those recently discovered in another Seyfert-type moderate luminosity AGN Ark 564 (Gupta et al. 2013b). However, the outflows identified as HV-HIP-I and HV-HIP-II have parameters similar to that of UFOs (highly ionized erg s-1 and with large column densities cm-2).
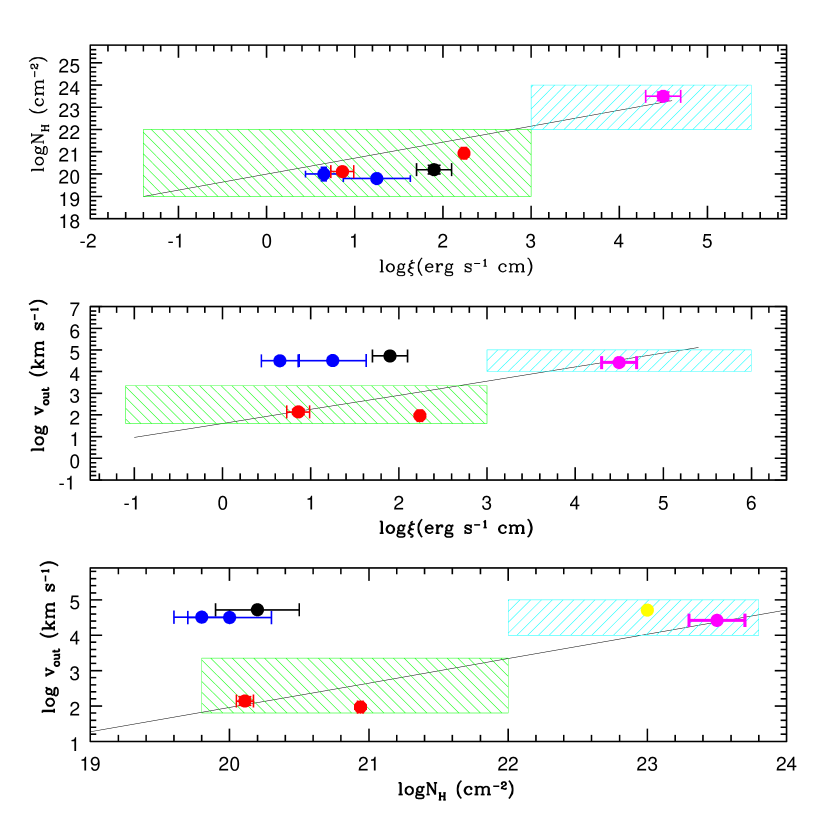
Recently Tombesi et al. (2013) presented the connection between UFOs and soft X-ray WAs. They strongly suggest that these absorbers represent parts of a single large-scale stratified outflow and that they continuously populate the whole parameter space (ionization, column, velocity), the WAs and the UFOs lying at the two ends of the distribution (Fig. 7). The Ark 564 low-velocity WAs (Gupta et al. 2013a) and UFOs (Papadakis et al. 2007) were in agreement with the linear correlation fits from Tombesi et al., but the low-ionization low-column high-velocity outflows in Ark 564 probe a completely different parameter space (U, , ), as shown in Fig.7. Similarly the Mrk 590 HV-HIP outflows probe the same parameter space as of UFOs, but HV-LIP outflows probe the parameter space not covered by either low-velocity WAs or high-ionization UFOs.
The presence of different absorption systems with different outflow velocities may suggest that we are looking at the flows in a transverse configuration with respect to the line of sight. This would avoid possible collision between different components, that would result in shock-heating of the gas and a decrease on the measured opacity. The geometry would have to be conical and the flows must form a large angle with the accretion disk. It is also expected that the orthogonal component of the velocity might have a significant contribution to the total velocity of the flow, but we only observe the component in the line of sight. This would mean that the flows are even faster than detected. In such a steady state configuration, the absorption lines could be expected to remain constant over time, as we would always observe the same section of the wind.
Alternatively, we may be seeing a radial flow, with a nearly spherical geometry and a large velocity gradient in the line of sight. The different velocity components could be explained if they are parts of this single flow, formed by clumps in the flow. In this scenario, strong variability in the observed absorption lines is expected, as the clumps move further out from the central engine, and their velocity and ionization state change. Observations of Mrk 590 over time would allow us to discriminate between these two scenarios.
As discussed in Gupta et al. (2013b), the relativistic outflows cannot be explained by simple models of radiation pressure driven winds. Their velocities are too large for their luminosities and magneto-hydrodynamics may be involved. Magnetic fields are also important for launching jets; could relativistic outflows be failed jets? To get the in-depth view of the AGN outflows, its important to search for more of such systems probing the complete parameter space.
7 Summary
We have detected high-velocity outflows in the Seyfert 1 galaxy Mrk 590. These absorbers are identified through highly blue-shifed absorption lines of O viii & Ne ix in the MEG spectrum and Si xiv & Mg xii in the HEG spectrum. Our best fit photoionization model requires three absorber components at outflow velocities of 0.176c, 0.0867c and 0.0738c. The HV-LIP absorber has low -ionization and -column density while two HV-HIP absorbers have high -ionization and -column density. All the absorbers are required at high significance of 99.66%, 99.999% and 99.996% respectively. The HV-HIPs have sufficient mass and energy to provide effective feedback proposed by theoretical models. However, the presence of such UFOs in moderate-luminosity AGNs poses a challenge to models of AGN winds.
References and Notes
- Bevington & Robinson (1992) Bevington, P.R. & Robinson, D.K. 1992, New York: McGraw-Hill, 2nd ed.
- Denney et al. (2014) Denney, K. D., De Rosa, G., Croxall, K., Gupta, A. et al. 2014, arXiv:1404.4879
- Gallo et al. (2006) Gallo, L. C., Lehmann, I., Pietsch, W. et al. 2006, MNRAS, 365, 688
- Grevesse et al. (1993) Grevesse, N., Noels, A., & Sauval, A. J. 1993, A&A, 271, 587
- Gupta et al. (2013a) Gupta, A., Mathur, S., Krongold, Y., & Nicastro, F. 2013, ApJ, 768, 141
- Gupta et al. (2013b) Gupta, A., Mathur, S., Krongold, Y., & Nicastro, F. 2013, ApJ, 772, 66
- Hopkins & Elvis (2010) Hopkins, P. & Elvis, M. MNRAS, 401, 7
- Kriss et al. (1980) Kriss, G. A., Canizares, C. R., & Ricker, G. R. 1980, ApJ, 242, 492
- Krongold et al. (2003) Krongold, Y., Nicastro, F., Brickhouse, N.S., Elvis, M., Liedahl D.A. & Mathur, S. 2003, ApJ, 597, 832
- Krongold et al. (2007) Krongold, Y., Nicastro, F., Elvis, M. et al. 2007, ApJ, 659, 1022
- Laha et al. (2014) Laha, S., Guainazzi, M., Dewangan, G.C. et al. 2014, arXiv1404.0899
- Longinotti et al. (2007) Longinotti, A. L., Bianchi, S., Santos-Lleo, M. et al. 2007, å, 470, 73
- Malizia et al. (1999) Malizia, A., Bassani, L., Zhang, S. N. et al. 1999, ApJ, 519, 637
- Mathur et al. (1995) Mathur, S., Elvis, M., & Wilkes, B. 1995, ApJ, 452, 230
- Mathur et al. (1997) Mathur, S., Wilkes, B. & Aldcroft, T. 1997, ApJ, 478, 182
- Mathur et al. (2003) Mathur,S., Weinberg, D.H., & Chen, X. 2003,ApJ, 582, 82
- Nicastro et al. (2005) Nicastro, F., et al. 2005, nature, 433, 49
- Papadakis et al. (2007) Papadakis, I. E., Brinkmann, W., Page, M. J., McHardy, I., & Uttley, P. 2007, A&A, 461, 931
- Peterson et al. (2004) Peterson, B. M., Ferrarese, L., Gilbert, K. M. et al. 2004, ApJ, 613, 682
- Piccinotti et al. (1982) Piccinotti, G., Mushotzky, R. F., Boldt, E. A. et al. 1982, ApJ, 253, 485
- Pounds et al. (2003a) Pounds, K. A. et al. 2003, MNRAS, 345, 705
- Pounds et al. (2003b) Pounds, K. A. et al. 2003, MNRAS, 346, 1025
- Reeves et al. (2009) Reeves, J. N. et al. 2009, ApJ, 701, 493
- Silk & Rees (1998) Silk, J. & Rees, M.J. 1998, A&A, 331, 1
- Tombesi et al. (2010) Tombesi, F. et al. 2008, A&A, 521, 57
- Tombesi et al. (2013) Tombesi, F. et al. 2013, MNRAS, 430, 110
| Units | MEG | HEG | |
|---|---|---|---|
| Powerlaw | |||
| Photoindex () | |||
| Normalization |
| Ion | ||||
|---|---|---|---|---|
| Å | km s-1 | m | ||
| Medium Energy Grating | ||||
| O viii | ||||
| Ne ix | ||||
| High Energy Grating | ||||
| Si xiv | ||||
| Si xiv |
| MEG | HEG | ||
|---|---|---|---|
| Parameter | HV-LIP | HV-HIP-I | HV-HIP-II |
| cm | |||
| km s | |||
| km s | |||
| 11 | 24 | 10 | |
Improvement in to fit after adding model component