Connections between galaxy mergers and Starburst: evidence from local Universe
Abstract
Major mergers and interactions between gas-rich galaxies with comparable masses are thought to be the main triggers of starburst. In this work, we study, for a large stellar mass range, the interaction rate of the starburst galaxies in the local universe. We focus independently on central and satellite star forming galaxies extracted from the Sloan Digital Sky Survey. Here the starburst galaxies are selected in the star formation rate (SFR) stellar mass plane with SFR five times larger than the median value found for “star forming” galaxies of the same stellar mass. Through visual inspection of their images together with close companions determined using spectroscopic redshifts, we find that 50% of the “starburst” populations show evident merger features, i.e., tidal tails, bridges between galaxies, double cores and close companions. In contrast, in the control sample we selected from the normal star forming galaxies, only 19% of galaxies are associated with evident mergers. The interaction rates may increase by 5% for the starburst sample and 2% for the control sample if close companions determined using photometric redshifts are considered. The contrast of the merger rate between the two samples strengthens the hypothesis that mergers and interactions are indeed the main causes of starburst.
Subject headings:
galaxies: interactions — galaxies: starburst1. INTRODUCTION
Amongst various mechanisms that trigger starburst in galaxies, interactions and merging processes between gas-rich galaxies are regarded as the most efficient ones (Larson & Tinsley 1978; Kennicutt 1998; Elmegreen 2011). Starbursts are typically confined within the galaxy, and can only be triggered by the accumulation, over a short time period, of a large amount of cold gas in a small region. The most efficient way of achieving this is through the merging of gas-rich galaxies, where the gas can be strongly compressed and concentrated by tidal interactions (e.g. Mo et al. 2010). Star formation enhancement has been measured for merging systems over a large sample of galaxies. A factor of two to three enhancement is found on average (e.g., Kennicutt 1998), with a large scatter ranging from zero for dry mergers between gas-poor, bulge-dominated systems (e.g., van Dokkum 2005) to for extreme cases (e.g. Bushouse et al 1987; Telesco et al 1988).
Moreover, observational studies have also demonstrated that many starburst galaxies may have experienced gaseous merging and have ”peculiar” morphology (e.g., Larson & Tinsley 1978; Arp 1995). By performing photometric measurements on a Hubble Space Telescope snapshot imaging survey sample of 97 ultra-luminous infraRed galaxies (ULIRGs), e.g., with , at redshift , Cui et al. (2001) found that 18% of ULIRGs have multiple nuclei and 39% have double nuclei. Chen et al. (2010) selected 54 ULIRGs from the Sloan Digital Sky Survey(SDSS) and found that of them are merging systems. Apart from the ULIRGs at low redshift (e.g., Sanders et al. 1988; Melnick & Mirabel 1990; Murphy et al. 1996), the majority of ULIRGs at high redshift also exhibit merger features (e.g., Kartaltepe et al. 2012).
Numerical studies of merging galaxies (e.g., Mihos & Hernquist 1994; Springel 2000; Tissera et al. 2002; Meza et al. 2003; Kapferer et al. 2005; Cox et al. 2006; Di Matteo et al. 2008) showed that merging processes do trigger star formation. However the intensity may depend on the initial disk stability, the availability of gas in the interacting galaxies, etc. Di Matteo et al. (2007) analyzed several hundred simulations of galaxy collisions and compared their star formation rates (SFR) to isolated cases. In their simulations only 17% of the mergers trigger SFR 10 times larger than for isolated galaxies, and half of the collisions have less than a factor of four enhancement in SFR. In addition, Cox et al. (2008) pointed out that only major mergers (galaxy pairs with comparable stellar mass) can significantly enhance the SFRs and trigger starbursts.
In this work, we expand those previous observational studies of ULIRGs to less luminous starburst galaxies with -band luminosity range , using SDSS data (York et al 2000). We study the fractions of starburst galaxies with merger features for central and satellite galaxies respectively. The Letter is organized as follows: Section 2 describes the data we used, the main results are presented in Section 3, and the summary is given in Section 4. Throughout the Letter we apply a cosmology with and .
2. Data Selection
In this section, we describe the data selection, the definition of starburst galaxies and the morphological classification.
2.1. SDSS Galaxy and Group Catalogs
To probe the interaction rates of ‘starburst’ galaxies in the local universe, we need to have a fair and complete sample of galaxies with various information, e.g., images, redshifts, SFRs, etc. For this purpose, a galaxy sample is selected from the New York University Value-Added Galaxy catalog (NYU-VAGC; Blanton et al. 2005) constructed from the SDSS Data Release 7 (DR7; Abazajian et al. 2009). We have selected in the NYU-VAGC Main Galaxy Sample all galaxies with an extinction-corrected apparent magnitude brighter than , with redshifts in the range , and with a redshift completeness . Here the redshift completeness is defined as the average percentage of galaxies that have spectroscopic redshifts in their local sky coverage. The resulting galaxy sample contains a total of galaxies with SDSS spectroscopic redshifts in a sky coverage of 7748 . The SFRs and the stellar masses of individual galaxies are obtained from the MPA-JHU DR7 spectrum measurements111See http://www.mpa-garching.mpg.de/SDSS/DR7/. In this data release, stellar masses are estimated based on their band absolute magnitudes and a model mass-to-light ratio (Kauffmann et al. 2003; Salim et al. 2007). The SFRs are computed using the photometry and emission lines as in Brinchmann et al. (2004; hereafter B04) and Salim et al. (2007). For star forming galaxies with strong emission lines, the SFRs are estimated by fitting different emission lines in the galaxy spectra. For active galactic nuclei and galaxies with weak emission lines, SFRs are estimated from the photometries.
In order to check whether or not the interaction rates of starburst galaxies depend on their larger scale environments, e.g., host halos, we divide our sample into central and satellite galaxies. We make this distinction by using the related SDSS group catalog (specified as modelA)222 See http://gax.shao.ac.cn/data/Group.html constructed by Yang et al. (2007, hereafter Y07). The group finder used in Y07 starts with an assumed mass-to-light ratio to assign a tentative mass to each potential group. This mass is used to estimate the size and velocity dispersion of the underlying halo that hosts the group, which in turn is used to determine group membership (in redshift space). The most massive group member is identified as the central galaxy (472,504 in total), while all the other group members are given the status of satellite galaxies (126,797 in total).
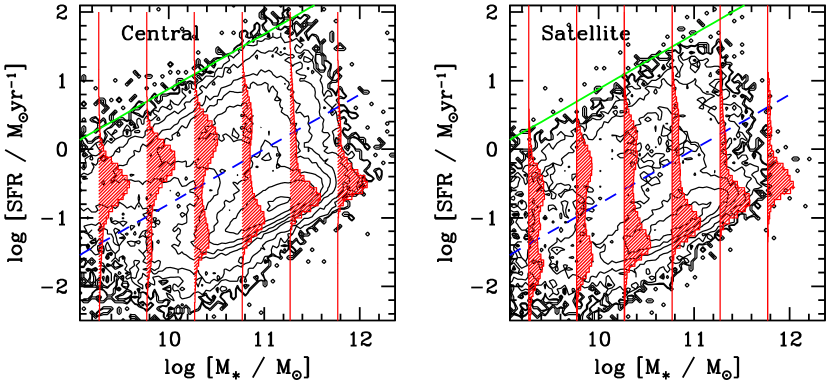
Next comes the definition of our ”starburst” galaxies. As modeled in Yang et al. (2013), the distribution of SFRs for central galaxies shows a bimodal feature. For a given stellar mass (or halo mass ), the central galaxies appear to be composed of two distinctive populations, one with high SFRs (the “star forming” population) and the other with SFRs that are more than 10 times smaller (the “quenched” population). In the left panel of Figure 1, we reproduce the figure showing the number density distributions of ‘volume-limited’ samples of central galaxies in the versus plane using contours of different levels (see Yang et al. 2013 for details). The vertical shaded histograms show the distributions of galaxies within given logarithmic stellar mass bins of dex width. According to their bimodal feature, we can roughly separate galaxies into star forming and quenched branches by , which is shown in the plot as the dashed line. Similar distributions are obtained for satellite galaxies which are shown in the right panel of Figure 1. Compared to the central galaxies, the satellite galaxies show a similar bimodal feature but with different ratios as a function of stellar mass: there are many more quenched low-mass satellite galaxies than central galaxies (e.g., a few percent of quenched central galaxies versus quenched satellite galaxies with stellar mass ).
The definition of our ”starburst” galaxies is set as follows,
| (1) |
Thus defined, our ”starburst” galaxies have SFRs that are 5 times larger than the median SFRs of the “star forming” galaxies as a function of stellar mass. Such ”starburst” definition is similar to that introduced by Rodighiero et al. (2011). The above selection criteria is illustrated in Figure1 using solid lines. Note here that the factor five is arbitrary. However, setting this factor to 10 or 2 would result in too few or too many galaxies for our visual inspection. According to our definition, a total of 1455 centrals and 404 satellites fall into our ”starburst” galaxy categories. Once compared to the total number of central (472,504) and satellite (126,797) galaxies, the fractions of starburst satellites we selected are 0.3% in both cases.
Apart from our definition of the ”starburst” galaxies which are based on SFR and , there are other definitions of ‘starburst’ galaxies according to line features (e.g., Kewley et al. 2001; Kauffmann et al. 2003; B04; Lee et al. 2007; 2009; Bolton et al. 2012). According to the definition of Bolton et al. (2012), star forming galaxies with equivalent width larger than are defined as ”starburst” galaxies. Using this definition we can obtain 13460 central and 1649 satellite ”starburst” galaxies, 10 times more than ours. The distribution of their ”starburst” galaxies in the versus plane spread all over the ”star forming” branch. Still they tend to have somewhat enhanced SFRs with respect to the median SFR as a function of stellar mass. About of our ”starburst” galaxies fall into the categories of Bolton et al. (2012). Thus our starburst galaxies are a small selection among theirs with very high SFRs.
In order to assess a causal relationship between interactions and starbursts, we constructed a control sample of ”normal” star forming galaxies. This control sample contains the same number of randomly selected star forming central and satellite galaxies with respective redshift and stellar mass distributions similar to those of the starburst galaxy sample.
| Type | Centrals (1455) | Satellites (404) | |||
|---|---|---|---|---|---|
| starburst (major/wet) | control (major/wet) | starburst (major/wet) | control (major/wet) | ||
| Ia | 50.60.6% (–/–) | 19.10.7% (–/–) | 48.82.5% (–/–) | 17.11.8% (–/–) | |
| (Ia pairs) | 21.10.4% (63.2%/94.8%) | 11.30.6% (91.1%/84.4%) | 12.90.8% (65.5%/94.6%) | 5.90.5% (57.9%/89.5%) | |
| Ib | 2.90.4% (47.6%/52.4%) | 0.90.1% (35.7%/35.7%) | 2.50.8% (60.0%/50.0%) | 0.70.4% (0.0%/66.7%) | |
| Ic | 1.80.3% (48.1%/25.9%) | 0.80.2% (45.5%/36.3%) | 2.50.8% (40.0%/40.0%) | 0.00.0% (–/–) | |
| II | 44.70.5% (–/–) | 79.10.8% (–/–) | 46.02.4% (–/–) | 82.22.1% (–/–) | |
2.2. Morphological Classification
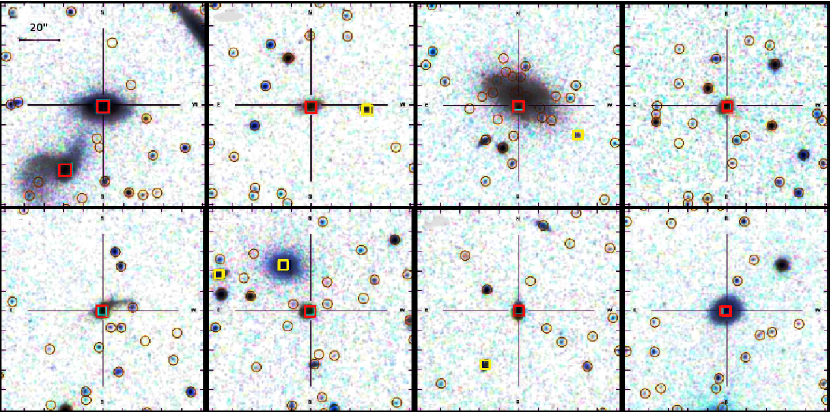
In order to proceed to the eyeball checking of both our starburst and normal star forming galaxy samples, we have downloaded images synthesized from g, r, i band (Lupton et al 2004) of central and satellite galaxies from the SDSS website. We have classified these galaxies into different categories following the criteria used by Bridge et al. (2007) for images in the Spitzer First Look Survey. Images showing tidal features, e.g. tidal tails, double cores and bridges between galaxies etc. (see the left panel images of Fig. 2) are defined as Type Ia. In addition, galaxies with ‘dynamical’ close companions are classified as Type Ia as well. Here dynamical close companions are defined as galaxies having velocity differences less than 500 and projected distance smaller than (e.g. Patton et al. 2000). These Type Ias can be treated as merger associated galaxies. As the SDSS spectroscopic observation suffer from the fiber collision effect, no galaxy pair can be observed with separation smaller than 55” in one observation plate, except in the overlapped plates (Mesa et al 2013). Thus, for completeness, photometric redshifts are used as well. Galaxies without close spectroscopic companions but with close photometric companions are classified as Type Ib (Ic). Photometric close companions are here defined as follows. (1) They have consistent photometric redshifts as the reference galaxy (i.e., within 1- photometric redshift error of the companion galaxy, on average at about 0.023). (2) Their projected distances are smaller than . (3) their band apparent magnitudes are brighter than 20.0 so that very minor merger cases (with stellar mass ratio ) are excluded. We make use of two sets of photometric redshifts provided by the SDSS webserver. The first set is based on the Random Forests (RF) method proposed by Carliles et al. (2010), where the photometric redshifts are determined using a set of optimal decision trees built on subsets of spectroscopic samples. The other set is generated based on a hierarchical indexing structures method (KD-trees; see Csabai et al. 2003 and references therein). In Type Ib, the photometric redshifts of the companions measured in both RF and KD-tree methods are consistent with the spectroscopic redshift of the reference galaxy. Type Ic has at least one close companion but with only either RF or KD-tree redshift consistent with the reference galaxy. Thus defined, the Type Ib+Ic can be treated as the possible merger associated galaxies, as the photometric redshifts are not very reliable observables for this purpose. The remaining galaxies are all considered to be Type II meaning that neither mergers nor close companions except those with stellar mass ratio are found. Thus, we can take the fraction of Type Ia as the lower limit and fraction of Type Ia+Ib+Ic as the upper limit of the merger rate of our galaxy samples. As an illustration, we show in the upper and lower panels of Figure 2 the selected sample images of central and satellite galaxies.
3. Results
After classifying all galaxies in our starburst and normal star forming samples in the previous section, we proceed to study their relative fractions in different types.
First, we list in Table 1 the overall fractions of the different classification groups in both starburst and control samples. For the starburst galaxy sample, there are no big differences between centrals and satellites. In total, there are 50% central and 49% satellite starburst galaxies classified as Type Ia. Type Ia+Ib+Ic together reaches for central galaxies and for satellite galaxies. Here the errors are calculated using 200 bootstrap re-samplings. More precisely, we have 736 central galaxies classified as Type Ias. Within these Type Ias, 155 have both spectroscopic companions and tidal features, 97 only have spectroscopic companions, and the other 484 have only tidal features. For satellites, we have 197 Type Ias, among which 35 have both close companions and tidal features, 18 have only close companions, and 144 with only tidal features. Compared to the starburst galaxies, the normal star forming galaxies show significantly reduced merger signals, i.e. the fraction of Type Ia is a factor of 2.5 lower, 19% in centrals, and 17% in satellites. Including the possible merger associated Type Ib and Ic galaxies, the related fractions increase only by 2% and 1% for central and satellite galaxies, which is also 2.5 times lower.
We next proceed to check the stellar mass ratio of our merger associated galaxies in Type Ia+Ib+Ic. As pointed out in Cox et al. (2008), based on numerical simulations, only major mergers (galaxies with comparable masses, i.e., with stellar mass ratio within 1:3 and 3:1) can significantly enhance the SFRs of merging galaxies, i.e., trigger starburst. In Type Ias, the major or minor merger fractions are determined only for galaxies with close companions. For the Type Ib+Ic, we make use of the photometric redshift together with the -band apparent magnitude to estimate the stellar mass using the average mass-to-light ratio provided in Kauffmann et al. (2003). The resulting values for major merger events are also listed in Table 1. Among our Type Ias with close companions, 63.2% (91.1%) central and 65.5% (57.9%) satellite galaxies in our starburst (control) sample are major merger associated galaxies. If we assume all the Type Ias without close companions are major merger associated galaxies, as only a major merger will induce significant morphology changes (e.g. Mo et al. 2010), the total fractions of the major mergers are 45% and 47% in starburst central and satellite galaxy samples. In contrast, these numbers are 19% and 15% in control samples. Note however, as the total number of star forming galaxies is significantly larger than that of the starburst galaxies, most of the major mergers are indeed associated with normal star forming galaxies, i.e., a major merger does not always trigger a starburst. This is consistent with the simulation results obtained by Di Matteo et al. (2007) that only a small fraction of mergers trigger starburst and by Cox et al. (2008) that starburst only lasts a short period of time.
In addition to the major/minor merger separation, we also check what fractions of the observed mergers are wet-wet or wet-dry mergers. Here wet galaxies correspond to star forming or blue galaxies depending on whether or not SFR information is available. In contrast, dry galaxies correspond to quenched or red galaxies. For those galaxies without SFR measurements, we separate them in to blue (wet) and red (dry) using their colors as a function of luminosity according to the criteria given in Yang et al. (2008),
| (2) |
where and is the absolute magnitude in the band K+E corrected to z=0.1. For Type Ia, the wet-wet merger fractions are also determined only for galaxies with spectroscopic close companions. We list in Table 1 the related fractions that can be specified into wet-wet mergers. Within the total Type Ias with close companions, 95% in the starburst sample and 90% in the control sample are wet-wet mergers. Such a high fraction is consistent with the ”galactic conformity” found by Weinmann et al. (2006) that satellite galaxies tend to have the same types (early or late) as their primary galaxy.
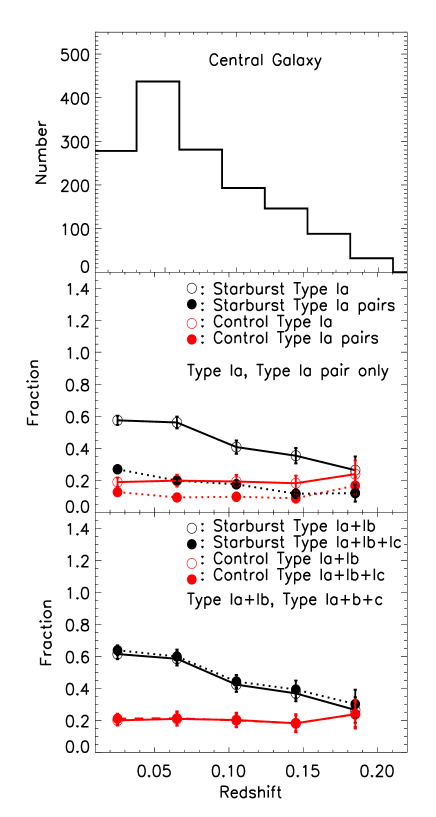
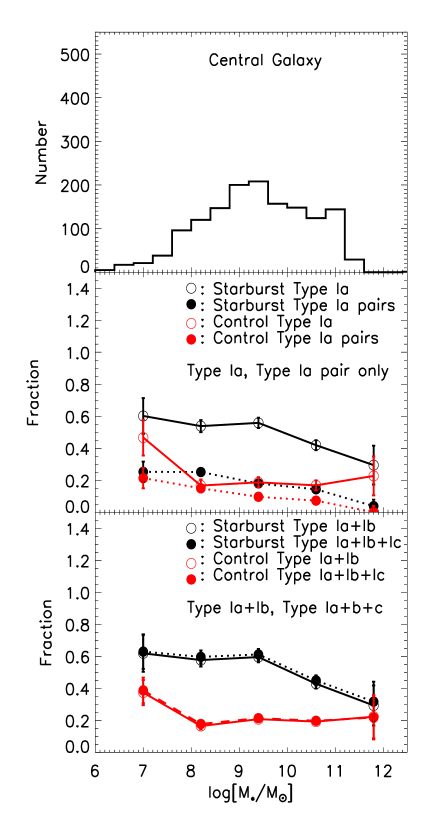
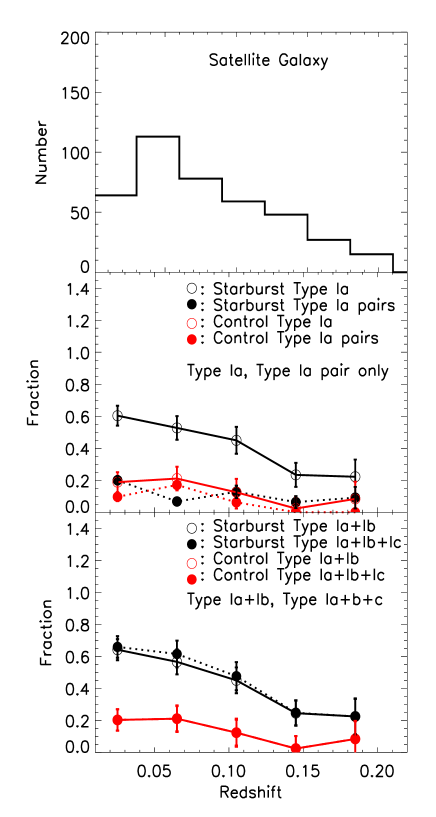
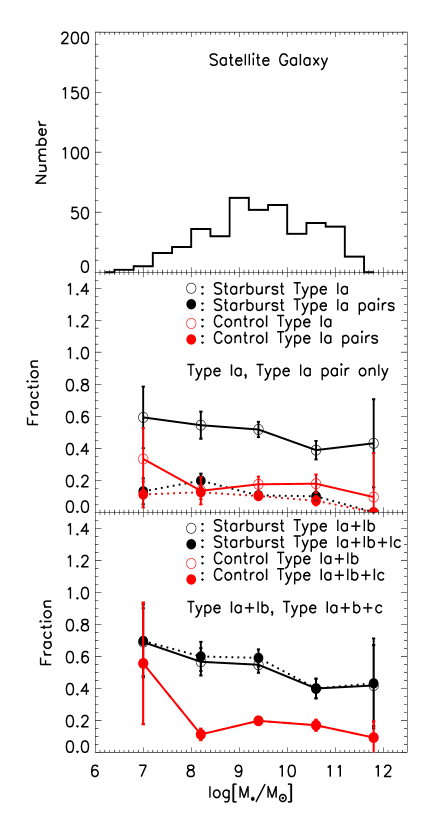
Finally, we check if the total fractions have any dependence on the redshift or the stellar mass of the galaxies in consideration. We first focus on the central galaxies. Shown in the upper panels of Figure 3 are the number distribution of galaxies as a function of redshift (left panel) and stellar mass (right panel). The distributions of galaxies shown in these two panels reflect the selection effects of the survey and are referenced for further fraction measurements. We divided our starburst galaxy samples into five redshifts bins and five stellar mass bins. Shown in the middle panels of Figure 3 are results for the Type Ias (open circles) and Type Ias with close companions only (solid dots). Compared to the control sample, the starburst sample shows overall higher amplitudes and slightly decreasing trends both as a function of redshift and as a function of stellar mass. The lower fraction of mergers in higher redshift and most massive starburst galaxies suggests that the starburst in these galaxies are not necessarily triggered by major mergers, but instead by minor mergers or accretion of gas from low-mass galaxies. In the lower panels of Figure 3, we show the results for Type Ia+Ib and Ia+Ib+Ic. The overall trends are quite similar to those of Type Ias. Then for the satellite galaxies, similar analysis are carried out and shown in Figure 4. The overall dependences of satellite galaxies in both our starburst and control samples are quite consistent with those of central galaxies. The general consistent behaviors between central and satellite galaxies suggests that the starbursts are very local events and not much affected by their large scale environment.
4. Conclusions
In this Letter, we report our investigation on the interaction rate of ”starburst” galaxies selected from the SDSS DR7, with respect to a control sample of normal star forming galaxies. Here the starburst galaxies are defined with SFRs a factor of five larger than the median SFR of the star forming galaxies distribution as a function of stellar mass. We study the fractions of these starburst galaxies that can be clearly or possibly classified as merger associated. Our classification is based on visual inspection of all these galaxy images and pair determination using redshift/distance separation, separately for central and satellite galaxies. The main conclusions are as follows.
-
1.
According to our visual inspection, 50% central and 49% satellite starburst galaxies show evident merger features. In contrast, the corresponding number in the control sample of normal star forming galaxies falls to 19% and 17%.
-
2.
Taking into account the close companions identified by the photometric redshifts, the interaction rates may increase by 5% in starburst sample and 2% in control sample.
-
3.
More than 60% (90%) evident mergers with close companions are major (wet-wet) merger associated galaxies. Assuming that the starburst galaxies without close companions but with disturbed features are all associated with major and wet-wet mergers, the total major and wet-wet merger fractions in our starburst sample are 45% for central galaxies and 47% for satellite galaxies. In contrast, these numbers are 19% and 15% in control samples.
-
4.
Distinction between central and satellite galaxies do not strongly affect the merger rates. This suggests that large scale environment has little impact on the starbursts which can thus be interpreted as local events.
References
- Abazajian et al. (2009) Abazajian, K. N., Adelman-McCarthy, J. K., Agüeros, M. A., et al. 2009, ApJS, 182, 543
- Arp (1995) Arp, H. C. 1995, yCat, 7074, 0
- Blanton et al. (2005) Blanton, M. R., Schlegel, D. J., Strauss, M. A., et al. 2005, AJ, 129, 2562
- Bolton et al. (2012) Bolton, A. S., Schlegel, D. J., Aubourg, É., et al. 2012, AJ, 144, 144
- Bridge et al. (2007) Bridge, C. R., Appleton, P. N., Conselice, C. J., et al. 2007, ApJ, 659, 931
- Brinchmann et al. (2004) Brinchmann, J., Charlot, S., White, S. D. M., et al. 2004, MNRAS, 351, 1151
- Bushouse (1987) Bushouse, H. A. 1987, ApJ, 320, 49
- Carliles et al. (2010) Carliles, S., Budavári, T., Heinis, S., Priebe, C., & Szalay, A. S. 2010, ApJ, 712, 511
- Chen et al. (2010) Chen, Y., Lowenthal, J. D., & Yun, M. S. 2010, ApJ, 712, 1385
- Cox et al. (2006) Cox, T. J., Jonsson, P., Primack, J. R., & Somerville, R. S. 2006, MNRAS, 373, 1013
- Cox et al. (2008) Cox, T. J., Jonsson, P., Somerville, R. S., Primack, J. R., & Dekel, A. 2008, MNRAS, 384, 386
- Csabai et al. (2003) Csabai, I., Budavári, T., Connolly, A. J., et al. 2003, AJ, 125, 580
- Cui et al. (2001) Cui, J., Xia, X.-Y., Deng, Z.-G., Mao, S., & Zou, Z.-L. 2001, AJ, 122, 63
- Di Matteo et al. (2007) Di Matteo, P., Combes, F., Melchior, A.-L., & Semelin, B. 2007, A&A, 468, 61
- Di Matteo et al. (2008) Di Matteo, P., Bournaud, F., Martig, M., et al. 2008, A&A, 492, 31
- Elmegreen (2011) Elmegreen, B. G. 2011, EAS Publications Series, 51, 45
- Kapferer et al. (2005) Kapferer, W., Knapp, A., Schindler, S., Kimeswenger, S., & van Kampen, E. 2005, A&A, 438, 87
- Kartaltepe et al. (2012) Kartaltepe, J. S., Dickinson, M., Alexander, D. M., et al. 2012, ApJ, 757, 23
- Kauffmann et al. (2003) Kauffmann, G., Heckman, T. M., White, S. D. M., et al. 2003, MNRAS, 341, 33
- Kennicutt (1998) Kennicutt, R. C., Jr. 1998, ApJ, 498, 541
- Kewley et al. (2001) Kewley, L. J., Dopita, M. A., Sutherland, R. S., Heisler, C. A., & Trevena, J. 2001, ApJ, 556, 121
- Larson & Tinsley (1978) Larson, R. B., & Tinsley, B. M. 1978, ApJ, 219, 46
- Lee et al. (2007) Lee, J. C., Kennicutt, R. C., Funes, S. J., José G., Sakai, S., & Akiyama, S. 2007, ApJ, 671, L113
- Lee et al. (2009) Lee, J. C., Kennicutt, R. C., Jr., Funes, S. J. J. G., Sakai, S., & Akiyama, S. 2009, ApJ, 692, 1305
- Lupton et al. (2002) Lupton, R. H., Ivezic, Z., Gunn, J. E., et al. 2002, Proc. SPIE, 4836, 350
- Lupton et al. (2004) Lupton, R., Blanton, M. R., Fekete, G., et al. 2004, PASP, 116, 133
- Melnick & Mirabel (1990) Melnick, J., & Mirabel, I. F. 1990, A&A, 231, L19
- Mesa et al. (2013) Mesa, V., Duplancic, F., Alonso, S., Coldwell, G., & Lambas, D. G. 2014, MNRAS, 438, 1784
- Meza et al. (2003) Meza, A., Navarro, J. F., Steinmetz, M., & Eke, V. R. 2003, ApJ, 590, 619
- Mihos & Hernquist (1994) Mihos, J. C., & Hernquist, L. 1994, ApJ, 425, L13
- Mo et al. (2010) Mo, H., van den Bosch, F. C., & White, S. 2010, Galaxy Formation and Evolution. Cambridge University Press, 2010. ISBN: 9780521857932
- Murphy et al. (1996) Murphy, T. W., Jr., Armus, L., Matthews, K., et al. 1996, AJ, 111, 1025
- Patton et al. (2000) Patton, D. R., Carlberg, R. G., Marzke, R. O., et al. 2000, ApJ, 536, 153
- Sanders et al. (1988) Sanders, D. B., Soifer, B. T., Elias, J. H., et al. 1988, ApJ, 325, 74
- Rodighiero et al. (2011) Rodighiero, G., Daddi, E., Baronchelli, I., et al. 2011, ApJ, 739, L40
- Salim et al. (2007) Salim, S., Rich, R. M., Charlot, S., et al. 2007, ApJS, 173, 267
- Springel (2000) Springel, V. 2000, MNRAS, 312, 859
- Telesco et al. (1988) Telesco, C. M., Wolstencroft, R. D., & Done, C. 1988, ApJ, 329, 174
- Tissera et al. (2002) Tissera, P. B., Domínguez-Tenreiro, R., Scannapieco, C., & Sáiz, A. 2002, MNRAS, 333, 327
- van Dokkum (2005) van Dokkum, P. G. 2005, AJ, 130, 2647
- Weinmann et al. (2006) Weinmann, S. M., van den Bosch, F. C., Yang, X., & Mo, H. J. 2006, MNRAS, 366, 2
- Yang et al. (2007) Yang, X., Mo, H. J., van den Bosch, F. C., et al. 2007, ApJ, 671, 153
- Yang et al. (2008) Yang, X., Mo, H. J., & van den Bosch, F. C. 2008, ApJ, 676, 248
- Yang et al. (2013) Yang, X., Mo, H. J., van den Bosch, F. C., et al. 2013, ApJ, 770, 115
- York et al. (2000) York, D. G., Adelman, J., Anderson, J. E., Jr., et al. 2000, AJ, 120, 1579