Prospects for gravitational-wave detection and supermassive black hole astrophysics with pulsar timing arrays
Abstract
Large-area sky surveys show that massive galaxies undergo at least one major merger in a Hubble time. Ongoing pulsar timing array (PTA) experiments are aimed at measuring the gravitational wave (GW) emission from binary supermassive black holes (SMBHs) at the centres of galaxy merger remnants. In this paper, using the latest observational estimates for a range of galaxy properties and scaling relations, we predict the amplitude of the GW background generated by the binary SMBH population. We also predict the numbers of individual binary SMBH GW sources. We predict the characteristic strain amplitude of the GW background to lie in the range at a frequency of , with 95% confidence. Higher values within this range, which correspond to the more commonly preferred choice of galaxy merger timescale, will fall within the expected sensitivity ranges of existing PTA projects in the next few years. In contrast, we find that a PTA consisting of at least 100 pulsars observed with next-generation radio telescopes will be required to detect continuous-wave GWs from binary SMBHs. We further suggest that GW memory bursts from coalescing SMBH pairs are not viable sources for PTAs. Both the GW background and individual GW source counts are dominated by binaries formed in mergers between early-type galaxies of masses at redshifts . Uncertainties in the galaxy merger timescale and the SMBH mass galaxy bulge mass relation dominate the uncertainty in our predictions.
keywords:
black hole physics — galaxies: evolution — gravitational waves — pulsars: general1 Introduction
Astrophysical gravitational waves (GWs) affect long-term timing measurements of radio pulsars (Estabrook & Wahlquist, 1975; Sazhin, 1978; Detweiler, 1979). GW-induced metric perturbations at the Earth cause variations in pulse arrival times that differ between pulsars only by geometric factors. Hence, a specific GW signal may be directly detected in contemporaneous timing measurements of multiple pulsars. Three such ‘pulsar timing arrays’ (PTAs; e.g., Foster & Backer, 1990) are currently in operation: the European Pulsar Timing Array (EPTA; Kramer & Champion, 2013), the North American Nanohertz Observatory for Gravitational Waves (NANOGrav; McLaughlin, 2013), and the Parkes Pulsar Timing Array (PPTA; Manchester et al., 2013). These groups also share data as part of the International Pulsar Timing Array (IPTA; Hobbs et al., 2010) consortium. Currently, at least 50 millisecond pulsars are observed every weeks, and data sets stretching for yr exist for 34 of these pulsars (Manchester & IPTA, 2013). Together, these timescales imply that PTAs are sensitive to GWs in the frequency band Hz, which is complementary to other GW detection experiments.
The best-studied sources of GWs within the PTA frequency band are binary supermassive black holes (SMBHs). Stellar- or gas-dynamical evidence exists for SMBHs at the centres of 87 nearby galaxies at the time of writing (Kormendy & Ho, 2013), with masses ranging between . Phenomenological models of the buildup of the cosmological mass density in SMBHs during luminous quasar phases for redshifts (e.g., Yu & Tremaine, 2002; Shankar et al., 2013) suggest short quasar lifetimes. This, considered together with local correlations between and, for example, galaxy bulge mass (e.g., Kormendy & Ho, 2013), suggests that all massive galaxies () which formed since the peak of quasar activity host SMBHs (see also Miller et al., 2014).
In the context of hierarchical structure formation, mergers are integral to the formation histories of massive galaxies, and evidence for interacting galaxies is seen across most of cosmic time (Barnes & Hernquist, 1992). Multiple SMBHs are expected to be found in galaxy merger products. Indeed, pairs of active galactic nuclei (AGN) are observed in galaxies in the late stages of mergers (Merritt & Milosavljević, 2005), with projected separations as small as 7 pc (Rodriguez et al., 2006). The central SMBHs in a pair of merging galaxies are likely to sink in the merger remnant potential well through dynamical friction and form a bound binary (e.g., Begelman et al., 1980; Khan et al., 2012). Dynamical friction becomes inefficient once stars within the binary orbit are ejected, and the slingshot scattering of stars on radial orbits (Frank & Rees, 1976; Quinlan, 1996; Yu, 2002) or friction against circumbinary gas (Escala et al., 2004; Dotti et al., 2007; Roedig et al., 2011) is required to drive further orbital decay. At a binary component separation of pc, energy and angular momentum losses to gravitational wave (GW) emission can lead to SMBH-SMBH coalescence within a Hubble time (e.g., Peters & Mathews, 1963). A few candidate binary SMBHs with such separations have been identified (e.g., Valtonen et al., 2008; Boroson & Lauer, 2009; Eracleous et al., 2012).
The existence of a large cosmological population of binary SMBHs is thus inferred, some of which emit GWs in the PTA frequency band. If the orbits of all binary SMBHs radiating GWs in the PTA frequency band are circular and evolving under GW emission alone, the summed GW signals from all binaries together have the expected spectral form (e.g., Phinney, 2001):
| (1) |
Here, is the GW characteristic strain per logarithmic frequency unit, is the GW frequency at the Earth, and is the characteristic spectral amplitude at . The summed signals from binary SMBHs may be collectively modelled as a GW background (GWB). GWs from individual binaries may be detectable as continuous-wave (CW) sources (e.g., Sesana et al., 2009; Ravi et al., 2012). Coalescing pairs of SMBHs also emit GW ‘memory’ bursts (Braginskii & Thorne, 1987; Favata, 2009), which are abrupt, propagating metric changes that also affect pulsar timing measurements (e.g., Madison et al., 2014).
Of these three types of GW signal, searches for a GWB provide the best constraints on models for the binary SMBH population (Shannon et al., 2013) and are perhaps the closest to yielding a successful detection (Siemens et al., 2013). Shannon et al. (2013) used the first PPTA data release (Manchester et al., 2013) to show that with 95% confidence. Siemens et al. (2013) suggest that the NANOGrav PTA is likely to be able to detect a GWB with by around the year 2020. Constraints on GWs from individual binary SMBHs with the current PPTA data set showed that binaries with component masses and with separations of less than 0.02 pc are unlikely to exist within 30 Mpc of the Earth (Zhu et al., 2014). No search for memory bursts with PTA data has so far been published. Wang et al. (submitted) describe an unsuccessful search for memory bursts using current PPTA data.
Predictions for GW signals from binary SMBHs are based either on physical models for galaxy formation and evolution which predict the binary SMBH population, or on directly observed quantities such as the galaxy merger rate and SMBH-galaxy scaling relations. The former predictions typically combine dark matter halo merger rates in the cold dark matter paradigm, analytic or numerical estimates of galaxy merger and binary SMBH formation timescales, prescriptions for the cosmic evolution of the galaxy and SMBH population and the assumption of GW-driven binary orbital evolution (Wyithe & Loeb, 2003; Enoki et al., 2004; Sesana et al., 2008; Ravi et al., 2012; Kulier et al., 2013; Ravi et al., 2014). Once tuned to reproduce observables such as local SMBH-galaxy relations, the galaxy stellar mass function (GSMF) and colour distribution, and the quasar luminosity function, these models result in estimates of in the range . The exact value depends on, for example, the assumed cosmological parameters, galaxy merger timescales and the specific models for SMBH formation and growth. Models for the binary SMBH population which more directly incorporate observational information (Jaffe & Backer, 2003; Sesana, 2013; McWilliams et al., 2014) result in similar values of . While various studies suggest that individual binary SMBHs may be viable CW sources of GWs for PTAs (Sesana et al., 2009; Ravi et al., 2012) as well as viable sources of memory bursts (van Haasteren & Levin, 2010; Cordes & Jenet, 2012; Madison et al., 2014), quantitative predictions of source counts have only been calculated for CW sources using theoretical galaxy formation models (Sesana et al., 2009).
In this paper, we adopt an observations-based approach towards modelling the binary SMBH population, in order to predict the range of GW signals in the PTA frequency band. A similar study by Sesana (2013), hereafter S13, combined a plethora of observational estimates of the merger rate of massive galaxies, the GSMF and local SMBH-galaxy relations to derive a range of possible GWB amplitudes. However, some of the observational quantities included in the S13 study do not represent the best current knowledge. Furthermore, some relevant uncertainties, such as in the possible redshift evolution of the SMBH-galaxy relations, were not accounted for by S13, and no predictions for individual GW sources were made. Besides addressing these issues, this paper builds on previous studies in the following ways:
-
•
We quantify the impacts of different observational uncertainties on the amplitude of the GWB generated by binary SMBHs. We focus in particular on aspects of our model for the binary SMBH population for which little observational information currently exists.
-
•
We highlight the redshifts, masses and types of merging galaxies which result in binary SMBHs which dominate the GWB amplitude.
-
•
We provide new, observations-based predictions for the counts of individual GW sources. We further present the first estimates for the expected numbers of detectable individual GW sources, given different PTA configurations, that are robust with respect to pulsar parameter fitting.
In §2, we outline our model, and present our results in §3. We state the key implications of this work for PTAs in §4. Finally, we discuss these results in §5, and summarise our conclusions in §6. Throughout this work, we adopt a concordance cosmology based on results from the Planck satellite (Planck Collaboration et al., 2013), including km s-1 Mpc-1, and .
2 An empirical model for GWs from binary SMBHs
2.1 The SMBH-SMBH coalescence rate
The cosmological population of binary SMBHs emitting GWs in the PTA frequency band can be characterised using the SMBH-SMBH coalescence rate. The numbers of binary SMBHs in different orbits are related to the coalescence rate through a continuity equation (Phinney, 2001; Ravi et al., 2014) that includes assumptions about the rate of binary SMBH orbital evolution.
We assume that the SMBH-SMBH coalescence rate is equivalent to the galaxy merger rate. This is justified because massive galaxy mergers are typically completed within a few galaxy dynamical times, whereas the timescales for two SMBHs to form a gravitationally-bound binary and then coalesce through losses of energy and angular momentum to their environments and GWs are much shorter (e.g., Begelman et al., 1980; Roedig & Sesana, 2012). In this work, we neglect systems of more than two gravitationally-interacting SMBHs resulting from multiple galaxy mergers, because we expect these to be rare for the high mass ratio ( mergers between massive () galaxies that we consider. We further assume that each galaxy contains a central SMBH with a mass related to the galaxy bulge mass. We use measured quantities to determine the all-sky coalescence rate of pairs of SMBHs. For each quantity, we define a fiducial prescription, and also describe the possible ranges over which the prescription can vary.
Similarly to S13, we express the galaxy merger rate as
| (2) | |||||
| (3) |
where is the number of mergers between two galaxies of combined stellar mass , is the ratio between the smaller and larger galaxy stellar masses and is the cosmological redshift. The merger rate, , is defined as the number of mergers per units , , and observer time . In Equation 3, is the number of galaxies across the entire sky with a given at a given . This is related to the standard GSMF, , as
| (4) |
where is the sky-integrated comoving volume shell between redshifts and . In Equation 4, is the probability density function for a galaxy merger event with mass at redshift having a mass ratio , is the average proper time between major mergers for a galaxy with a mass at redshift and . Also, is the number of mergers, , per unit proper time, , for a single galaxy with a mass at redshift .
In order to convert galaxy stellar masses to bulge masses () we distinguish between quiescent, red-sequence early-type galaxies and star-forming, blue-cloud late-type galaxies. We write the total GSMF as a sum of the GSMFs of early- () and late-type () galaxies:
| (5) |
We relate to for early- and late-type galaxies using a scheme described in §2.1.3.
To convert between and the central SMBH masses () we use the widely-known relation (Kormendy & Ho, 2013; Scott et al., 2013). In contrast to S13, we express this relation as
| (6) |
where denotes a normal probability density function with centre and variance and , and the intrinsic scatter, , are observationally-determined constants. It is important to account for intrinsic scatter in the relation when inferring the SMBH mass function from the bulge mass function (e.g., Aller & Richstone, 2002), because to not do so would lead to the SMBH mass function being underestimated.
2.1.1 The times between galaxy mergers
Observational estimates of require knowledge of the fraction of galaxies, , within a mass-complete sample at a given redshift that are undergoing mergers, and the proper time during which merger events can be observationally identified (for a review, see Conselice, 2014). Then, . In this work, we focus on major mergers with stellar mass ratios , because these systems are likely to dominate the GW signal (e.g., Sesana et al., 2004, S13).
We consider three recent measurements of for major mergers at different redshifts in wide-area galaxy surveys, which are largely complete for galaxy stellar masses . These three studies fit their data to the function , where and are free parameters.
-
•
Conselice et al. (2009) used structural analyses of concentration, asymmetry and clumpiness (the ‘CAS’ parameters) to identify systems in the process of merging among galaxies in the COSMOS and Extended Groth Strip surveys with at . This technique is sensitive to major mergers in particular, with mass ratios (Conselice, 2003). Conselice et al. (2009) found .
-
•
Xu et al. (2012) counted galaxy pairs with projected separations between 5 h-1 kpc and 20 h-1 kpc from the COSMOS survey to estimate for and . They scaled their results to include galaxy pairs for all using the argument that is inversely proportional to the logarithm of minimum mass ratio of the observed galaxy pair sample. Xu et al. (2012) found .
-
•
Both the above works may suffer from incorporating small galaxy samples at low redshifts. This issue was addressed by Robotham et al. (2014) using a large sample of galaxy pairs from the Galaxy and Mass Assembly (GAMA) survey in the redshift interval . When standardised to the same projected separation, galaxy mass and mass ratio windows as Xu et al. (2012), they found a substantially higher value of at these redshifts. By combining their results with all recent measurements of at redshifts up to 1.2, and normalising to the same projected pair separations of Xu et al. (2012), Robotham et al. (2014) found .
Other works have estimated with varying levels of accuracy. S13 included results from the galaxy pair studies of Bundy et al. (2009), de Ravel et al. (2009) and López-Sanjuan et al. (2012). However, Bundy et al. (2009) and de Ravel et al. (2009) had significantly smaller pair samples than were utilised by either Xu et al. (2012) or Robotham et al. (2014), and López-Sanjuan et al. (2012) only considered major mergers of galaxies with .
In the absence of observational estimates of the galaxy merger timescale () used in calculating from different measurements of , we make use of theoretical predictions. However, the range of possible predictions spans a factor of three. Kitzbichler & White (2008) used a mock galaxy catalogue from a semi-analytic model implemented within the Millennium simulation (Springel et al., 2005) to estimate for galaxies with different masses at different stages of merging assuming circular galaxy orbits and angular momentum loss through dynamical friction. However, a suite of hydrodynamic simulations of galaxy mergers conducted by Lotz et al. (2008) and Lotz et al. (2010), hereafter collectively L08, resulted in significantly shorter merger timescales. While some authors (e.g., Bundy et al., 2009; Robotham et al., 2014) use the estimates of Kitzbichler & White (2008) to calculate , others (e.g., Conselice et al., 2009; Xu et al., 2012; Conselice, 2014) argue that these estimates are incorrect, at least for major mergers (see footnote 15 of Hopkins et al., 2010). Analyses of cosmological hydrodynamical simulations combining dark matter and baryonic components suggest that the merger timescales assumed in semi-analytic models of galaxy formation and used by Kitzbichler & White (2008) are overestimated for major mergers (Jiang et al., 2008). Furthermore, L08 presented estimates of specifically calibrated to the CAS technique of Conselice et al. (2009) using mock galaxy images. Here, as a fiducial case, we only use the estimates of from L08, specific to estimates of from both galaxy pair counts and CAS analyses. These merger timescales were averaged over both field and cluster environments, and hence account for environmental dependencies. However, the simulation suite of L08 was not large enough to reveal significant mass- or redshift-dependence of . Hence, we consider it possible that the weak dependencies on these quantities identified by Kitzbichler & White (2008) may be present.
We therefore have the three following estimates of the times between galaxy mergers:
| (7) | |||||
| (8) | |||||
| (9) |
based on the work of Conselice et al. (2009), Xu et al. (2012) and Robotham et al. (2014) respectively. While we consider each of Equations 79 to be equally possible, we choose Equation 7 (Conselice et al., 2009) as a fiducial prescription. The possible mass- and redshift-dependence of is given by the factor (Kitzbichler & White, 2008); we further consider it equally likely that this factor is present or absent, while choosing its absence as fiducial. Together, there are then six different possibilities for that we consider, each with observational uncertainties. We also demonstrate the effects on the GW signal from binary SMBHs of using systematically larger values of that are consistent with Kitzbichler & White (2008).
The fitting formulae in Equations 79 are consistent with results at higher redshifts (Conselice, 2014). We hence adopt these equations for , and also assume (Xu et al., 2012). Uncertainties in for do not significantly affect our predictions for GW signals from binary SMBHs, because, as we demonstrate, it appears that these signals are dominated by contributions from binary SMBHs at lower redshifts.
2.1.2 The GSMF
We use the latest measurements of the GSMF for in the range based on the COSMOS/UltraVISTA catalogue (Muzzin et al., 2013). Muzzin et al. (2013) present GSMFs for quiescent (early-type) and star-forming (late-type) galaxies, which were identified using a colour cut. Utilising UV to mid-IR galaxy photometry, with improved sensitivity and sky-coverage over previous compilations, these authors provide the most accurate determinations of the early- and late-type GSMFs currently available.
However, we still need to account for a selection of systematic errors. Muzzin et al. (2013) use redshift, luminosity and mass measurements obtained through spectral energy distribution analyses. Assuming galaxy magnitude measurements of sufficient accuracy, systematic errors in the photometric redshifts and galaxy stellar mass measurements are dominated by how the stellar populations are modelled (e.g., Bernardi et al., 2010; Mitchell et al., 2013; Courteau et al., 2014). Systematic errors in stellar mass measurements can lead to errors in the GSMF of greater than 0.6 dex (Mitchell et al., 2013). Muzzin et al. (2013) present five separate determinations of the GSMFs of early- and late-type galaxies using different choices for the stellar population synthesis model and star formation history, as well as expanded possibilities for galaxy metallicities and dust attenuation laws. We assume that each of these five GSMF determinations, for which Schechter function fits are given in Table 3 of Muzzin et al. (2013), are equally likely to be correct, but choose the default GSMF of Muzzin et al. (2013), given in their Table 1, as fiducial.
The method of colour selection used to identify early- and late-type galaxies adds further systematic uncertainty to the GSMF estimates. For example, Bernardi et al. (2010) showed that edge-on dusty spiral galaxies are in fact the reddest among the galaxy population, and that more than a third of a red-sequence sample of galaxies could be actively star-forming objects. While Bernardi et al. (2010) suggest further simple morphological selections based on galaxy light concentrations to mitigate these effects, these data were not available in the COSMOS/UltraVISTA catalogue. Instead, we use a crude estimation of the uncertainty range of the GSMF caused by the colour selection from Muzzin et al. (2013), who presented GSMFs determined for significantly different colour cuts to their fiducial scheme (their Table 4). We consider this entire range of variability in the GSMF to be possible. We also demonstrate the effects on the resulting GW signal of possible contamination of colour-selected early-type galaxy samples with late-type galaxies in an extreme scenario by also performing our calculations with the early-type GSMF reduced by .
2.1.3 Relating to
The scheme we use to relate to for different types of galaxies is summarised as follows.
- •
-
•
Early-type galaxies with consist of a significant fraction that are best modelled with both bulges and disks, which are identified with the S0 (lenticular) galaxy population (Lackner & Gunn, 2012; Mendel et al., 2014; Meert et al., 2014). These galaxies have values of which are approximately log-normally distributed with mean 0.7 and log-deviation dex. A mild correlation between and may be present for S0 galaxies (Mendel et al., 2014), which we neglect in this work.
-
•
For , approximately 75% of early-type galaxies are S0s and 25% are true ellipticals (Emsellem et al., 2011). These fractions change to 55% and 45% respectively for larger stellar masses.
While these results are quite approximate, and only derived for a low-redshift () galaxy sample, we adopt them as a fiducial scheme for relating to for . This scheme is roughly consistent with that used by S13.
In the same way as accounting for scatter in the relation raises the inferred SMBH mass function (e.g., Aller & Richstone, 2002), the bulge mass function inferred from the GSMF will be raised given scatter in relating to . Scatter in the relations can be simply combined with the scatter in the relation by modifying Equation 6 as follows:
| (10) |
where we assume for both early- and late-type galaxies. In summary, the function in our fiducial model is defined by
| (11) |
We demonstrate the effects of possible errors in the fraction of early-type galaxies which are ellipticals by considering cases where this fraction is reduced and increased by 50%.
2.1.4 Relating to
Despite intense interest in evincing the relation over the last 15 years, the form of the relation remains uncertain (Kormendy & Ho, 2013; Scott et al., 2013). Kormendy & Ho (2013) argue that the relation is well modelled by a single power law for all galaxies containing classical bulges which include ellipticals, S0s and spirals with bulges displaying steep central light gradients. However, Scott et al. (2013) find, using an extended version of the galaxy sample of Graham et al. (2011) and independent measurements of , that two power laws are required, with a break at . A physical distinction between the two power laws was identified by splitting the sample into ‘cusp’ galaxies with steep power-law central light gradients and galaxies where ‘cores’, or light-deficits with respect to a cusp, are present. Cusp galaxies are typically of lower masses than core galaxies, and were found by Scott et al. (2013) to have a steeper log-linear relation than core galaxies.
While we the consider the relations of Kormendy & Ho (2013) and Scott et al. (2013) equally likely, we choose the simpler relation of Kormendy & Ho (2013) as a fiducial case. In Equation 10, Kormendy & Ho (2013) find , and . Scott et al. (2013) instead find and for and and for . As Scott et al. (2013) do not estimate the intrinsic scatter, we assume for the entire range of .
We do not consider estimates of the relation made substantially prior to Kormendy & Ho (2013) and Scott et al. (2013). Previous estimates are thought to be incorrect because of systematic errors in SMBH and bulge mass estimates, the absence of recently-measured SMBH masses in brightest cluster galaxies, and the presence of galaxies without classical bulges in samples used to fit the relations (for details, see Kormendy & Ho, 2013). Various authors infer modest redshift evolution in the relation such that the typical ratio may be up to a factor of larger at than the local value (Kormendy & Ho, 2013, and references therein). This can be approximately represented by letting with and as above. As a fiducial case, however, we assume the conservative value of .
2.2 GW signals from binary and coalescing SMBHs
In this paper, we assume that all binary SMBHs are in circular orbits that evolve only under losses of energy and angular momentum to GWs. While the effects of binary SMBH environments and non-zero orbital eccentricities could modify the GW characteristic strain spectrum from the form in Equation 1 at frequencies up to Hz at the Earth, these effects are highly uncertain (Ravi et al., 2014, and references therein). For frequencies Hz within the PTA band (e.g., at ), the characteristic strain spectrum does indeed take the form of Equation (1), because the orbits of all binaries radiating GWs at these frequencies are likely to have circularised because of GW-driven evolution. Our assumption allows for direct comparison with the majority of studies on this topic (Jaffe & Backer, 2003; Wyithe & Loeb, 2003; Enoki et al., 2004; Sesana et al., 2008; Ravi et al., 2012; Kulier et al., 2013; Sesana, 2013), and for the GWB spectrum to be characterised by a single amplitude ().
A circular binary SMBH radiates monochromatic GWs at twice its orbital frequency. We use standard expressions from the literature for the rms GW strain amplitude, (e.g., Equation 7 of Sesana et al., 2008) radiated by a circular binary, and the rms GW-induced sinusoidal variations to the pulse times of arrival (ToAs) from radio pulsars, (e.g., Equation 20 of Sesana et al., 2009). Both and are averaged over all binary orientation parameters. Following Cordes & Jenet (2012), we approximate the strain amplitude of a memory burst from a coalescing binary SMBH as
| (12) |
where is the reduced mass of the coalescing binary system.
To calculate the GWB amplitude for a population of binary SMBHs, consider a multivariate density function, , for the observed binary SMBH coalescence rate, , in terms of a -component parameter vector with components indexed by an integer :
| (13) |
Following, e.g., Sesana et al. (2008), is given by
| (14) |
Here, for the domains of and under consideration.
2.3 Assembling the model
Mergers between galaxies containing bulges with masses and come in nine types, because the galaxies with each mass may be either elliptical, S0 or late-type. In each case, a different prescription is required to identify the bulge masses of the merging galaxies, and hence the masses of the SMBHs in the merging galaxies. Consider a merger between a galaxy of type , with mass , and a galaxy of type , with mass , where and each denote either an elliptical, S0 or late-type galaxy. The fraction of cases where this merger will occur is given by , where is given by Equation 5 and the mass functions are evaluated at a mass . For early-type galaxies, is specified according to the fractions of ellipticals and S0s at different masses, and for late-type galaxies, is simply the fraction which contain bulges. The SMBH masses corresponding to the galaxies of types and , and respectively, are described by the probability density function in Equation 10 for given by and respectively. Hence, in order to calculate , we combine Equations 3, 4, 5, 10 and 14 as follows:
| (15) | ||||
We evaluate this integral numerically by summing over the integrand in bins of , , , , and . To determine the predicted numbers of CW sources, we count the numbers of individual binary SMBHs in each bin with different values of radiating GWs at within a nominal bandwidth of . We also record the rate of memory bursts in each bin with corresponding amplitudes . These latter operations are equivalent to numerically evaluating the conditional densities of GW sources in terms of and .
Equation 15 builds on the approach of S13 in two ways. First, we account for the effects of intrinsic scatter in the relation and in relating to . We also attempt to match the numbers of galaxy mergers of different types to the measured GSMFs, rather than assuming the same galaxy pair fractions for all types of mergers.
3 Results
3.1 The GWB amplitude
We first calculated using Equation 15 given the fiducial prescriptions for , the GSMF, the scheme relating and and the relation, as detailed in sections 2.1.12.1.4. The resulting fiducial value for was . We then identified the possible ranges of consistent with the observational uncertainties in each of , the GSMF and the relation alone. This was accomplished by generating 600 realisations of with the parameters of a single one of these quantities randomised and with the other terms in Equation 15 held fixed at their fiducial values. The process was then repeated with randomisation individually in the other two quantities.
Histograms of the resulting three samples of realisations of are shown in the middle three panels of Figure 1, along with the fiducial value of (as a vertical dashed line). While the possible ranges of given observational uncertainties in and the GSMF are roughly equivalent, observational uncertainty in the relation results in a slightly larger range of possible values.

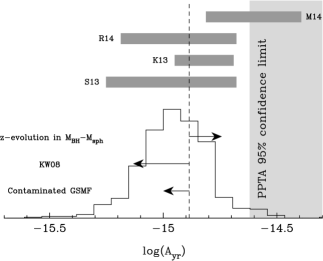
We also considered the effects of adopting four modifications to the fiducial model relating to parameters for which current observational constraints are poor. These modifications, which were introduced in Subsections 2.1.12.1.4, result in the following values of :
-
1.
When we decrease the early-type GSMF by a factor of to simulate an extreme case of contamination of colour-selected early-type galaxy samples by late-type galaxies (e.g., edge-on spirals), we obtain . This represents a decrease of 0.12 dex over the fiducial model.
-
2.
When we adopt the massive galaxy merger timescale from Kitzbichler & White (2008) with the associated mass- and redshift-dependence, rather than from numerical simulations of galaxy mergers (L08), we obtain . This represents a decrease of 0.24 dex over the fiducial model.
-
3.
When we introduce a redshift-dependent normalisation, , of the relation with such that the normalisation is a factor of three greater at , we obtain . This is an increase of 0.14 dex over the fiducial model.
-
4.
Finally, when we explore the effects of either reducing or increasing the fraction of early-type galaxies which are ellipticals by 50%, we obtain an associated variation in of 5% (0.02 dex).
The first three modifications are clearly significant, as compared to the fourth: we depict the resulting values of in the top panel of Figure 1. While the effects of modifications () and () are comparable in magnitude, adopting the galaxy merger timescales of Kitzbichler & White (2008) makes a large difference to the prediction of . This is expected, because the Kitzbichler & White (2008) merger timescales are roughly a factor of three longer than those of L08. Indeed, modification () results in a value of that is lower than the 2.5% percentile of the distributions of values given the three observational uncertainties considered so far.
As an illustration of the full range of possible values of the GWB amplitude given the uncertainties considered in , the GSMF and the relation combined with modifications listed above, we generated a new sample of 600 realisations of . In this case, we simultaneously randomised over , the GSMF and the relation as described above, and also (i) decreased the early-type GSMF by a factor uniformly drawn from the interval , (ii) set the galaxy merger timescale at a value uniformly drawn between the predictions of L08 and Kitzbichler & White (2008) (neglecting any mass- or redshift- dependence), and (iii) set the redshift-evolution index of the normalisation of the relation to a number uniformly drawn from the interval . A histogram of the resulting sample of realisations of is shown in the bottom panel of Figure 1, labelled ‘All’. The long tail to lower values of , which is not reflected in the other histograms, is caused specifically by the inclusion of uncertainties in the galaxy merger timescale and in the early-type GSMF. The magnitudes of these effects on are indicated by the arrows at the top of Figure 1. The 95% confidence interval on , considering all uncertainties, is .
We next compare our results for with earlier predictions. In Figure 2, we again show the histogram of realisations of corresponding to randomisation over all uncertainties, as well as the values of corresponding to modifications () to () listed above. Above these, we show the 68% confidence intervals on from four recent, independent models for the binary SMBH population (S13; Kulier et al., 2013; Ravi et al., 2014; McWilliams et al., 2014). The predictions that we consider all account for the most recent determinations of the relation (Kormendy & Ho, 2013; Scott et al., 2013).
The range of possible values of predicted by S13 is consistent with (albeit somewhat broader than) the range we predict given all uncertainties that we consider in this paper. Both the present work and S13 attempt to synthesise all uncertainties in quantities relevant to characterising the SMBH-SMBH coalescence rate, and use the same underlying model assumptions to predict the GWB amplitude. Our range of predictions is less extended than that of S13 because of the greater uncertainty assumed by S13 in the GSMF and the galaxy merger rate.111Some methodological differences also exist between the present work and S13 in how different realisations of were obtained.
A semi-analytic approach (Guo et al., 2011) was used by Ravi et al. (2014) to predict SMBH-SMBH coalescence rates within the Millennium simulation (Springel et al., 2005), coupled with prescriptions for binary SMBH orbital evolution in stellar environments (Sesana, 2010). The results of Ravi et al. (2014) indicate that the characteristic strain spectrum may be attenuated relative to the case of circular binary orbits and GW-driven evolution at frequencies Hz. However, the 68% confidence interval on the characteristic strain spectral amplitude at a frequency of is consistent with the range of values of we find.

The prediction of Kulier et al. (2013) is derived from hydrodynamic numerical galaxy formation simulations in cluster and field environments, but may be biased relative to semi-analytic galaxy formation models implemented in large-volume numerical dark matter simulations because of the specific choice of overdense and underdense regions to study. However, the prediction of Kulier et al. (2013) naturally includes a particiularly sophisticated treatment of galaxy merger timescales.
McWilliams et al. (2014) suggest a model for the binary SMBH population which includes the assumption that all evolution in the early-type GSMF at is driven by galaxy mergers; however, their predicted GWB amplitude appears to be inconsistent with current PTA constraints (Shannon et al., 2013). This model would necessarily include a shorter galaxy merger timescale than that predicted by L08 in order to maintain consistency with the observed numbers of merging galaxies. Overall, besides the study of McWilliams et al. (2014), it is encouraging that different models appear to agree on the amplitude of the characteristic strain spectrum from binary SMBHs. In particular, the upper ends of most predicted ranges of all appear to be consistent.
In Figure 2, we also depict the best existing 95% confidence upper limit on from Shannon et al. (2013) as a shaded region. Some realisations of given observational uncertainties in our model are inconsistent with this upper limit. However, the upper limit is generally consistent with our model given all uncertainties.
In Figure 3, we plot the values of predicted by the fiducial model in different ranges of (left panel) and (right panel). We also show the 95% confidence intervals on these values given all uncertainties we consider. The galaxy mass ranges correspond to the values of of the larger galaxies in mergers. The dominant contributions to the GWB are from binary SMBHs formed in mergers involving galaxies with , and from binary SMBHs at redshifts . The confidence intervals that we provide further suggest that contributions to the GWB from outside these ranges are not significant.222While the most massive galaxies do not appear to contribute significantly to the GWB, it is apparent from, e.g., Figure 6 of Muzzin et al. (2013) (see also Baldry et al., 2012) that the Schechter function fits to the early-type GSMFs under-predict the observed GSMF at masses . Finally, binary SMBHs created in mergers involving at least one late-type galaxy correspond to , whereas mergers involving only early-type galaxies correspond to . Hence, within our model, the GWB is likely to be dominated by galaxy mergers involving only early-type galaxies (S0s and ellipticals).
3.2 Individual GW sources: continuous waves and memory bursts
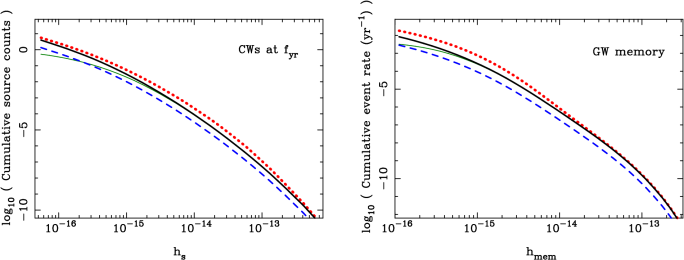
In the process of evaluating Equation 15, we also calculated the numbers of individual binary SMBHs that produce monochromatic (CW) GW signals, along with the numbers of GW memory bursts emitted during SMBH-SMBH coalescence events. We counted individual binaries emitting GWs at frequencies in a frequency bin of width and evaluated the numbers of binaries with different GW strain amplitudes . These results are shown in the left panel of Figure 4 for the fiducial model as well as for two variations to the fiducial model (modifications (ii) and (iii) listed above). We also show results for the fiducial model while restricting the source counts to binaries at redshifts and with the more massive progenitor galaxy mass . The restricted source counts are identical to the full source counts for . From Sesana et al. (2009), the characteristic amplitude of the sinusoidal ToA variations induced by a binary SMBH with strain amplitude at , over a 10 yr observation, is ns.
Scaling these CW source counts to other GW frequencies is non-trivial. The GW strain amplitude of a binary SMBH radiating at a frequency can be expressed as , where is the strain amplitude radiated by that binary at a frequency . Furthermore, the total number of binaries per unit frequency radiating GWs at a frequency is related to the number of binaries per unit frequency radiating GWs at by the factor , assuming GW-driven binary orbital evolution. Then, the number of binaries per unit frequency emitting GWs at or above a strain amplitude of , at a frequency , may be written as . For example, while the fiducial model predicts CW sources with in a frequency bin of width at , this prediction changes to 0.1 sources at with in the same frequency bin width.
We can hence directly compare our predicted CW source counts with the work of Sesana et al. (2009). These authors considered a wide variety of SMBH growth scenarios within the framework of a semi-analytic model for galaxy formation (Bertone et al., 2007) implemented in the Millennium simulation results (Springel et al., 2005). We directly compare predictions for the number of binary SMBHs inducing ToA variations with characteristic amplitudes ns. For consistency, we consider an observation time span of yr and GW frequencies Hz, and integrate over the number of sources per unit frequency with ns in the range Hz (integrating to higher frequencies does not significantly alter our results). We neglect the issue of whether these signals are resolvable given the presence of a GWB. We predict 0.6 CW sources with ns for our fiducial model, 0.1 CW sources for a pessimistic model assuming the galaxy merger timescales of Kitzbichler & White (2008), and 1.2 CW sources for our optimistic model with significant redshift-evolution in the relation. Sesana et al. (2009) predict between 0.05 and 3 such sources (their Figure 3), which is consistent with our results.
We also predicted the numbers of binary SMBH coalescence events per observed year at or above a given GW memory burst amplitude, (see Equation 12) for . The results are shown in the right panel of Figure 4, again for the fiducial model and two variations to this model. We also again show results for the fiducial model with the restrictions of and ; for , the restrictions make no significant difference.
In summary, the expected numbers of individual GW sources predicted by our empirical binary SMBH model are small. At most CW source is expected to induce ToA variations with characteristic amplitudes ns over a 5 yr observation time span. Also, approximately one GW memory burst with is expected every 1000 yr.
4 Implications for GW detection with PTAs
4.1 The GWB from binary SMBHs
The future sensitivities of PTAs to the GWB are the subjects of ongoing research (e.g., Siemens et al., 2013; Moore et al., 2014; Hobbs et al., 2014). For example, future pulsar observing systems and cadences, new pulsar discoveries, the effects of the interstellar medium and pulsar timing noise characteristics, all of which significantly affect PTA sensitivities, are difficult to forecast because of a lack of quantitative, predictive models. An idealised treatment of the problem by Siemens et al. (2013) suggests that, for the NANOGrav collaboration, a GWB with amplitude may be detectable before the year 2020. We note that Siemens et al. (2013) assumed that the GWB characteristic strain spectrum has the power law form given in Equation 1. We find in this paper that the GWB amplitude is likely to be in the range with 95% confidence. If the GWB amplitude were to lie in the upper part of this range, as is expected given the more commonly preferred major galaxy merger timescale (L08), we suggest that detecting a GWB from binary SMBHs is indeed an attainable, short-term goal for PTAs.333If we calculate the range of possible values given all uncertainties, while assuming the L08 galaxy merger timescales, we find with 95% confidence.
What can PTA upper limits on or detections of the GWB reveal about the determinants of the GWB amplitude? The GWB may be parameterised by a single number, (at least at GW frequencies Hz; Ravi et al., 2014), the value of which is dependent on myriad quantities. Useful information can be gleaned if one of these quantities is particularly unconstrained otherwise. For example, if we remain agnostic with respect to the galaxy merger timescale, a particular value of this timescale would correspond to a range of possible GWB amplitudes given our knowledge of all the other determinants of . Then, a PTA constraint on would correspond to a constraint on the galaxy merger timescale, given the assumptions inherent in our model. Through such exercises, PTAs could directly impact our understanding of galaxy and SMBH growth, in a more general sense than by testing specific GWB models using PTA data. We leave a demonstration of such techniques for future work.
4.2 CW signals from individual binary SMBHs
Future PTA observations with planned telescopes such as the Five Hundred Metre Aperture Spherical Telescope (FAST, Li, Nan & Pan 2013) and the Square Kilometre Array (SKA, Cordes et al., 2004) may include up to 100 pulsars with timing noise standard deviations of 100 ns (Lazio, 2013; Hobbs et al., 2014). Ellis et al. (2012) constructed theoretical PTA sensitivity curves using simulated data sets with both 100 arbitrarily-located pulsars or 17 pulsars at the locations of the best-timed pulsars observed by the NANOGrav collaboration, in all cases with timing noise standard deviations of 100 ns and 5 yr observation times. These sensitivity curves, shown in their Figure 5, represent the values of at different frequencies at which the probability of a false detection was less than in 95% of realisations of their simulated data sets. Importantly, the sensitivity curves were averaged over all source positions and orientations, and account for pulsar parameter fitting. We predict the numbers of detectable sources for PTAs with these sensitivity curves by evaluating the following integral:
| (16) |
where is the sensitivity curve and is the predicted number of sources with strain amplitudes per unit frequency at a frequency . The sensitivities of PTAs to CW sources are generally poor for frequencies Hz and few sources are expected at these frequencies.
Using our predictions for the numbers of CW sources, we evaluate by scaling the predictions as described in §3.2. Then, for the fiducial model and for the two sensitivity curves of Ellis et al. (2012) corresponding to their coherent -statistic, we obtain predictions of 0.07 and 1.3 detectable sources for the 17- and 100-pulsar cases respectively. For the restricted fiducial model, corresponding only to sources with and these reduce marginally to 0.06 and 1 source respectively. For the optimistic case with strong redshift-evolution of the relation, we obtain predictions of 0.2 and 2.8 detectable sources for the 17- and 100-pulsar cases respectively. In contrast, the current PPTA sensitivity curve produced by Zhu et al. (2014) corresponds to detectable sources. ‘Noise’ caused by the summed GW signal from the binary SMBH population will further increase the difficulty of detecting individual binaries (e.g., Sesana et al., 2009; Ravi et al., 2012).
4.3 GW memory bursts from coalescing binary SMBHs
A PTA data set with 20 pulsars timed with a precision of 100 ns for 10 yr is sensitive to memory bursts with amplitudes over of the data span (van Haasteren & Levin, 2010; Cordes & Jenet, 2012). As the sensitivity of such an idealised PTA to memory bursts scales roughly as the square root of the number of pulsars (van Haasteren & Levin, 2010), a PTA with 100 pulsars timed with 100 ns precision for 10 yr may be sensitive to memory bursts with . However, our model suggests that only bursts with and bursts with are expected over 10 yr. Thus, under the model presented here, GW memory bursts from coalescing binary SMBHs do not represent viable sources for PTAs.
5 Discussion
Our predictions for the GWB amplitude, , are conservative within their respective scenarios, for a number of reasons. (i) We do not account for minor galaxy mergers with stellar mass ratios , or for mergers where the more massive galaxy has a mass . (ii) We do not consider the possibility of gas accretion onto SMBHs prior to coalescence during galaxy mergers (e.g., Van Wassenhove et al., 2012), which would raise the SMBH masses and hence the emitted GW amplitudes (e.g., Sesana et al., 2008). (iii) The most massive galaxies are typically found in cluster environments, where times between galaxy mergers may be shorter (cf. Lotz et al., 2013), implying a higher merger rate for these galaxies and hence a higher GW signal. However, we do not expect the inclusion of these factors to significantly affect our predicted GWB amplitudes. We reiterate that the effects of interactions between binary SMBHs and their environments are unlikely to affect the predictions for the GWB amplitude at frequencies Hz (Sesana, 2013b; Ravi et al., 2014), such as at . This is because the orbital evolution of binary SMBHs radiating GWs at these frequencies is expected to be predominantly GW-driven, which further leads to the circularisation of the orbits.
Of all sources of uncertainty we consider in predicting the GWB amplitude given relevant observational quantities, the choice of galaxy merger timescale dominates the range of possible GWB amplitudes. Furthermore, the merger timescale may be even more uncertain than the range spanned by the predictions we consider (L08; Kitzbichler & White, 2008). The simulations of L08 were conducted only for mergers between gas-rich disk galaxies, some of which contained small bulges, whereas we find that the GWB is likely dominated by binary SMBHs formed in mergers solely between early-type galaxies. Further theoretical studies of galaxy merger timescales for early-type systems are clearly required in order to better predict the GWB amplitude. The dominance of low-redshift () early-type major galaxy mergers of massive () galaxies in determining the GWB amplitude is a further important consequence of our work for both theoretical and observational studies of galaxy mergers aimed at informing PTA research.
The other significant source of uncertainty in our predictions is in the relation, both in its local form and in its possible redshift-evolution. In contrast to uncertainty in the galaxy merger timescale, it is likely that this uncertainty will only be resolved through further observations which significantly expand the sample of known SMBH masses. Promisingly, Davis et al. (2013) report that hundreds of SMBH mass measurements may be possible with the Atacama Large Millimetre Array (ALMA).
Under what circumstances could the GWB amplitude lie outside the range we predict given all uncertainties that we consider? The predicted range of GWB amplitudes, , encompasses all purely observational uncertainties, as well as uncertainty ranges that we set for other quantities for which observational constraints are poor, such as the galaxy merger timescale. It may be possible that these latter ranges are incorrect. Furthermore, not all galaxies may host a central SMBH, as we have assumed. The interaction between a binary SMBH and a third SMBH would likely cause the least massive SMBH to be ejected (e.g., Gerosa & Sesana, 2014), lowering the number of coalescing SMBHs. If not every massive galaxy at formed with a central SMBH, the GWB amplitude would again be lowered. It may also be possible that binary SMBHs do not always coalesce on timescales less than the times between galaxy mergers.
The presence of a few strong GW emitters among the binary SMBH population implies that some excess, non-Gaussian scatter will be present in the GW signals produced by this population. The magnitude of this excess scatter in depends on exactly how many binary SMBH systems contribute significantly to the GWB. Using a semi-analytic galaxy formation model implemented in the Millennium simulation (Guo et al., 2011), Ravi et al. (2012) suggested that the statistics of ToA variations induced by GWs from binary SMBHs are mildly non-Gaussian for frequencies because of appreciable contributions to the squared characteristic strain spectrum, , from individual binaries at every GW frequency. Figure 5 shows the number of binary SMBHs in our fiducial model corresponding to galaxy mergers with primary stellar masses greater than or equal to a given (top), as well as the fractions of contributed by these binaries (bottom). We show in particular binaries radiating at a GW frequency of in a frequency bin of width . Our fiducial model suggests that the contributions of individual GW sources to are lower than estimated by Ravi et al. (2012). For example, the modelling in Ravi et al. (2012) found that one source contributed of at a frequency of in a frequency bin of width (their Figure 2). In contrast, our empirical modelling in this paper suggests that the strongest sources in such a frequency bin contribute of .

This work and Ravi et al. (2012) clearly predict different numbers of the most massive binary SMBHs. While this discrepancy will only be resolved with GW observations, we point out that the Schechter functions for the GSMFs that we use under-predict observed galaxy counts at the highest masses and the lowest redshifts (Baldry et al., 2012; Muzzin et al., 2013). Hence, it is possible that our model under-represents the contributions of the most massive binary SMBHs to the total GW signal. Differing typical galaxy merger mass ratios in cluster and field environments (e.g., Lotz et al., 2013) are a further complicating factor.
6 Conclusions
In this paper, we predicted the strength of the GWB from binary SMBHs and the occurrence of individual binary SMBH GW sources. Our approach was to use a selection of recent observational estimates for the average times between major mergers for galaxies with and and for the GSMFs of early- and late-type galaxies in this mass and redshift range. We combined these quantities with empirical relations between galaxy and bulge stellar masses and between bulge and SMBH masses.
We find that while current PTAs are unlikely to be sensitive to individual binary SMBHs, a PTA consisting of 100 pulsars timed with 100 ns precision for 5 yr will be sensitive to up to binary SMBHs. Such a PTA may be achievable with the SKA (Lazio, 2013), but is possibly beyond the capabilities of FAST (Hobbs et al., 2014). Even such a PTA will, however, have a less than 0.1% chance of detecting a GW memory burst from a coalescing binary SMBH. Thus, we conclude that while individual binary SMBHs may be detectable with a PTA based on next-generation radio telescopes, memory bursts from coalescing SMBHs are not likely to be detectable with any envisaged PTA.
We predict that the characteristic strain amplitude of the GWB lies in the range with 95% confidence, accounting for a variety of uncertainties. The upper end of the predicted amplitude range is equivalent to the best published 95% confidence upper limit on the GWB amplitude (Shannon et al., 2013). This reinforces the conclusion of Shannon et al. (2013) that some models for the binary SMBH population that are consistent with current electromagnetic observations are already inconsistent with PTA constraints on the GWB.
The dominant uncertainty in predicting the GWB amplitude appears to be caused by differences in theoretical predictions for the major merger timescale of massive galaxies. Higher values within our predicted range for correspond to the more commonly preferred choice of galaxy merger timescale (L08); GWB amplitudes are within the sensitivity ranges of current and future PTAs. We strongly urge further work on quantifying the galaxy merger timescale, in particular for the mergers between massive early-type galaxies at redshifts which are likely to host the dominant contributors to the GWB. The other significant uncertainty in our predictions is in the local form and possible redshift-evolution of the relation. PTA upper limits on or detections of the GWB may be able to meaningfully improve our knowledge of such otherwise poorly constrained facets of the formation and evolution of galaxies and SMBHs.
Acknowledgements
The authors thank Alberto Sesana for useful discussions and Justin Ellis for sharing results on predicted sensitivity curves. The authors also acknowledge the comments of the anonymous referee, which helped to significantly improve the manuscript. V.R. is a recipient of a John Stocker Postgraduate Scholarship from the Science and Industry Endowment Fund and J.S.B.W. acknowledges an Australian Research Council Laureate Fellowship. GH is supported by an Australian Research Council Future Fellowship. This work was performed on the swinSTAR supercomputer at the Swinburne University of Technology.
References
- Aller & Richstone (2002) Aller, M. C., & Richstone, D. 2002, AJ, 124, 3035
- Arzoumanian et al. (2014) Arzoumanian, Z., Brazier, A., Burke-Spolaor, S., et al. 2014, arXiv:1404.1267
- Baldry et al. (2012) Baldry I. K., Driver S. P., Loveday J., Taylor E. N., Kelvin L. S., Liske J., Norberg P., Robotham A. S. G., Brough S., Hopkins A. M., Bamford S. P. et al., 2012, MNRAS, 421, 621
- Barnes & Hernquist (1992) Barnes J. E., Hernquist L., 1992, ARA&A, 30, 705
- Begelman et al. (1980) Begelman M. C., Blandford R. D., Rees M. J., 1980, Nat, 287, 307
- Bernardi et al. (2010) Bernardi, M., Shankar, F., Hyde, J. B., et al. 2010, MNRAS, 404, 2087
- Bertone et al. (2007) Bertone, S., De Lucia, G., & Thomas, P. A. 2007, MNRAS, 379, 1143
- Boroson & Lauer (2009) Boroson T. A., Lauer T. R., 2009, Nat, 458, 53
- Braginskii & Thorne (1987) Braginskii V. B., Thorne K. S., 1987, Nat, 327, 123
- Bundy et al. (2009) Bundy, K., Fukugita, M., Ellis, R. S., et al. 2009, ApJ, 697, 1369
- Conselice (2003) Conselice C. J., 2003, ApJS, 147, 1
- Conselice (2014) Conselice, C. J. 2014, arXiv:1403.2783
- Conselice et al. (2009) Conselice C. J., Yang C., Bluck A. F. L., 2009, MNRAS, 394, 1956
- Cordes & Shannon (2010) Cordes, J. M., & Shannon, R. M. 2010, arXiv:1010.3785
- Cordes & Jenet (2012) Cordes J. M., Jenet F. A., 2012, ApJ, 752, 54
- Cordes et al. (2004) Cordes J. M., Kramer M., Lazio T. J. W., Stappers B. W., Backer D. C., Johnston S., 2004, New Astronomy Review, 48, 1413
- Courteau et al. (2014) Courteau, S., Cappellari, M., de Jong, R. S., et al. 2014, Reviews of Modern Physics, 86, 47
- Davis et al. (2013) Davis, T. A., Bureau, M., Cappellari, M., Sarzi, M., & Blitz, L. 2013, Nature, 494, 328
- de Ravel et al. (2009) de Ravel, L., Le Fèvre, O., Tresse, L., et al. 2009, A&A, 498, 379
- Detweiler (1979) Detweiler S., 1979, ApJ, 234, 1100
- Dotti et al. (2007) Dotti, M., Colpi, M., Haardt, F., & Mayer, L. 2007, MNRAS, 379, 956
- Ellis et al. (2012) Ellis J. A., Siemens X., Creighton J. D. E., 2012, ApJ, 756, 175
- Emsellem et al. (2011) Emsellem, E., Cappellari, M., Krajnović, D., et al. 2011, MNRAS, 414, 888
- Enoki et al. (2004) Enoki M., Inoue K. T., Nagashima M., Sugiyama N., 2004, ApJ, 615, 19
- Eracleous et al. (2012) Eracleous, M., Boroson, T. A., Halpern, J. P., & Liu, J. 2012, ApJS, 201, 23
- Escala et al. (2004) Escala A., Larson R. B., Coppi P. S., Mardones D., 2004, ApJ, 607, 765
- Estabrook & Wahlquist (1975) Estabrook F. B., Wahlquist H. D., 1975, General Relativity and Gravitation, 6, 439
- Favata (2009) Favata M., 2009, ApJ, 696, L159
- Foster & Backer (1990) Foster R. S., Backer D. C., 1990, ApJ, 361, 300
- Frank & Rees (1976) Frank J., Rees M. J., 1976, MNRAS, 176, 633
- Gerosa & Sesana (2014) Gerosa, D., & Sesana, A. 2014, arXiv:1405.2072
- Graham et al. (2011) Graham, A. W., Onken, C. A., Athanassoula, E., & Combes, F. 2011, MNRAS, 412, 2211
- Guo et al. (2011) Guo Q., White S., Boylan-Kolchin M., De Lucia G., Kauffmann G., Lemson G., Li C., Springel V., Weinmann S., 2011, MNRAS, 413, 101
- Hellings & Downs (1983) Hellings, R. W., & Downs, G. S. 1983, ApJL, 265, L39
- Hobbs et al. (2009) Hobbs G., Jenet F., Lee K. J., Verbiest J. P. W., Yardley D., Manchester R., Lommen A., Coles W., Edwards R., Shettigara C., 2009, MNRAS, 394, 1945
- Hobbs et al. (2010) Hobbs, G., Archibald, A., Arzoumanian, Z., et al. 2010, Classical and Quantum Gravity, 27, 084013
- Hobbs et al. (2014) Hobbs, G., Dai, S., Manchester, R. N., et al. 2014, arXiv:1407.0435
- Hopkins et al. (2010) Hopkins, P. F., Croton, D., Bundy, K., et al. 2010, ApJ, 724, 915
- Jaffe & Backer (2003) Jaffe A. H., Backer D. C., 2003, ApJ, 583, 616
- Jiang et al. (2008) Jiang, C. Y., Jing, Y. P., Faltenbacher, A., Lin, W. P., & Li, C. 2008, ApJ, 675, 1095
- Khan et al. (2012) Khan F. M., Preto M., Berczik P., Berentzen I., Just A., Spurzem R., 2012, ApJ, 749, 147
- Kitzbichler & White (2008) Kitzbichler, M. G., & White, S. D. M. 2008, MNRAS, 391, 1489
- Kormendy & Ho (2013) Kormendy J., Ho L. C., 2013, ARA&A, 51, 511
- Kramer & Champion (2013) Kramer, M., & Champion, D. J. 2013, Classical and Quantum Gravity, 30, 224009
- Kulier et al. (2013) Kulier, A., Ostriker, J. P., Natarajan, P., Lackner, C. N., & Cen, R. 2013, arXiv:1307.3684
- Lackner & Gunn (2012) Lackner, C. N., & Gunn, J. E. 2012, MNRAS, 421, 2277
- Lazio (2013) Lazio, T. J. W. 2013, Classical and Quantum Gravity, 30, 224011
- Lee et al. (2011) Lee, K. J., Wex, N., Kramer, M., et al. 2011, MNRAS, 414, 3251
- Li et al. (2013) Li D., Nan R., Pan Z., 2013, in IAU Symposium Vol. 291 of IAU Symposium, The Five-hundred-meter Aperture Spherical radio Telescope project and its early science opportunities. pp 325–330
- López-Sanjuan et al. (2012) López-Sanjuan, C., Le Fèvre, O., Ilbert, O., et al. 2012, A&A, 548, A7
- Lotz et al. (2008) Lotz J. M., Jonsson P., Cox T. J., Primack J. R., 2008, MNRAS, 391, 1137
- Lotz et al. (2010) Lotz, J. M., Jonsson, P., Cox, T. J., & Primack, J. R. 2010, MNRAS, 404, 575
- Lotz et al. (2013) Lotz J. M., Papovich C., Faber S. M., Ferguson H. C., Grogin N., Guo Y., Kocevski D., Koekemoer A. M., Lee K.-S., McIntosh D., Momcheva I., Rudnick G., Saintonge A., Tran K.-V., van der Wel A., Willmer C., 2013, ApJ, 773, 154
- Madison et al. (2014) Madison, D. R., Cordes, J. M., & Chatterjee, S. 2014, arXiv:1404.5682
- Manchester et al. (2013) Manchester R. N., Hobbs G., Bailes M., Coles W. A., van Straten W., Keith M. J., Shannon R. M., Bhat N. D. R., Brown A., Burke-Spolaor S. G., Champion D. J., et al. 2013, PASA, 30, 17
- Manchester & IPTA (2013) Manchester R. N., IPTA 2013, Classical and Quantum Gravity, 30, 224010
- McLaughlin (2013) McLaughlin, M. A. 2013, Classical and Quantum Gravity, 30, 224008
- McWilliams et al. (2014) McWilliams, S. T., Ostriker, J. P., & Pretorius, F. 2014, ApJ, 789, 156
- Meert et al. (2014) Meert, A., Vikram, V., & Bernardi, M. 2014, arXiv:1406.4179
- Mendel et al. (2014) Mendel, J. T., Simard, L., Palmer, M., Ellison, S. L., & Patton, D. R. 2014, ApJS, 210, 3
- Merritt & Milosavljević (2005) Merritt D., Milosavljević M., 2005, Living Reviews in Relativity, 8, 8
- Miller et al. (2014) Miller, B. P., Gallo, E., Greene, J. E., et al. 2014, arXiv:1403.4246
- Mitchell et al. (2013) Mitchell, P. D., Lacey, C. G., Baugh, C. M., & Cole, S. 2013, MNRAS, 435, 87
- Moore et al. (2014) Moore, C. J., Taylor, S. R., & Gair, J. R. 2014, arXiv:1406.5199
- Muzzin et al. (2013) Muzzin A., Marchesini D., Stefanon M., Franx M., McCracken H. J., Milvang-Jensen B., Dunlop J. S., Fynbo J. P. U., Brammer G., Labbé I., van Dokkum P. G., 2013, ApJ, 777, 18
- Peters & Mathews (1963) Peters P. C., Mathews J., 1963, Physical Review, 131, 435
- Phinney (2001) Phinney, E. S. 2001, arXiv:astro-ph/0108028
- Planck Collaboration et al. (2013) Planck Collaboration, Ade, P. A. R., Aghanim, N., et al. 2013, arXiv:1303.5076
- Quinlan (1996) Quinlan G. D., 1996, New Astronomy, 1, 35
- Ravi et al. (2012) Ravi V., Wyithe J. S. B., Hobbs G., Shannon R. M., Manchester R. N., Yardley D. R. B., Keith M. J., 2012, ApJ, 761, 84
- Ravi et al. (2014) Ravi, V., Wyithe, J. S. B., Shannon, R. M., Hobbs, G., & Manchester, R. N. 2014, MNRAS, 442, 56
- Robotham et al. (2014) Robotham, A. S. G., Driver, S. P., Davies, L. J. M., et al. 2014, arXiv:1408.1476
- Rodriguez et al. (2006) Rodriguez C., Taylor G. B., Zavala R. T., Peck A. B., Pollack L. K., Romani R. W., 2006, ApJ, 646, 49
- Roedig et al. (2011) Roedig C., Dotti M., Sesana A., Cuadra J., Colpi M., 2011, MNRAS, 415, 3033
- Roedig & Sesana (2012) Roedig, C., & Sesana, A. 2012, Journal of Physics Conference Series, 363, 012035
- Sazhin (1978) Sazhin M. V., 1978, SvA, 22, 36
- Scott et al. (2013) Scott, N., Graham, A. W., & Schombert, J. 2013, ApJ, 768, 76
- Sesana (2010) Sesana A., 2010, ApJ, 719, 851
- Sesana (2013) Sesana A., 2013, MNRAS, 433, L1
- Sesana (2013b) Sesana, A. 2013b, Classical and Quantum Gravity, 30, 224014
- Sesana et al. (2004) Sesana, A., Haardt, F., Madau, P., & Volonteri, M. 2004, ApJ, 611, 623
- Sesana et al. (2008) Sesana A., Vecchio A., Colacino C. N., 2008, MNRAS, 390, 192
- Sesana et al. (2009) Sesana A., Vecchio A., Volonteri M., 2009, MNRAS, 394, 2255
- Shankar et al. (2013) Shankar F., Weinberg D. H., Miralda-Escudé J., 2013, MNRAS, 428, 421
- Shannon et al. (2013) Shannon R. M., Ravi V., Coles W. A., Hobbs G., Keith M. J., Manchester R. N., Wyithe J. S. B., Bailes M., Bhat N. D. R., Burke-Spolaor S., Khoo J., Levin Y., Oslowski S., Sarkissian J. M., van Straten W., Verbiest J. P. W., Want J.-B., 2013, Science, 342, 334
- Siemens et al. (2013) Siemens X., Ellis J., Jenet F., Romano J. D., 2013, Classical and Quantum Gravity, 30, 224015
- Simard et al. (2011) Simard, L., Mendel, J. T., Patton, D. R., Ellison, S. L., & McConnachie, A. W. 2011, ApJS, 196, 11
- Springel et al. (2005) Springel, V., White, S. D. M., Jenkins, A., et al. 2005, Nat, 435, 629
- Valtonen et al. (2008) Valtonen M. J., Lehto H. J., Nilsson K., Heidt J., Takalo L. O., Sillanpää A., Villforth C., Kidger M., Poyner G., Pursimo T., Zola S., Wu J.-H., Zhou X. e. a., 2008, Nat, 452, 851
- van Haasteren & Levin (2010) van Haasteren R., Levin Y., 2010, MNRAS, 401, 2372
- Van Wassenhove et al. (2012) Van Wassenhove, S., Volonteri, M., Mayer, L., et al. 2012, ApJL, 748, L7
- Wyithe & Loeb (2003) Wyithe J. S. B., Loeb A., 2003, ApJ, 590, 691
- Xu et al. (2012) Xu C. K., Zhao Y., Scoville N., Capak P., Drory N., Gao Y., 2012, ApJ, 747, 85
- Yardley et al. (2010) Yardley D. R. B., Hobbs G. B., Jenet F. A., Verbiest J. P. W., Wen Z. L., Manchester R. N., Coles W. A., van Straten W., Bailes M., Bhat N. D. R., Burke-Spolaor S., Champion D. J., Hotan A. W., Sarkissian J. M., 2010, MNRAS, 407, 669
- Yu (2002) Yu Q., 2002, MNRAS, 331, 935
- Yu & Tremaine (2002) Yu Q., Tremaine S., 2002, MNRAS, 335, 965
- Zhu et al. (2014) Zhu, X.-J., Hobbs, G., Wen, L., et al. 2014, arXiv:1408.5129