Order-disorder transition in swirled granular disks
Abstract
We study the order-disorder transition of horizontally swirled dry and wet granular disks by means of computer simulations. Our systematic investigation of the local order formation as a function of amplitude and period of the external driving force shows that a large cluster of hexagonally ordered particles forms for both dry and wet granular particles at intermediate driving energies. Disordered states are found at small and large driving energies. Wet granular particles reach a higher degree of local hexagonal order, with respect to the dry case. For both cases we report a qualitative phase diagram showing the amount of local order at different state points. Furthermore we find that the transition from hexagonal order to a disordered state is characterised by the appearance of particles with square local order.
pacs:
45.70.-n, 64.70.D-, 05.70.LnI Introduction
The segregation of grains with different sizes is of importance in many industries. In the last 30 years the segregation problem attracted much attention due to the complexity of the Brazil Nut Effect Rosato et al. (1987), i.e. the rise of large intruder particles in vertically oscillated granulates. Different phenomena contribute to this effect Knight et al. (1993); Cooke et al. (1996); Pöschel and Herrmann (1995); Kudrolli (2004); Schröter et al. (2006); Majid and Walzel (2009) and their characterisation is complex due to the large number of parameters controlling the dynamics of the system. Among these parameters, the gravitational force and the height of the granular bed play an important role.
On the other hand, already the gold miners of the 1899 Klondike river gold rush knew that by applying a swirling motion to a pan of sand the desired gold nuggets were slowly exposed Lagal (1992). The simple horizontal movement can be used to obtain size segregation without the influence of the gravitational force. The granular bed’s height is also not important when a monolayer of particles is studied. The occurrence of segregation of differently sized grains under ’swirling’ was studied experimentally Aumaitre et al. (2001); Schnautz et al. (2005), and later the dynamics of a single intruder was analysed by Chung et al. (2008).
The complex segregation behaviour lies on top of a rich dynamical behaviour of single sized particles that has been little studied in this system. Work has been done on the dynamical motion of the granular matter Scherer et al. (1996); Feltrup et al. (2009), as well as the formation of solid-like clusters Kötter et al. (1999); Scherer et al. (2000). Recently, May et al. (2013) investigated in more detail the formation of solid clusters and found that the melting of the solid clusters occurs first at their surface.
The formation of compact ordered structures can have huge impact on the diffusion of the particles and the segregation of particles of different sizes. In this paper we present a systematic simulation study of the order-disorder transition that is induced by the horizontal swirling of granular disks. Within the correct envelope of amplitudes and oscillation periods we find a transition from disordered fluid-like granular clusters to hexagonally ordered clusters in both dry and wet granular matter. At high driving energies the transition to disordered structure occur due to the strong compression of the granular clusters at the container wall. We find that this transition is characterised by a predominance of particles with local square order.
This paper is organised as follows. In Sec. II we briefly introduce the simulation technique and the model used for the description of the granular particles, while results for both dry and wet granular matter are given in Sec. III. In Sec. IV we draw our conclusions, while in appendix A we describe the application of the order parameter to our two dimensional system.
II Model and Method
We study a system of monodispersed disks with diameter and equal mass in a circular container of radius . The numerical value of the container radius is based on the experiments of May et al. (2013).
The pair interaction between particles is modelled by an Hertzian pair-contact collision model. For each contact between two pairs of particles at positions and , with velocities and , and angular velocities and we define a contact plane.
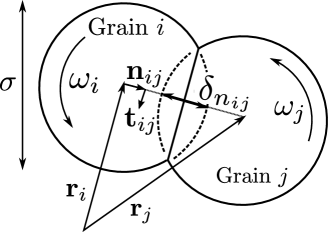
The two vectors that generate the contact plane are the normal unit vector , and the relative velocity . Figure 1 shows a sketch of the collision model projected in the collision plane: the total force is decomposed in the normal direction and the tangential directions , where the relative velocities in the normal and tangential directions are
| (1) | |||||
| (2) |
The forces are modelled as Sun et al. (2006); Lee (1994)
| (3) | |||||
| (4) |
with the displacements and in the normal and tangential directions, respectively. The parameters and are the stiffness coefficients in the normal and tangential direction, respectively. The energy dissipated during the duration of the contact is regulated by the damping coefficients and and the effective mass . In addition, we model the static friction by keeping track of the elastic shear displacement over the contact lifetime and truncate it such that the condition is satisfied, where is the static friction coefficient.
The force controlling the collision between particle and the container’s wall are modelled by Eqs. (4) with the wall being described by a particle with infinite mass leading to an effective mass .
The damping force between the particles and the bottom of the container is , where is a damping coefficient and and are the velocities of particle and of the bottom wall, respectively.
Once the forces on all particles are known the total force and torque on a particle is determined by
| (5) | |||||
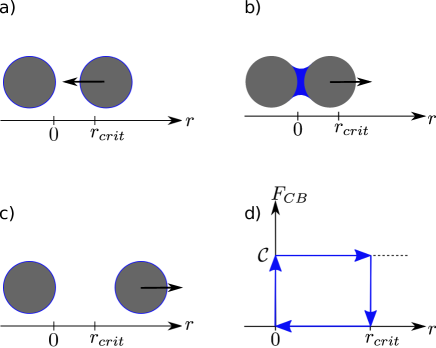
Wet granular particles interact via additional forces caused by the formation and dissolution of capillary bridges. This complex process is modelled in a simple way by the minimal capillary model (MCM) Herminghaus (2005) that describes the bonding due to capillary bridges via an hysteretic cycle (Fig. 2). The bridge between a pair of particles is only formed upon first contact, i.e. the interaction is zero until contact occurs. Subsequently the particles experience a constant attractive force until a critical distance, is reached. For separation distances larger than the critical distance the force is zero. We do not consider capillary bridges formation between the particles and the wall of the container.
The fundamental units of our simulation model are the particle mass , the particle diameter and the gravitational acceleration . Consequently, the derived units are the time , velocity , force , elastic constant , and damping coefficient . The numerical values of the simulation parameters are shown in Table I.
II.1 Simulation details
We carry out computer simulations using a standard Molecular Dynamics technique, in which the equations of motion are integrated via a Velocity-Verlet algorithm Allen and Tildesley (1987); Frenkel and Smit (2002). The time step of the simulation is Lee (1994), where the contact time is estimated by Schaefer et al. (1996)
| (6) |
| Particles | |
|---|---|
| Particles | |
| Particles | 0.9 |
| Particles | 60 ( |
| Particles | 0 ( |
| Wall | |
| Wall | |
| Wall | 0.5 |
| Wall | 60 ( |
| Wall | 30 ( |
| 10 ( | |
| 0.1 () |
The circular container lies in the - plane and is driven in a swirling motion according to
where and are the coordinates of the centre of the container, is the amplitude of the oscillation, is the period of the oscillation and is the time.
The particles in the container are initialised at random and the simulation is carried out for swirling cycles. During the simulation we analyse the local structure of each particle by means of the local bond order parameter, which allows us to distinguish between particles in a fluid or crystalline environment. Furthermore, we distinguish between hexagonal and square symmetries for the crystalline particles. Details about the implementation are given in appendix A.
III Results
III.1 Order-Disorder transition for dry granular disks
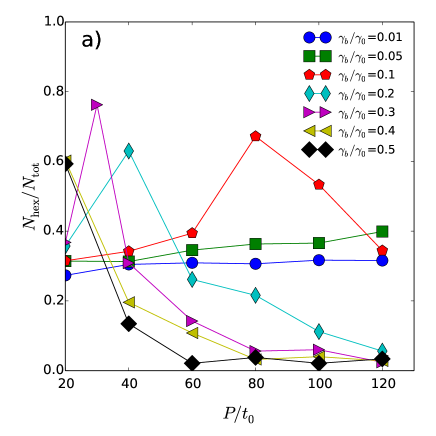
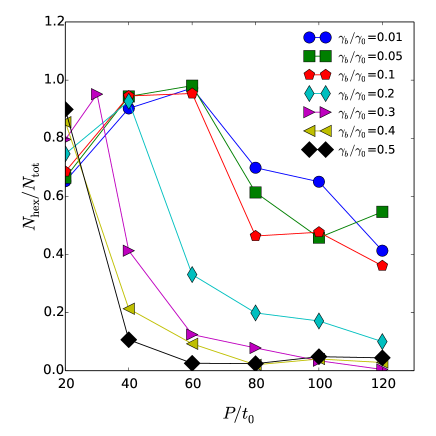
We begin the investigation of the dry granular disks by evaluating the effect of the energy dissipation that occurs due to the contact of the disks with the bottom wall. To this end we fix the amplitude of oscillation and the number of particles . The fraction of particles with hexagonal order is plotted against the periods of oscillation for different values of the bottom damping coefficient in Fig. 3a).
For and 0.05 we find an almost constant value of for all periods of oscillation while at we find a maximum at =80. For increasing (more dissipation) the location of the maximum moves toward decreasing values of the period (more input energy).
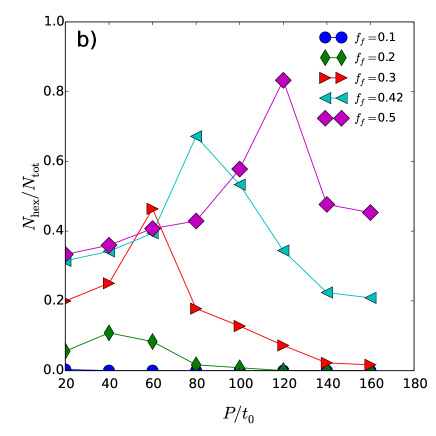
In Fig. 3b) we report the values of at different container filling fractions and at a fixed damping coefficient . At the filling fraction is the maximum of at =80 is recovered. At larger filling fractions we obtain maximum hexagonal order at larger periods of oscillation (smaller driving energy), while at smaller filling fractions, the maximum in is obtained at smaller values of . These results can be simply summarised by stating that order is more easily achieved at high filling fractions.
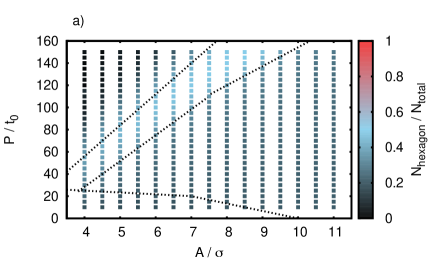
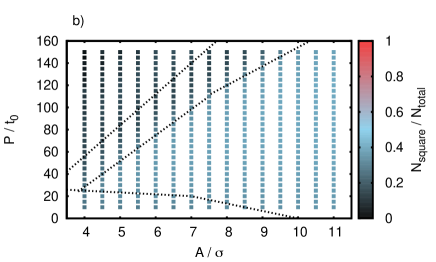
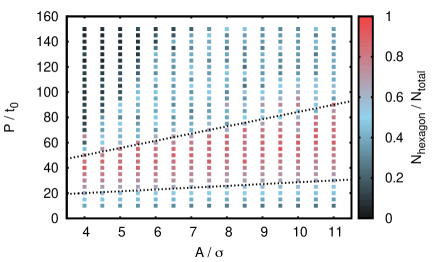
We now proceed with the systematic investigation of the order transition in dry granular disks at fixed (filling fraction =0.42) and damping coefficient with the bottom wall . For each state point a computer simulation was run for 100 oscillations. We calculated the fraction of particles with hexagonal and square order using the local bond order parameter and averaging its value over 80 oscillations. The results are summarised in Fig. 4. The fraction of particles with either hexagonal or square order is given by the colour of the points. The dashed lines are guides to the eye to distinguish regions with different predominant local order, and delimits region with a fraction of ordered particles larger than 0.25.
We find that at large periods of oscillation and small amplitudes , corresponding to a low amount of driving energy, most particles are in a disordered state, i.e the fraction of square-ordered and hexagonal-ordered particles is less than 0.25. In this region of the diagram, the particles in the centre of the container are not affected by the wall due to the small oscillation amplitudes, while the particles initially close to the wall are gently pushed toward the centre.
We find a second region in the diagram that is rich in disordered particles, namely at small amplitudes and small periods of oscillation. Here the particles close to the wall are squeezed strongly to the wall while the particle in the centre remain basically unaffected by the container’s motion because of the small amplitudes.
At intermediate driving energies the phase diagram is dominated by hexagonal order. Interestingly, an increase in driving energy leads to a decrease of hexagonally ordered particles and a dramatic increase in particles with local square order.
It is worth to stress that in dry granular disks no attractive interaction between the disks is present. The formation of hexagonal order might be related to the entropically driven order transition of purely repulsive colloidal systems. On the other hand the square rich regions does not have a counterpart in equilibrium colloidal systems.
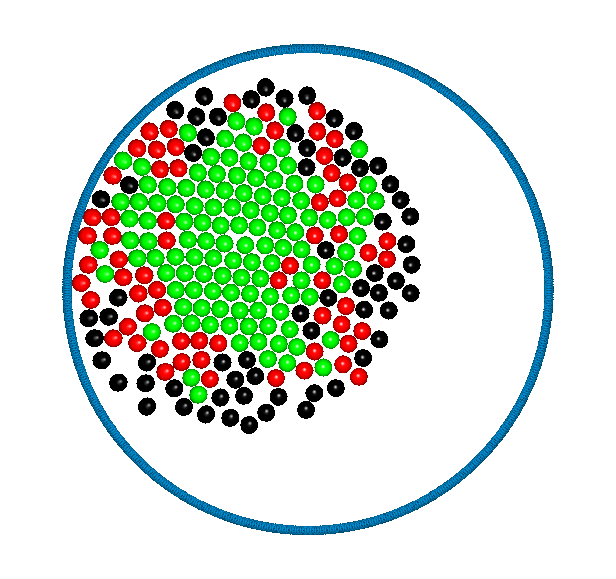
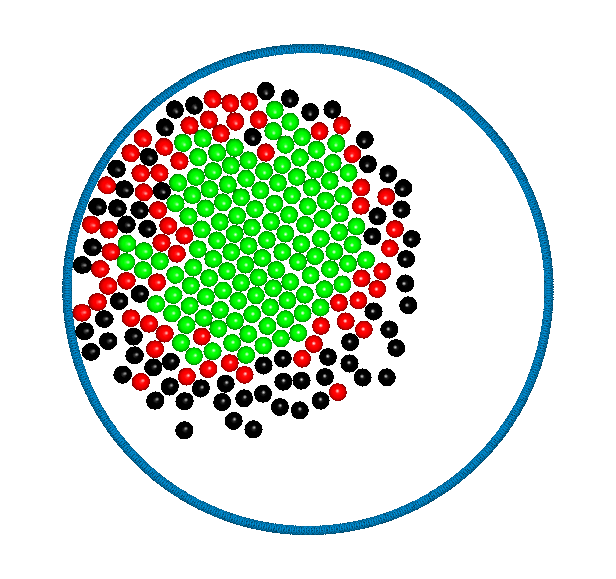
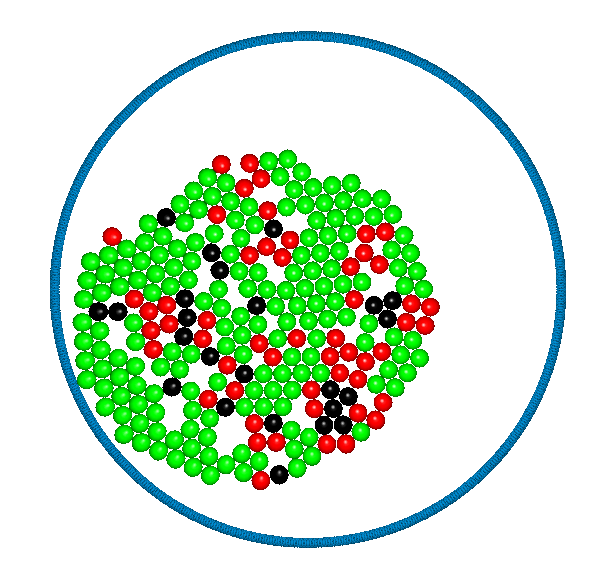
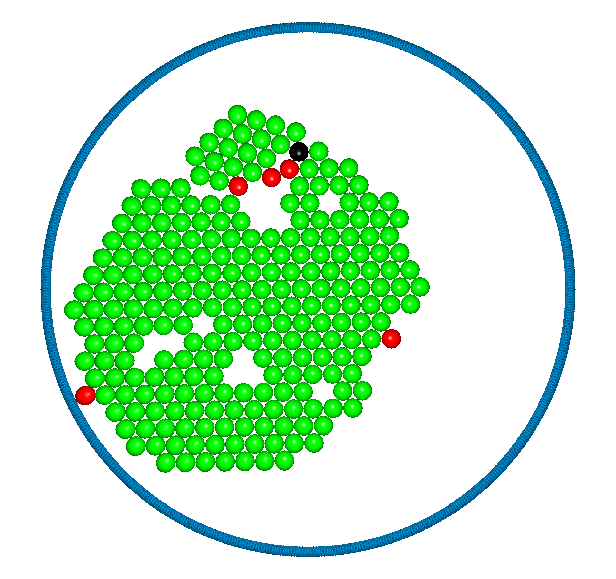
More insights in the order-disorder transition can be gained by looking at simulation snapshots. The snapshots in Fig. 5 are taken during a simulation with amplitude and period . In all snapshots the green disks have hexagonal order, the red disk have square order and the blue particles are disordered. After 1 oscillation (Fig. 5 a) the particles are mainly disordered and few clusters of hexagonal order are visible. After 5 oscillations (Fig. 5 b) )we find a large cluster with circular shape. Particles with hexagonal local order are in the centre of the container. Around it we find square ordered and disordered particles. The overall structure remains qualitatively unchanged at later times (Fig. 5 c-d) .
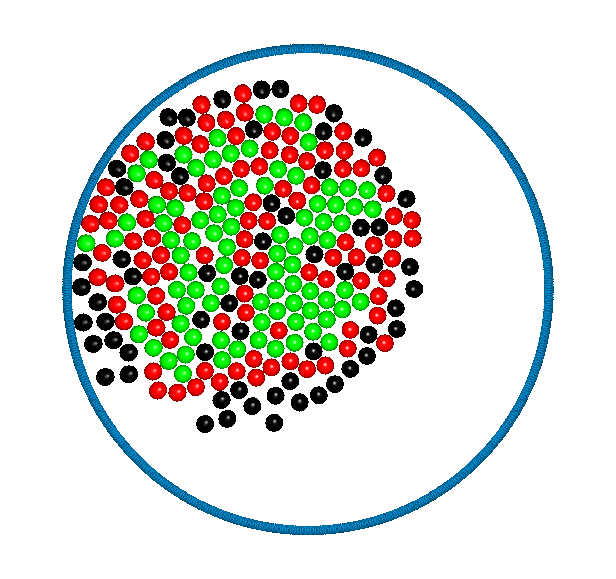
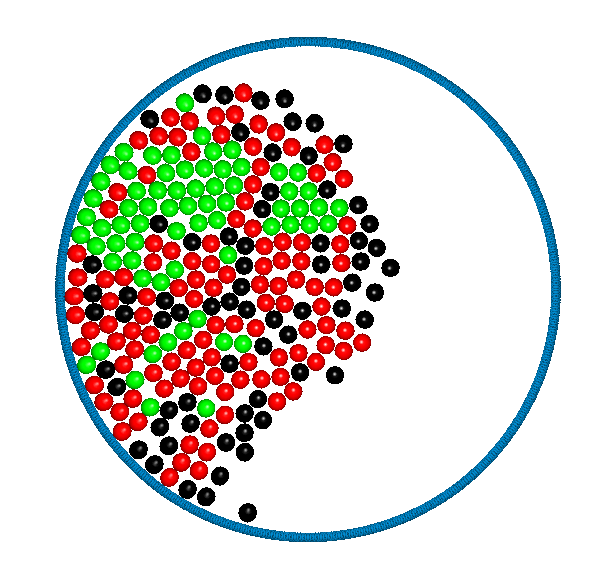
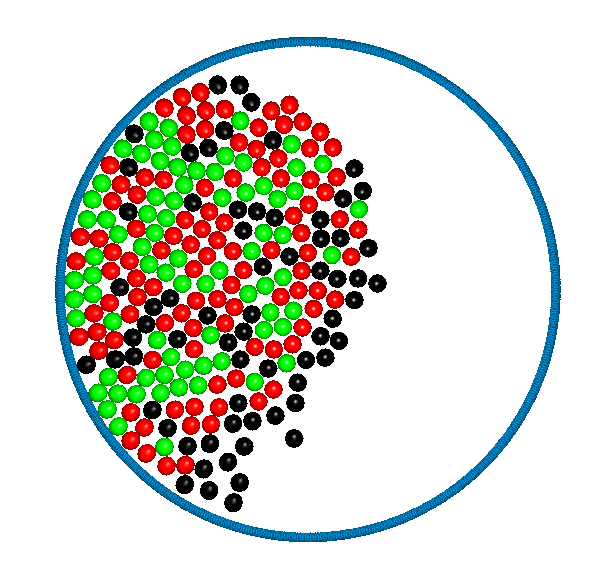
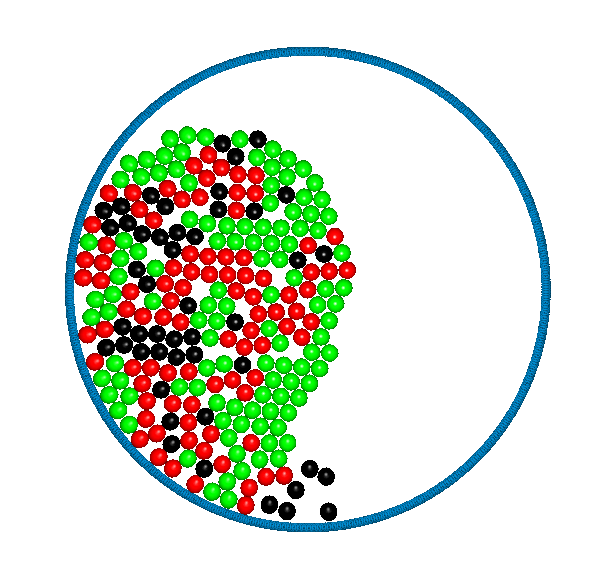
By increasing the external driving energy we see how the structure changes dramatically (Fig. 6 at amplitude and period ). We note that the granular cluster is slightly deformed and the particles show a large amount of square local order.
III.2 Order-Disorder transition for wet granular disks
For wet granular particles the Fig. 7 shows the fraction of particles with hexagonal order plotted against the period for different values of the damping coefficient (dissipation at the bottom wall).
In contrast with the case of dry disks that showed a maximum fraction of hexagonally order particles of about 0.6, wet disks reach a fraction of hexagonally ordered particles of 1. The dashed lines are guides to the eye to distinguish regions a fraction of ordered particles larger than 0.6.
For there is almost no dependence on the bottom damping coefficient. The attractive interaction allows the formation of hexagonal ordered clusters even when there is little dissipation with the bottom wall. For coefficients the maximum order occurs at always smaller periods of oscillations, similar to the behaviour described for dry disks.
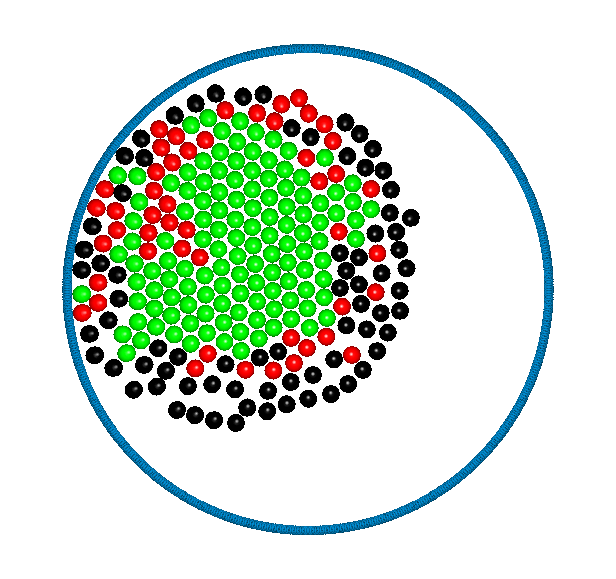
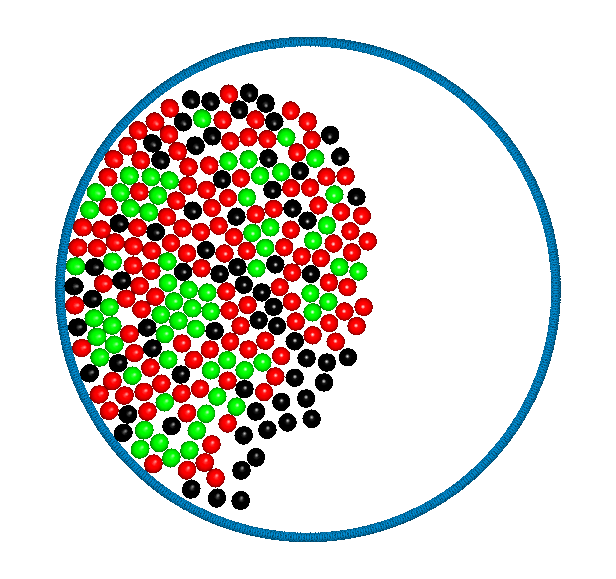
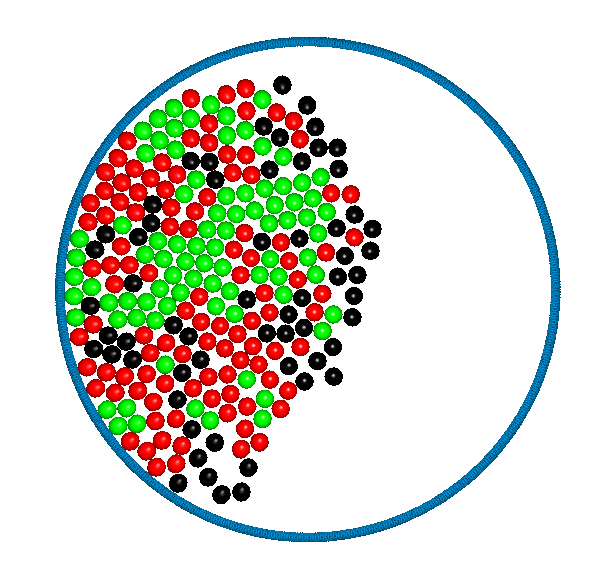
We repeated the systematic study of the order-disorder transition for the wet particles. The results are summarised in Fig. 8. The region with predominant hexagonal order (Fig. 9b) is shifted, with respect the case of dry disks, toward smaller periods of oscillations and larger amplitudes, i.e. larger driving energy. At larger energies the almost perfect order is destroyed and the particles are squeezed to the wall (Fig. 9c). At smaller energies, the particles form small clusters of hexagonally ordered clusters connected to each other via grain boundaries (Fig. 9a).
By comparing the diagram of Fig. 8 for wet particles and the diagram of Fig. 4 for dry disks we note that dry particles show a maximum order of 0.6 in a region where wet particles also have an hexagonal order of about 0.5-0.6. On the other hand, the structure of the overall granular cluster is very different in the two cases. Whereas for dry particles we find a large uniform cluster of hexagonally ordered particles (Fig. 6) , for wet particle the structure consist of small hexagonal clusters sparsely connected to each other (Fig. 9a).
IV Conclusions
In conclusion, we investigated the order-disorder transition of dry and wet granular disks in a cylindrical container which is driven by a horizontal swirling motion. We find that even for dry particles there is a well defined region of the parameter space, defined by the oscillation amplitude and period, where a large fraction of the particles show local hexagonal order. At larger driving energies the hexagonal order is destroyed and the particles are squeezed to the wall, leading to a large amount of particles with square local order.
For the case of wet particles the attractive interaction of the capillary bridges enhances dramatically the amount of hexagonal order. Due to the strong attractive interaction between the disks mediated by the capillary bridges, the driving energy required for the formation of circular clusters with high hexagonal order is higher for wet particles than for dry disks.
From the results of both dry and wet granular disk we can conclude that clusters of hexagonally ordered particles occurs when a balance between the energy dissipation at the bottom wall (higher dissipation for higher ) external driving energy (higher energy for smaller ) is reached.
The dynamics of the disordered structures was not investigated, but it would be interesting to see if if the dynamical behaviour is related to the dynamics of the glass transition. Furthermore, we point out that in our simulations of two dimensional disks we do not find the type of surface melting found in the experiments of May et al. (2013). This result could be an indirect confirmation that the surface melting is due to the rolling friction of granular spheres with the bottom container as proposed in Ref. May et al. (2013) . We plan to carry out three dimensional simulations of our model system to confirm this hypothesis and further investigate the origin and properties of the surface melting phenomenon.
The formation of compact ordered structures can influence particle diffusion and consequently the segregation dynamics of differently sized particles. The understanding of the melting and order formation phenomena can therefore lead to a better understanding of segregation phenomena. Further work is in progress to analyse the dynamical properties of the phases reported in this article as well as the jamming transition and to relate them to the occurrence of segregation.
Appendix A Bond order parameter
The local bond order parameter provides a measure of the local symmetry of a particle by looking at the distance and orientation of neighbouring particles. In general the bond order parameter is calculated according to Steinhardt et al. (1983)
| (7) |
where is defined as
With is the number of next neighbors of the particle , is an integer, is an integer which runs from to and are the spherical harmonics with the azimuthal angle between particle and , , and the polar angle, .
For a two-dimensional system we fix the angle for all pairs .
Therefore, for the case the order parameter reads
| (8) |
with
The angle is
In two dimensions one can distinguish three different types of order: chains, square and hexagonal. Table 2 gives the corresponding values of .
| Structure | Coordination | |
|---|---|---|
| Chain | 2 | 1 |
| Square | 4 | 0.5863 |
| Hexagonal | 6 | 0.7408 |
Acknowledgements.
We thank Kai Huang, Matthias Schmidt and Ingo Rehberg for discussions.References
- Rosato et al. (1987) A. Rosato, K. J. Strandburg, F. Prinz, and R. H. Swendsen, Phys. Rev. Lett. 58, 1038 (1987).
- Knight et al. (1993) J. B. Knight, H. M. Jaeger, and S. R. Nagel, Phys. Rev. Lett. 70, 3728 (1993).
- Cooke et al. (1996) W. Cooke, S. Warr, J. M. Huntley, and R. C. Ball, Phys. Rev. E 53, 2812 (1996).
- Pöschel and Herrmann (1995) T. Pöschel and H. J. Herrmann, Europhys. Lett. 29, 123 (1995).
- Kudrolli (2004) A. Kudrolli, Rep. Prog. Phys. 67, 209 (2004).
- Schröter et al. (2006) M. Schröter, S. Ulrich, J. Kreft, J. B. Swift, and H. L. Swinney, Phys. Rev. E 74, 011307 (2006).
- Majid and Walzel (2009) M. Majid and P. Walzel, Powder Technology 192, 311 (2009).
- Lagal (1992) R. Lagal, Gold Panning is Easy (Ram Publishing Company, Dallas, TX, 1992).
- Aumaitre et al. (2001) S. Aumaitre, C. A. Kruelle, and I. Rehberg, Phys. Rev. E 64, 041305 (2001).
- Schnautz et al. (2005) T. Schnautz, R. Brito, C. A. Kruelle, and I. Rehberg, Phy. Rev. Lett. 95, 028001 (2005).
- Chung et al. (2008) F. F. Chung, C.-Y. Ju, and S.-S. Liaw, Phys. Rev. E 77, 061304 (2008).
- Scherer et al. (1996) M. A. Scherer, V. Buchholtz, T. Pöschel, and I. Rehberg, Phys. Rev. E 54, R4560 (1996).
- Feltrup et al. (2009) A. Feltrup, K. Huang, C. A. Kruelle, and I. Rehberg, Europ. Phys. J.:Special Topics 179, 19 (2009).
- Kötter et al. (1999) K. Kötter, E. Goles, and M. Markus, Phys. Rev. E 60, 7182 (1999).
- Scherer et al. (2000) M. A. Scherer, K. Kötter, M. Markus, E. Goles, and I. Rehberg, Phys. Rev. E 61, 4069 (2000).
- May et al. (2013) C. May, M. Wild, I. Rehberg, and K. Huang, Phys. Rev. E 88, 062201 (2013).
- Sun et al. (2006) J. Sun, F. Battaglia, and S. Subramaniam, Phys. Rev. E 74, 061307 (2006).
- Lee (1994) J. Lee, J. Phys. A 27, L257 (1994).
- Herminghaus (2005) S. Herminghaus, Advances in Physics 54, 221 (2005).
- Allen and Tildesley (1987) M. P. Allen and D. J. Tildesley, Computer Simulation of Liquids (Oxford University Press, New York, 1987).
- Frenkel and Smit (2002) D. Frenkel and B. Smit, Understanding Molecular Simulation 2nd edition, Computational Science Series, Vol. 1 (Academic Press, 2002).
- Schaefer et al. (1996) J. Schaefer, S. Dippel, and D. Wolf, J. Phys. I France 6, 5 (1996).
- Steinhardt et al. (1983) P. Steinhardt, D. Nelson, and M. Ronchetti, Physical Review B 28, 784 (1983).