Probing the Active Massive Black Hole Candidate in the Center of NGC 404 with VLBI
Abstract
Recently Nyland et al. (2012) argued that the radio emission observed in the center of the dwarf galaxy NGC 404 (catalog ) originates in a low-luminosity active galactic nucleus (LLAGN) powered by a massive black hole (MBH, M⊙). High-resolution radio detections of MBHs are rare. Here we present sensitive, contemporaneous Chandra X-ray, and very long baseline interferometry (VLBI) radio observations with the European VLBI Network (EVN). The source is detected in the X-rays, and shows no long-term variability. If the hard X-ray source is powered by accretion, the apparent low accretion efficiency would be consistent with a black hole in the hard state. Hard state black holes are known to show radio emission compact on the milliarcsecond scales. However, the central region of NGC 404 is resolved out on 10 milliarcsecond (0.15–1.5 pc) scales. Our VLBI non-detection of a compact, partially self-absorbed radio core in NGC 404 implies that either the black hole mass is smaller than M⊙, or the source does not follow the fundamental plane of black hole activity relation. An alternative explanation is that the central black hole is not in the hard state. The radio emission observed on arcsecond (tens of pc) scales may originate in nuclear star formation or extended emission due to AGN activity, although the latter would not be typical considering the structural properties of low-ionization nuclear emission-line region galaxies (LINERs) with confirmed nuclear activity.
Subject headings:
black hole physics — galaxies: individual (NGC 404) — galaxies: active — radio continuum: galaxies — X-rays: galaxies1. Introduction
All massive galaxies are believed to host supermassive black holes (SMBH, M⊙) in their centers (Kormendy & Richstone, 1995), and there is ample observational evidence for a strong link between SMBH and host galaxy properties (Ferrarese & Merritt, 2000; Gebhardt et al., 2000). This in turn points to a single mechanism in SMBH and host galaxy formation. For example, major galaxy mergers may lead to the formation of close pairs of binary black holes (BH) in the early Universe, that would eventually coalesce because of dynamical friction and, eventually, gravitational radiation (Volonteri, Madau & Haardt, 2003; Volonteri & Rees, 2006). In hierarchical cosmological structure formation models, galaxy formation can be traced back to the stage of hundreds of smaller merging components, but how efficient BH growth was preceding this stage is currently not known (Volonteri, 2010). An outstanding question is how the seed BH in the mass range M⊙ were formed, and what the properties and demographics of those seeds are (Volonteri, 2010).
In the future, gravitational wave detectors may detect bursts of gravitational radiation from coalescing BH binaries. But at present, the only way to study SMBH formation observationally is looking at active galactic nuclei (AGN) in various regimes of the electromagnetic spectrum. It may seem straightforward to study objects at very high redshifts, when the Universe was much younger. The most extreme high-redshift quasars indeed show signs of violent BH–host galaxy growth at redshifts (e.g. Fan et al., 2006; Mortlock et al., 2011), but for the most luminous quasars we have evidence that these have already grown central SMBH with masses M⊙ (Barth et al., 2003; Willott et al., 2005). The more typical galaxies – that may harbor lower-mass central BHs and/or show no AGN activity – at those redhsifts are beyond the reach of current X-ray telescopes (Willott, 2011; Cowie et al., 2012). Luminous quasars at lower redshifts do not give a clue on SMBH-formation either, because during the growth process, the initial conditions of black hole seeds are quickly erased by an efficient accretion process and the merger history (Volonteri & Rees, 2006). It is currently impossible to search for massive black holes (MBH)111 Nyland et al. (2012) used the term intermediate-mass black hole (IMBH). This term is widely used in connection with non-nuclear massive black holes, as possible central engines for ultra-luminous X-ray sources (e.g. Colbert & Miller, 2006; Webb, Cseh & Kirsten, 2014). In this paper we find the term MBH more appropriate, that describes scaled-down versions ( M⊙) of supermassive black holes in the center of galaxies. in the M⊙ regime by resolving stellar kinematics in galaxies beyond the Local Group, but they can be detected if they show AGN activity (Greene & Ho, 2004). Detection of such MBHs would be very important to answer key astrophysical questions, such as the accretion efficiency in seed BHs. Since dwarf galaxies were much less affected by merger processes, MBHs in dwarfs may retain (to some extent) the original seed mass distribution as well (van Wassenhove et al., 2010).
The first two detections of MBHs with masses M⊙ were in the dwarf Seyfert 1 galaxy POX 52 (Filippenko & Ho, 2003; Barth et al., 2004) and in NGC 4395 (Peterson et al., 2005; Thornton et al., 2008). Since then there have been other candidates reported: the latest study by Reines, Greene & Geha (2013) included 151 dwarf galaxies where they found 10 well-established broad-line AGN candidates (with AGN or composite spectra) with virial BH masses222Assuming that the gas in the broad-line region is virialized, the luminosity and the width of the broad H emission line can be used to infer the average gas velocity, and a scaling relation can be applied to estimate the BH mass (e.g. Greene & Ho, 2005; Reines, Greene & Geha, 2013). in the range M⊙. It has to be noted that so far there are only two cases confirmed with reverberation mapping, the above mentioned NGC 4395 (Peterson et al., 2005), and SDSS J114008.71030711.4 (Rafter et al., 2011). The radio regime provides an additional source of information to confirm low-luminosity AGN (LLAGN) activity in these systems. The challenge is to distinguish between nuclear star formation, supernova remnant (SNR) complexes, and LLAGN interpretations using constraints on the brightness temperature, luminosity and spectral index probed by very long baseline interferometry (VLBI) (see e.g. Alexandroff et al., 2012). Alexandroff et al. (2012) targeted local analogs () of Lyman Break Galaxies showing starburst-like or composite spectra, with the goal to find LLAGN activity. They indeed detected two MBH candidates in the mass range M⊙ with the European VLBI Network (EVN). Their detection rate was however quite low (), showing that this is already rather difficult at redshifts . In the very local Universe ( Mpc), Nagar et al. (2002, 2005) observed the full sample of confirmed LLAGN such as low-ionization nuclear emission-line region (LINER) and Seyfert galaxies, and found that more than half of these showed flat-spectrum radio emission compact on 0.15 arcsecond scales. These were all detected and showed compact structure on milliarcsecond (mas) scales as well. Recently Panessa & Giroletti (2013) summarized the sub-parsec properties of a complete sample of 28 Seyfert galaxies within Mpc, based on data available from the literature and more recent observations for 14 sources (Giroletti & Panessa, 2009; Bontempi et al., 2012). Out of the 23 LLAGN that had radio emission detected on arcsecond scales, 17 were also detected with VLBI at least at one frequency, and most of these showed resolved structure in a single or several components, distributed on 10–100 mas scales. In many cases a significant fraction of the radio emission was resolved out. The closest member of this sample is the lowest-mass MBH ever detected with VLBI, NGC 4395 at a distance of Mpc and with a dynamical mass of M⊙ (Wrobel & Ho, 2006, and references therein).
Another candidate MBH is in the nearby dwarf galaxy NGC 404 (catalog ) at a distance of just 3.1 Mpc (1 angular size corresponds to 15 pc projected linear size), which has a complex nuclear environment (Nyland et al., 2012). This dwarf galaxy has been enriched by cold gas due to merger activity that occured about 1 Gyr ago (del Río, Brinks & Cepa, 2004; Bouchard et al., 2010). Most of the cold H i gas forms a doughnut shape with inner and outer radii 1–4 kpc (few hundred arcseconds), and this region forms stars at a rate of 2.5 M⊙/yr (Thilker et al., 2010). The presence of a nuclear star cluster within 0.7 arcseconds (inner 10 pc) with a mass of M⊙ indicates recent nuclear star formation (Bouchard et al., 2010; Ravindranath et al., 2001), which is likely accompanied by a central MBH evidenced by a central light excess within the cluster at radii pc, with a dynamical mass estimate of M⊙ (Seth et al. 2010). Binder et al. (2011) detected two distinct X-ray sources with Chandra, a nuclear point source dominated by a power-law, and off-nuclear diffuse emission best fit with a thermal model. Based on the observed photon index and the low Eddington ratio, they concluded that the properties of the hard X-ray source in NGC 404 are consistent with an LLAGN. Nyland et al. (2012) reported radio detection with the Karl G. Jansky Very Large Array (VLA) in the L-band (B-array) and C-band (A-array), with a 1.4-GHz flux density of 2.8 mJy, and steep spectrum (). The position of the radio source is coincident with the optical nucleus and the hard X-ray source. In this paper we present sensitive EVN and Chandra observations of NGC 404, that simultaneously probe the hard X-ray and the sub-parsec radio source properties.
2. Observations and Results
2.1. EVN and WSRT Observations
The EVN observations were carried out on 4 June 2013 from 02:15:00 (UTC) to 10:14:50 at 1.6 GHz (1594.49–1722.49 MHz), using a total data rate of 1024 Mbit/s/telescope, dual circular polarization, and 2-bit sampling (see Table 1 for telescope parameters). The Westerbork Synthesis Radio Telescope (WSRT) was part of the VLBI network as a phased array, but it also produced local interferometer data that were used to measure the source total flux density. NGC 404 was phase-referenced to the nearby calibrator J0112+3522 (cycle time 5 minutes), separated by only 0.7 degrees. 0234+285 served as an additional amplitude calibration check source for the VLBI data, while for amplitude calibration of the WSRT interferometer data we observed a 10-minute scan on 3C48.
The EVN data were analysed in the 31DEC13 version of the Astronomical Image Processing System (AIPS, e.g. van Moorsel, Kemball, & Greisen, 1996) using standard techniques333http://www.evlbi.org/user_guide/guide/userguide.html. We used the measured system temperatures and gaincurves for the a-priori amplitude calibration. In the absence of measured system temperature data, we used nominal system equivalent flux densities (SEFD) for Badary (330 Jy), Jodrell Bank Lovell Telescope (70 Jy), and Zelenchukskaya (300 Jy). The nominal SEFD of 370 Jy provided too low amplitudes for Svetloe. We applied a scaling factor for Svetloe baselines to provide consistent amplitudes with other baselines using the compact and bright sources 0234+285 and J0112+3522. We solved for inter-channel phase and delay differences first using 2 minutes of data on J0112+3522, then fringe-fitted the whole timerange to solve for the residual phases, delays and rates on the calibrators. The solutions found for J0112+3522 were transferred to the target source as well, using two-point interpolation with rate correction, to avoid errors due to phase-wrapping. After the initial amplitude and phase calibration, we solved for the instrumental bandpasses in each channels using J0112+3522. We edited the data for radio frequency interference, and applied the calibration tables to all sources. There were no major problems seen in the data, therefore we do not expect that the correlation losses in our experiment were larger than in a typical EVN observation at these frequencies. The data quality was generally very good. The phase-reference source was bright and very compact, with a separation from thetarget well within a degree. The imaging was carried out in Difmap (Shepherd et al., 1994), version 2.4e. We have calibrated the WSRT local interferometer data in AIPS, also following standard procedures444https://www.astron.nl/radio-observatory/astronomers/analysis-wsrt-data/analysis-wsrt-data. The primary amplitude calibration was done using 3C84. We then solved for the residual amplitude and phase solutions on the phase-reference source J0112+3522 and ran GETJY to find the total flux density of J0112+3522 as well as to calibrate its gain solutions. These solutions were then interpolated to the target source NGC 404. Just like in case of the EVN data, imaging was carried out in Difmap.
| Radio telescope | Diameter (m) | SEFDa (Jy) |
|---|---|---|
| Effelsberg (Germany) | 100 | 19 |
| Badary (Russia) | 32 | 330 |
| Jodrell Bank (United Kingdom) | 76 | 65 |
| Medicina (Italy) | 32 | 700 |
| Nanshan (P.R. China) | 25 | 300 |
| Noto (Italy) | 32 | 784 |
| Onsala (Sweden) | 25 | 320 |
| Sheshan (P.R. China) | 25 | 670 |
| Svetloe (Russia) | 32 | 360 |
| Toruń (Poland) | 32 | 300 |
| Westerbork (Netherlands) | 40 | |
| Zelenchukskaya (Russia) | 32 | 300 |
-
a
System Equivalent Flux Density
-
b
The telescope was used in phased array mode for the VLBI observations, but also produced local interferometer data. 13 telescopes of the 14-element array were used in the observations.
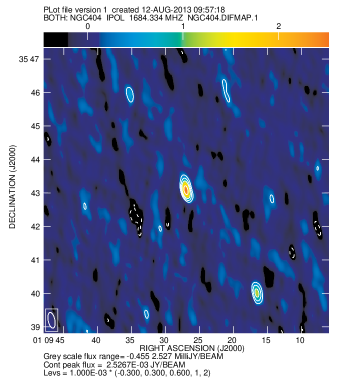
The naturally weighted WSRT image shows NGC 404 as an unresolved source within the beam of 28.411.9 arcseconds with a position angle of (see Fig. 1). We fitted a point source model to the interferometer visibility data (e.g. Pearson, 1995) that resulted in a total flux density of 2.50.1 mJy (the error bar represents the rms noise in the map), in agreement with previous VLA results at this frequency (Nyland et al., 2012). The high-resolution EVN data with a restoring beam of 14.05.6 mas, does not show a source, with an rms noise level of 7 Jy/beam. Within the 100 mas error circle of the source at position and (Nyland et al., 2012), the maximum peak brightness on the dirty map is 22 Jy/beam, and within 300 mas it is 29 Jy/beam. Considering a 10–20% correlation loss that is typical for EVN phase-referencing experiments at GHz frequencies (Frey et al., 2008), we can rule out a compact radio source with a flux density of 35 Jy (5 significance). Note that applying a Gaussian -taper to decrease the resolution of the EVN data did not reveal any emission on larger ( mas) scales either. The radio emission is thus distributed on 10 mas to a few hundred mas scales. This is somewhat surprising since the resolution of the 5–7 GHz VLA observations reported by Nyland et al. (2012) was sub-arcsecond, and the source was at most moderately resolved. Nevertheless, our new data place a strong constraint on a compact component in NGC 404 on the 10-mas scales. We derive an upper limit to the brightness temperature, defined as (Kellermann & Owen, 1988):
| (1) |
where is the measured flux density in Jy, is the redshift (in this case zero), and are the major and minor axes of the beam in mas (or, for detected sources, the major and minor axes of the fitted Gaussian components), and is the observing frequency in GHz. The 1.6 GHz brightness temperature upper limit is K with the full resolution data, and K using the tapered data (resolution 30 mas, 5 upper limit 40 Jy/beam). We note that Very Long Baseline Array (VLBA) observations of NGC 404 have been independently carried out at a similar resolution and somewhat less sensitivity compared to our data, with the same result, i.e. the source was not detected (Kristina Nyland, priv. comm.).
2.2. Chandra Observations
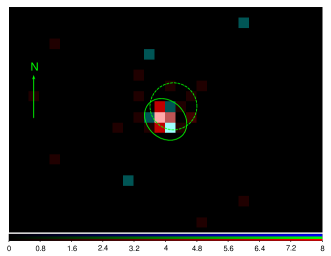
We observed NGC 404 with the Chandra X-ray Observatory on 4 June 2013 from 02:24:14 (UTC) to 06:51:19, overlapping the time of the radio observations, and obtained a useful exposure of 13.6 ks, before deadtime correction. We also re-analyzed an archival observation obtained on 21 October 2010 04:03:55 with an exposure of 98.3 ks, before deadtime correction555Binder et al. (2011) quoted the exposure after deadtime correction., that was previously described by Binder et al. (2011). Both observations used the Advanced CCD Imaging Spectrometer (ACIS) with events recorded in VFAINT mode. We analyzed the standard level 2 data products using CIAO version 4.5 and CALDB 4.5.7 which retains the Chandra standard set of event grades equivalent to ASCA grades 0, 2, 3, 4, and 6 (Fruscione et al., 2006). Neither observation was seriously affected by flaring.
NGC 404 was placed at the aimpoint of the ACIS-S3 chip in both observations. We extracted images of counts on the S3 chip in the 0.3–8 keV and 2–10 keV bands and searched for sources using CIAO’s wavdetect tool. The nominal Chandra astrometric accuracy is at 90% confidence, but comparison of the positions of the four sources detected in both observations shows an offset of between the two observations. This is almost a factor of 2 larger than the typical uncertainty and may indicate an issue with the aspect reconstruction in one or both observations. However, an inspection of the aspect camera data, kindly performed by Jean Connelly of the Chandra Aspect Operations team, shows no obvious reason to prefer the aspect solution of one observation versus the other. Thus, there is no reason to prefer the absolute astrometry of either the 2013 or 2010 Chandra observation.
To attempt to improve the astrometry, we searched for optical counterparts to the X-ray sources and found an X-ray source in the 2013 observation at the location of Mirach ( And), an M0III giant star. X-ray emission has been observed from several M-type giant stars, including HR 5512 that shows no indications of binarity (Hünsch et al., 2004), so we identify the X-ray source with Mirach. This position was off the CCDs in the 2010 observation due to the different roll angle (both observations were pointed at NGC 404). Mirach has a large proper motion, mas/yr, and we calculate its position at the time of the 2013 observation to be RA = 01h09m44.08s, DEC = +35°37’12.5”. This matches the X-ray source position within .
We detect a hard X-ray source (in the 2–10 keV band) near NGC 404 in both the 2010 and 2013 observations. After aligning the observations using the 4 other X-ray sources detected in both observation, the hard source position agrees within between the two observations. This is consistent given the alignment accuracy and uncertainties on the individual source positions. In the 2013 observation (Fig. 2), NGC 404 is detected at a significance of and with net counts666The reported significance of the detections come directly from the Chandra tool wavdetect. See http://cxc.harvard.edu/csc/columns/significance.html for an explanation. in the 0.3–8 keV band and at significance and net counts in the 2–10 keV band. Without any aspect correction, the hard source position is RA = 01h09m27.03s, DEC = +35°43’04.3” (J2000). Aligning the astrometry of the 2013 observation to that of the 2010 observation moves the hard source by to RA = 01h09m27.02s, DEC = +35°43’05.2” (J2000) which is consistent with the position reported by Binder et al. (2011). Due to the issues with the aspect solution, we conservatively assign an uncertainty of (90% confidence) to the hard source position.
The hard X-ray source had a count rate of c/s in the 2–10 keV band in the 2013 observation and a rate of c/s in the 2010 observation. Thus, there is no evidence of a change in the average hard X-ray flux between 2010 and 2013. Assuming a power-law spectrum with a photon index of 1.9, we estimate a flux of 1.2 erg cm-2 s-1 in the 2–10 keV band.
2.3. Comparison with Previous Results
In this paper we present new observational constraints with different instruments that have a wide range of angular resolutions, and therefore we probe different spatial scales in NGC 404. At the distance of NGC 404, 1” corresponds to 15 pc. The WSRT beam probes regions greater than 150 pc, Chandra has a spatial resolution of about 8 pc, while the EVN beam roughly corresponds to 0.15 pc. It is also instructive to look at the largest angular scales the EVN is sensitive to, to understand what spatial scales we cannot probe in the radio. The shortest baseline in units of observing wavelength was 1 million (1 M), and the second shortest was about 2 M. These would correspond to angular scales of 200 mas and 100 mas, respectively. Since imaging source structure requires more than a single baseline, the largest structure that can be detected with our VLBI array in the image plane is about 100 mas (corresponding to 1.5 pc). This means that we probe the radio emission between 0.15–1.5 pc linear scales with the EVN, but we do not have information on extended radio structures between 1.5 pc and 150 pc spatial scales.
The radio power of the arcsecond-scale radio source measured by the WSRT is erg s-1 Hz-1 ( W Hz-1) at 1.65 GHz. The total WSRT radio flux density of mJy at 1.65 GHz is fully consistent with the VLA 1.5-GHz flux density of given the steep spectral index (; Nyland et al., 2012). The observed 2-10 keV X-ray flux corresponds to an unabsorbed luminosity of erg s-1 at a distance of 3.1 Mpc. This is consistent with the luminosity estimated by Binder et al. (2011) for the power-law component of the emission from the hard, nuclear point source using spectral fitting. It appears that the emission from within the central pc did not vary significantly since the previous measurements in the radio and in the X-ray bands.
The radio emission is resolved out with VLBI, indicating a source size exceeding 100 mas (1.5 pc). The 2-10 keV X-ray luminosities are usually compared to the radio luminosities at GHz; by assuming a flat spectrum for a compact source (see next section), our strong upper limit of 35 Jy corresponds to a 5-GHz radio luminosity upper limit of erg s-1 (or W) for the central 0.15–1.5 pc region.
3. Discussion
3.1. The Nature of the Nuclear Radio and X-ray Source in NGC 404
Nyland et al. (2012) considered various scenarios to explain the nuclear radio and X-ray emission: weakly accreting MBH, a stellar-mass X-ray binary system (XRB), a young SNR, and nuclear star formation. They have excluded the XRB and the young SNR scenarios based on the observed radio and X-ray properties, and, in the latter case, also supported by a statistical argument. They could not exclude the nuclear star formation scenario, but argued that the radio emission is most likely related to an active MBH. Our results of no long-term variability in the radio and in the X-rays, as well as the VLBI non-detection supports fully Nyland et al. (2012) in that the radio emission is not related to an XRB or a young SNR, and may be consistent with nuclear star formation. Below we will consider what our measurements imply for the active MBH scenario.
In order to do that, we further calculate the ratio of the radio luminosity upper limit from the VLBI data and the X-ray luminosity. Using the definition for the radio-loudness parameter of (5 GHz) (Terashima & Wilson, 2003), we find that log for a compact source, in contrast to the earlier reported log (Nyland et al., 2012). The caveat here is that Chandra and the EVN probe very different spatial scales in NGC 404. However, for hard-state MBHs in LINERs that show compact emission on 150 mas scales with the VLA, most of the radio emission comes from a compact region detectable by VLBI as well; in some cases these are resolved as pc-scale jets, but there are compact cores observed as well that are interpreted as unresolved, partially synchrotron self-absorbed bases of jets777One cannot exclude that in some cases the radio emission in unresolved radio cores is from the accretion flow (Narayan et al., 2000). (cf. Nagar et al., 2002, 2005). Naturally, one cannot characterize the central black hole using measurements that are dominated by extended emission from e.g. star formation. Our value is only correct under the assumption that all the X-rays come from a very compact region as well. Currently the only way to assess this is looking at short-timescale variability in the X-ray emission. Since Binder et al. (2011) found evidence for such variability, we may conclude that at least a reasonable fraction of the X-ray emission is from a very compact source. The Eddington ratio, defined as ( erg s-1) can be inferred from the measured X-ray luminosity, assuming that it is 16% of the bolometric luminosity (Ho, 2008). In our case we obtain under the assumption that X-rays are fully powered by accretion and for an MBH mass M⊙ (Seth et al., 2010; Gultekin et al., 2009). This value is comparable to the Eddington ratio derived by Binder et al. (2011) for the LLAGN case.
3.2. The Case of an Accretion-Powered MBH
A survey of the Palomar Spectroscopic Sample (Ho et al., 1997) at (mostly) 15 GHz with the VLA, and at 5 GHz with the VLBA showed that a very significant fraction of LLAGN have compact, flat-spectrum cores and (sub-)pc scale jets, indicating that at least 50% of low-luminosity Seyfert galaxies and LINERs in the sample are accretion powered (Nagar et al., 2002, 2005). NGC 404 was part of this sample but no radio emission was detected with the VLA at the 10 levels of 0.9, 1.3 and 10 mJy, at 8.4, 15, and 43 GHz, respectively (Nagar et al., 2000). Nyland et al. (2012) observed at lower frequencies (1.5, 5 and 7.5 GHz) and achieved significantly lower noise levels. They detected slightly to moderately resolved radio structure from arcsecond to sub-arcsecond scales, with a spectral index of that is still broadly consistent with the properties of weakly-accreting LLAGN. The observed steep spectrum in AGNs is mostly indicative of optically thin synchrotron emission in extended structures, but there may be a faint, flat-spectrum compact source at lower flux density levels. In addition, the radio source might be related to a single steep spectrum core, as observed in a number of LLAGN (Sadler et al., 1995; Kharb et al., 2010; Orienti & Prieto, 2010, to name a few). Because of the high angular resolution the VLBI technique provides, we can probe if there is compact core emission as well as a (sub)-pc jet in NGC 404.
With our sensitive EVN data, we give a strong upper limit of 35 Jy for compact emission. This is more than an order of magnitude deeper than the previous low-resolution measurement and upper limits indicated. Our non-detection does not automatically mean that an accretion-powered MBH can be completely ruled out in NGC 404, however, it is in contrast with the brighter population of LINERs that are known to have flat-spectrum cores and/or jets, and the suggestion by Nagar et al. (2005) that most LINERs might actually be powered by AGN activity. The estimated radio-loudness parameter log is still consistent with a radio-loud object (log , Terashima & Wilson, 2003), but note that we actually derive an upper limit. The Eddington ratio of is somewhat lower, but close to the low end of what is implied in jet models of the radio emission in other LINERs (, Nagar et al., 2005), and significantly higher than the observed quiescent-state Eddington ratio of for Sagittarius A*, that is well described by an advection-dominated accretion model (see Feng & Narayan, 2014, for a review). Note that Nemmen, Storchi-Bergmann & Eracleous (2013) recently studied a sample of 12 LINERs and found Eddington ratios in the range .
To compare our radio upper limit with weakly accreting black holes, we use the fundamental plane of black hole activity (FP, Merloni, Heinz & di Matteo, 2003; Falcke et al., 2004). That is in principle a relation between the accretion efficiency and radio luminosity for a given mass. The latest and most accurate fit to the data including sub-Eddington black holes was done by Plotkin et al. (2012). Miller-Jones et al. (2012) performed a new regression of the same data for determining black hole masses that takes the following form:
| (2) |
where is the 2–10 keV X-ray luminosity, is the 5-GHz radio luminosity (both in erg s-1), and is the black hole mass in Solar masses. Using our measured X-ray luminosity, the 5 upper limit on the radio luminosity from a compact source, and assuming that NGC 404 is in a similar hard state like the sources that follow the FP-relation, we obtain a black hole mass upper limit of M⊙. Here the error corresponds to the empirically determined uncertainty of 0.44 dex (Miller-Jones et al., 2012).
Here we stress that Eq. 2 is particularly interesting when the radio measurement represents emission from a compact source, i.e. it is obtained from a very high resolution instrument (arcsecond), or the 5 GHz flux density of a flat spectrum compact core is estimated from higher frequency measurements. The physics of the fundamental plane is well understood for massive and stellar-mass black holes in the hard state, in which case they are accreting significantly below their Eddington ratios. In this accretion state, the radio emission is dominated by partially synchrotron self-absorbed compact jets that have flat spectra and and show distinct structural properties on mas scales with VLBI (see Paragi et al., 2013, and references therein). Sources that have steep spectra and/or show significant large-scale emission are less understood and are likely influenced more strongly by their environment. This makes black hole mass estimates from measured X-ray and radio luminosities less reliable. There are two ways to identify compact (on mas scales), optically thick radio emission from partially synchrotron self-absorbed cores: by measuring a flat radio spectrum, or by directly constraining the size with VLBI measurements.
Is it still possible that the radio emission resolved out by VLBI is related to LLAGN activity? For example, in the case of the blue dwarf galaxy Henize 2-10, Reines et al. (2011) argued that the non-detection of the central radio source on mas scales does not necessarily rule out the presence of an accreting black hole, the radio emission may come from extended jets and/or lobes. In a following paper however Reines & Deller (2012) showed that in fact there is a compact radio source component as well, detected with a resolution of about 100 mas. This is similarly true for Seyfert galaxies with steep radio spectra, where most of the emission often comes from extended jets and lobes that are not compact on mas scales (Orienti & Prieto, 2010; Panessa & Giroletti, 2013), but very compact emission is also present in several cases, especially in narrow-line Seyfert 1 galaxies (Doi et al., 2013). While both Seyferts and LINERs often show very compact radio emission, the former on average have steeper radio spectra, and higher median bolometric Eddington ratios, although the contrast in the former case is large within the two subclasses: for Seyfert 1s, for Seyfert 2s, and it is for LINER 1s, and for LINER 2s (Ho, 2008, and references therein). Nagar et al. (2005) proposed that LINERs may be related to hard state black holes (low Eddington rate, capable of producing jets), while Seyferts show soft state black hole activity (higher Eddington rate, no observed compact jets, only very resolved large-scale jet emission seen); the observed Eddington ratios, spectral indices and morphologies do not seem to fully justify such a simplistic division between the classes. In the case of NGC 404, our very high resolution measurements do not show evidence that this LINER galaxy harbours a hard state black hole with compact jet emission. Under the assumption that the radio emission is related to hard state black hole activity and the source follows the FP-relation, the BH mass has to smaller than M⊙. But we note that besides the well-known caveats of applying the FP-relation to estimate black hole masses, recent work has shown that even hard state black holes do not always obey the FP-relation (see Heinz & Merloni, 2013, and references therein). Finally, it is possible that the active black hole in NGC 404 is not in the hard state and the extended radio emission is due to jets/lobes. This can be probed by intermediate-resolution instruments.
4. Conclusions
We have shown that the radio emission in the central region of NGC 404 is resolved out on mas scales, using very sensitive EVN observations. The contemporaneous Chandra and EVN measurements allowed us to give a strong constraint on the mass of the central MBH under the assumption that the central black holes is in the hard state and follows the fundamental plane relation, without the additional uncertainty factor of possible variability between the epoch of the radio and the X-ray observations. We have also shown that there is no long-term variability in the radio and X-ray bands.
While the detection of a compact radio source would have supported the claimed accretion-powered MBH as the source of the radio emission, our VLBI non-detection is still consistent with a weakly accreting black hole. The extended radio emission may be due to nuclear star formation, or extended jets or lobes due to LLAGN activity. A jet-lobe structure can be confirmed by radio observations that probe angular scales of mas, like e-MERLIN. In the future, the VLBI technique will remain an important tool to probe LLAGN activity, but as our current example shows, additional short spacings of a few tens to a few 100 km are crucial as well to be able to disentangle the various sources of the radio emission. In the near future, the joint EVN-e-MERLIN array will be the best instrument to do so. We note that with the Square Kilometer Array (especially SKA1-mid) it will be possible to give better constraints on nuclear MBH masses because of the great increase in sensitivity, but only when the array configuration and high-frequency coverage ( GHz) is enough to provide significantly sub-arcsecond resolution.
References
- Alexandroff et al. (2012) Alexandroff, R., Overzier, R. A., Paragi, Z., et al. 2012, MNRAS, 423, 1325
- Barth et al. (2003) Barth, A. J., Martini, P., Nelson, C. H. & Ho, L. C. 2003, ApJL, 594, L95
- Barth et al. (2004) Barth, A. J., Ho, L. C., Rutledge, R. E. & Sargent, W. L. W. 2004, ApJ, 607, 90
- Binder et al. (2011) Binder, B., Williams, B.F., Eracleous, M. et al. 2011, ApJ, 737, 77
- Bontempi et al. (2012) Bontempi, P., Giroletti, F., Panessa, F., Orienti, M. & Doi, A. 2012, MNRAS, 426, 588
- Bouchard et al. (2010) Bouchard, A., Prugniel, P., Koleva, M., & Sharina, M. 2010, A&A, 513, 54
- Colbert & Miller (2006) Colbert, E. J. M., & Miller, M. C. 2006, in M. Novello, S. P. Bergliaffa, R. Ruffini (eds.) Proceedings of the MG10 Meeting, p. 530. Singapore: World Scientific Publishing
- Cowie et al. (2012) Cowie, L. L., Barger, A. J., & Hasinger, G. 2012, ApJ, 748, 50
- del Río, Brinks & Cepa (2004) del Río, M. S., Brinks, E., & Cepa, J. 2004, AJ, 128, 89
- Doi et al. (2013) Doi, A., Asada, K., Fujisawa, K. et al. 2013, ApJ, 765, 69
- Falcke et al. (2004) Falcke, H., Körding, E., & Markoff, S. 2004, A&A, 414, 895
- Fan et al. (2006) Fan, X., Strauss, M. A., Becker, R. H. et al. 2006, AJ, 132, 117
- Feng & Narayan (2014) Feng, Y., & Narayan, R. 2014, arXiv:1401.0586
- Ferrarese & Merritt (2000) Ferrarese, L., & Merritt, D. 2000, ApJ, 539, L9
- Filippenko & Ho (2003) Filippenko, A. V., & Ho, L. C. 2003, ApJ, 588, L13
- Frey et al. (2008) Frey, S., Gurvits, L. I., Paragi, Z., et al. 2008, A&A, 477, 781
- Fruscione et al. (2006) Fruscione, A., McDowell, J. C., Allen, G. E., et al. 2006, Proc. SPIE, 6270
- Gebhardt et al. (2000) Gebhardt, K., Bender, R., Bower, G., et al. 2000, ApJ, 539, L13
- Giroletti & Panessa (2009) Giroletti, M., & Panessa, F. 2009, ApJ, 706, L260
- Greene & Ho (2004) Greene, J. E., & Ho, L. C. 2004, ApJ, 610, 722
- Greene & Ho (2005) Greene, J. E., & Ho, L. C. 2005, ApJ, 630, 122
- Gultekin et al. (2009) Gültekin, K., Cackett, E. M., Miller, J. M., et al. 2009, ApJ, 706, 404
- Heinz & Merloni (2013) Heinz, S., & Merloni, A. 2013, Proc. IAU Symp. S290, Volume 8, pp. 29-36
- Ho (2008) Ho, L. C. 2008, ARA&A, 46, 475
- Ho et al. (1997) Ho, L. C., Filippenko, A. V., & Sargent, W. L. W. 1997, ApJS, 112, 315
- Hünsch et al. (2004) Hünsch, M., Konstantinova-Antova, R., Schmitt, J. H. M. M., et al. 2004, IAU Symp. 219, 223
- Kellermann & Owen (1988) Kellermann, K. I., & Owen, F. N. 1988, in G. L. Verschuur, K. I. Kellermann (eds.) Galactic and Extragalactic Radio Astronomy, p. 653, Berlin: Springer
- Kharb et al. (2010) Kharb, P., Hota, A., Croston, J. H., et al. 2010, ApJ, 723, 580
- Kormendy & Richstone (1995) Kormendy, R., & Richstone, D. 1995, ARA&A, 33, 581
- Merloni, Heinz & di Matteo (2003) Merloni, A., Heinz, S., di Matteo, T. 2003, MNRAS, 345, 1057
- Miller-Jones et al. (2012) Miller-Jones, J. C. A., Wrobel, J. M., Sivakoff, G. R., et al. 2012, ApJ, 755, L1
- Mortlock et al. (2011) Mortlock, D. J., Warren, S. J., Venemans, B. P. et al. 2011, Nat, 474, 616
- Nagar et al. (2000) Nagar, N. M., Falcke, H., Wilson, A. S., & Ho, L. C. 2000, ApJ, 542, 186
- Nagar et al. (2002) Nagar, N. M., Falcke, H., Wilson, A. S., & Ulvestad, J. S. 2002, A&A, 392, 53
- Nagar et al. (2005) Nagar, N. M., Falcke, H., & Wilson, A. S. 2005, A&A, 435, 521
- Narayan et al. (2000) Narayan, R., Igumenshchev, I. V., & Abramowicz, M. A. 2000, ApJ, 539, 798
- Nemmen, Storchi-Bergmann & Eracleous (2013) Nemmen, R. S., Storchi-Bergmann, T., & Eracleous, M. 2013, arXiv1301.7719
- Nyland et al. (2012) Nyland, K., Marvil, J., Wrobel, J. M., Young, L. M., & Zauderer, B. A. 2012, ApJ, 753, 103
- Orienti & Prieto (2010) Orienti, M., & Prieto, M. A. 2010, MNRAS, 401, 2599
- Panessa & Giroletti (2013) Panessa, F., & Giroletti, M. 2013, MNRAS, 432, 1138
- Paragi et al. (2013) Paragi, Z., van der Horst, A., Belloni, T. et al. 2013, MNRAS, 432, 1319
- Pearson (1995) Pearson, T. J. 1995, in J. A. Zensus, P. J. Diamond, & P. J. Napier (eds.) Very Long Baseline Interferometry and the VLBA, p. 268, San Francisco: Astronomical Society of the Pacific (ASP)
- Peterson et al. (2005) Peterson, B. M., Bentz, M. C., Desroches, L.-B. et al. 2005, ApJ, 632, 799
- Plotkin et al. (2012) Plotkin, R. M., Markoff, S., Kelly, B. C., Körding, E., & Anderson, S. F. 2012, MNRAS, 419, 267
- Rafter et al. (2011) Rafter, S. E., Kaspi, S., Behar, E., Kollatschny, W. & Zetzl, M. 2011, ApJ, 741, 66
- Ravindranath et al. (2001) Ravindranath, S., Ho, L. C., Peng, C. Y., Filippenko, A. V., & Sargent, W. L. W. 2001, AJ, 122, 653
- Reines et al. (2011) Reines, A. E., Sivakoff, G. R., Johnson, K. E., Brogan, C. L. 2011, Nat, 470, 66
- Reines & Deller (2012) Reines, A. E., & Deller, A. T. 2012, ApJ, 750, L24
- Reines, Greene & Geha (2013) Reines, A. E., Greene, J. E. & Geha, M. 2013, ApJ, 775, 116
- Sadler et al. (1995) Sadler, E. M., Slee, O. B., Reynolds, J. E., & Roy, A. L. 1995, MNRAS, 276, 1373
- Shepherd et al. (1994) Shepherd, M. C., Pearson, T. J., & Taylor, G. B. 1994, BAAS, 26, 987
- Seth et al. (2010) Seth, A. C., Cappellari, M., & Neumayer, N. 2010, ApJ, 714, 713
- Terashima & Wilson (2003) Terashima, Y., & Wilson, A. S. 2003, ApJ, 583, 145
- Thilker et al. (2010) Thilker, D. A., Bianchi, L., Schiminovich, D., et al. 2010, ApJ, 714, 171
- Thornton et al. (2008) Thornton, C. E., Barth, A. J., Ho, L. C., Rutledge, R. E., & Greene, J. E. 2008, ApJ, 686, 892
- Treister et al. (2011) Treister, E., Schawinski, K., Volonteri, M., Natarajan, P., & Gawiser, E. 2011, Nat, 474, 356
- van Moorsel, Kemball, & Greisen (1996) van Moorsel, G., Kemball, A., & Greisen, E. 1996, in ASP Conf. Ser. 101, Astronomical Data Analysis Software and Systems V, ed. G. H. Jacoby & J. Barnes (San Francisco: ASP), 37
- van Wassenhove et al. (2010) van Wassenhove, S., Volonteri, M., Walker, M. G., & Gair, J. R. 2010, MNRAS, 408, 1139
- Volonteri (2010) Volonteri, M. 2010, A&AR, 18, 279
- Volonteri, Madau & Haardt (2003) Volonteri, M., Madau, P., & Haardt, F. 2003, ApJ, 593, 661
- Volonteri & Rees (2006) Volonteri, M., & Rees, M. J. 2006, ApJ, 650, 669
- Webb, Cseh & Kirsten (2014) Webb, N., Cseh, D. & Kirsten, F. 2014, arXiv:1401.1728
- Willott (2011) Willott, C. J. 2011, ApJ, 742, 8
- Willott et al. (2005) Willott, C. J., Percival, W. J., McLure, R. J., et al. 2005, ApJ, 626, 657
- Wrobel & Ho (2006) Wrobel, J. M., & Ho, L. C. 2006, ApJ, 646, 95