Tracing the outer halo in a giant elliptical to 25 Reff
Abstract
We have used the ACS and WFC3 cameras on board HST to resolve stars in the
halo of the nearest giant elliptical (gE) galaxy NGC 5128 out to a projected
distance of 140 kpc (25 effective radii, Reff) along the major axis
and 90 kpc (16 Reff) along the minor
axis. This dataset provides an unprecedented radial coverage of the stellar
halo properties in any gE galaxy.
Color-magnitude diagrams clearly reveal the presence of the red giant
branch stars belonging to the halo of NGC 5128, even in our most distant
fields. The star counts demonstrate increasing flattening of the outer halo, which is
elongated along the major axis of the galaxy. The V-I colors of the red giants enable us to
measure the metallicity distribution in each field and so map the
gradient out to Reff from the galaxy center along the major axis.
A median metallicity is obtained even for the outermost fields along both axes.
We observe a smooth transition from a metal-rich ([M/H]) inner galaxy to
lower metallicity in the outer halo, with the metallicity gradient slope along the major axis of
[M/H]/ dex kpc-1.
In the outer halo, beyond Reff, the number density profile
follows a power law, but also significant field-to-field metallicity
and star count variations are detected.
The metal-rich component dominates in all observed fields, and the median metallicity is
[M/H] dex in all fields.
Subject headings:
galaxies: elliptical and lenticular, cD — galaxies: halos — galaxies: individual (NGC 5128) — galaxies: stellar content1. Introduction
Because dynamical timescales in the outer halos of large galaxies are long, the properties of stars in the remote halo regions, such as their metallicity and surface density distributions and gradients, provide important constraints for galaxy formation and hierarchical assembly models (Johnston et al., 2008; Font et al., 2011; Naab & Ostriker, 2009; Cooper et al., 2013). However, the extremely faint surface brightness of the halo makes the raw observations challenging. Integrated-light studies need to probe surface brightness levels of mag arcsec-2, predicted in simulations for outer halos (e.g. Johnston et al., 2008) where most of the sub-structure tracing the hierarchical assembly history of the galaxies is expected. Such faint limits are out of reach for integrated light studies with most modern large telescopes (Jablonka et al., 2010; Abraham & van Dokkum, 2014), though attempts have been made to derive mean properties by stacking many similar galaxies (Zibetti et al., 2004; Tal & van Dokkum, 2011).
A powerful alternative to integrated light studies is resolved photometry of individual stars, a technique that can be applied for galaxies at distances Mpc. Direct stellar photometry is capable of revealing not just mean halo properties but the distribution functions of metallicity and age.
Only a few giant elliptical (gE) galaxies are close enough to allow detection and study of their outer halo regions. Mihos et al. (2013) traced the halo color gradient of the Virgo cluster gE M49 out to kpc (7 Reff), where mag arcsec-2. The bluer color of the outer halo and the steepening of the color gradient in the M49 halo, if interpreted as purely due to metallicity, argues for the presence of a dominant metal-poor population with [Fe/H]. The detection of this “classical” metal-poor halo is in contrast with the findings in the Centaurus A (Cen A) group central giant NGC 5128, where both a high mean metallicity and no strong metallicity gradient have been seen out to a similar scaled distance of 6.5 Reff (Rejkuba et al., 2005). In the Leo group gE NGC 3379 the transition to a classically metal-poor outer halo was found at Reff (Harris et al., 2007). These few galaxies and very limited spatial coverage (with only 1 or few pointings per galaxy) preclude drawing general conclusions and demand a wider range of observations.
NGC 5128 (often referred to as Cen A, after its radio source name) is a particularly important target. A mere 3.8 Mpc distant (Harris et al., 2010), it is by far the closest and easiest to observe gE galaxy. Its old-halo red-giant stars can be studied readily with Hubble Space Telescope (HST) imaging (e.g. Soria et al., 1996; Marleau et al., 2000; Harris et al., 1999) or under excellent seeing conditions from the ground (Rejkuba et al., 2001, 2003; Crnojević et al., 2013). HST-based photometry, reaching at least 1-1.5 mag below the tip of the RGB, has allowed the metallicity distribution function (MDF) to be investigated in detail in four fields at projected galactocentric distances from 8 to 38 kpc (Harris et al., 1999; Harris & Harris, 2000, 2002; Rejkuba et al., 2005). The outer-halo stars were traced out to kpc with VIMOS at the ESO Very Large Telescope (Crnojević et al., 2013) and found to have high median metallicity even at 111Crnojević et al. (2013) used R arcsec=6.1 kpc, while we adopt 305 arcsec = 5.6 kpc from Dufour et al. (1979).. This VIMOS study also provides a first hint that the outer halo becomes more elongated and has a surface brightness profile shallower than the r1/4 law. However, high contamination by both foreground stars and unresolved background galaxies prevented stronger conclusions. Deeper and higher-resolution HST observations can go much further.
In this work we extend our previous HST studies of the NGC 5128 halo into the extreme outer parts of the halo up to 140 kpc or 25 Reff, regions never observed before. With these new data we address the questions: (i) how far does the halo extend? (ii) is there a genuine metal-poor halo in NGC 5128, similar to that found in the outer regions of the Milky Way, M31, NGC 3379 and M49 (Carollo et al., 2007; Chapman et al., 2006; Harris et al., 2007; Mihos et al., 2013)? (iii) and if so, at which radius does the metal-poor population start to dominate?
2. Observations and data reduction
Five new fields were observed with the HST during Cycle 20 (Cy20; GO programme 12964) with the Wide Field Camera 3 (WFC3) in UVIS mode as primary and Advanced Camera for Surveys (ACS) in Wide Field Camera mode as the secondary (parallel) instrument. For both instruments imaging was done with the F606W and F814W, the same filters as used in all our previous studies. Each field received three dithered exposures adding to one orbit per filter. The total exposure time for WFC3 was 2376 sec (F814W) and 2496 sec (F606W), while the ACS images got 2137 and 2270 sec in the same two bands.
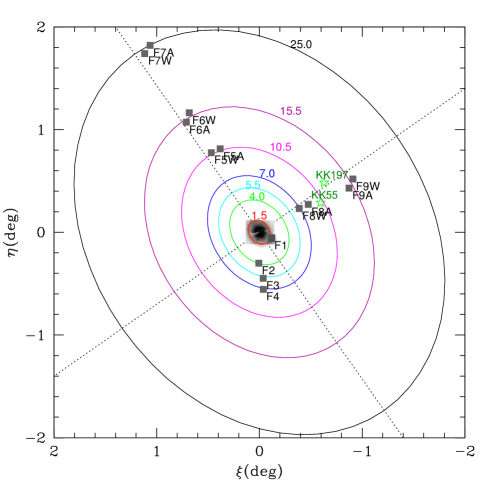
Figure 1 shows the locations of our fields relative to the center of NGC 5128 projected on the plane of the sky. Fields F1-F4 are described in Harris et al. (1999), Harris & Harris (2000, 2002), and Rejkuba et al. (2005), while our new Cy20 fields F5-F9 are marked with suffix A (ACS) or W (WFC3). Following Dufour et al. (1979), the contour lines shown are for an axis ratio 0.77, with the major axis along a position angle of 35∘. The effective radius is corresponding to 5.6 kpc at the 3.8 Mpc distance (Harris et al., 2010). Our new fields F5, F6, and F7 are located along the major axis , 90 and 140 kpc North-East from the center of NGC 5128, respectively. The fields F8 and F9 along the North-West minor axis lie on the same ellipses as F4 and F6, which are located respectively at ( Reff) and 90 kpc ( R eff) close to and along the major axis.
The pipeline processed images were downloaded from the HST archive, and pixel-based charge transfer corrections (Anderson & Bedin, 2010) were applied with the Fortran code222http://www.stsci.edu/hst/wfc3/tools/cte_tools from J. Anderson (Ubeda & Anderson, 2012). PSF-fitting photometry was completed with the DAOPHOT suite of programmes (Stetson, 1987). Our images are completely uncrowded, so in principle aperture photometry would be accurate, but PSF/ALLSTAR fitting was preferred to allow us using the DAOPHOT shape parameters (, ) to cull nonstellar objects (faint, small background galaxies) as far as possible. Stars detected were retained if (i) their positions on both filters matched to within 1 px, (ii) , ABS(), and (iii) measurement uncertainties were smaller than 0.5 mag. Photometric calibration in the VEGAMAG system followed the prescription in Sirianni et al. (2005), with the latest zero points recommended on the instrument web pages333http://www.stsci.edu/hst/wfc3/phot_zp_lbn; http://www.stsci.edu/hst/acs/analysis/zeropoints. Final transformation to the ground-based magnitude scale follows Saha et al. (2011).
3. Results
3.1. Color Magnitude diagrams
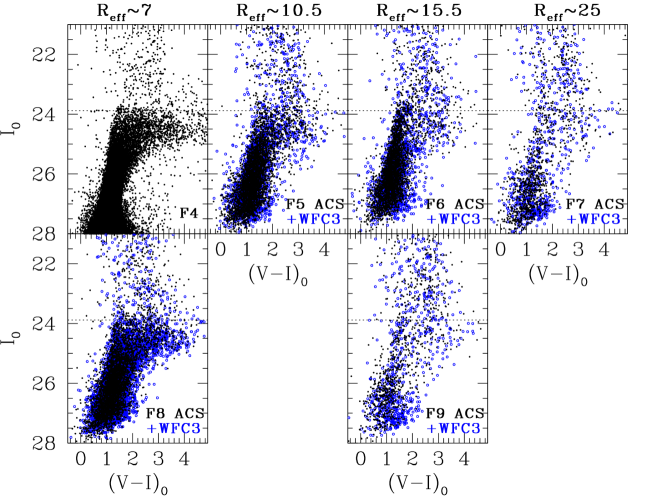
In Figure 2 we show the color-magnitude diagrams (CMDs) for the new fields, in comparison with the deep CMD in F4 from Cycle 11 (Rejkuba et al., 2005). The top row displays the CMDs in fields along the major axis (F5-F7), while the bottom row shows the CMDs for the two fields along the minor axis (F8-F9). The CMDs for fields along the minor axis fields are plotted immediately below the corresponding CMD of the major axis field that is on the same ellipse (c.f. Fig.1). The magnitudes and colors are extinction-corrected for each field individually following the Schlafly & Finkbeiner (2011) recalibration of the Galactic extinction maps of Schlegel et al. (1998), assuming the Fitzpatrick (1999) reddening law with . The dotted horizontal line marks the expected magnitude of the tip of the RGB at (Harris et al., 2010).
The CMDs in Fig. 2 show a very similar, broad upper RGB in fields F4 and F8; F5 is almost as broad in color. F6, however, has a narrower upper RGB, in particular in the ACS pointings (black dots), suggesting the beginning of a transition to a more metal-poor-dominated population. In F7 and F9, the RGB is quite sparsely populated, but the color distribution still resembles that of F6.
Most of the objects brighter than (i.e. clearly above the RGB tip) are foreground Milky Way (MW) stars, but a few bright AGB stars are expected in NGC 5128 halo, based on the study of Long Period Variables (Rejkuba et al., 2003), and 38 kpc field star formation history (Rejkuba et al., 2011). The camera areas ratio (ACS/WFC3) is 1.55, and we thus expect the same ratio for the number of bright stars, if they all belong to the MW foreground. This is indeed observed in F7 and F9, but there are fewer stars in F5, F6 and F8 WFC3 pointings compared to ACS. This might be due to a small variation of contribution from bright AGB stars in NGC 5128 or sub-structure in the MW foreground, and will be investigated in a follow-up study. At levels fainter than the tip of the RGB (), foreground stars are also present, and at the faintest magnitudes () compact high-redshift galaxies may also add to the contamination.
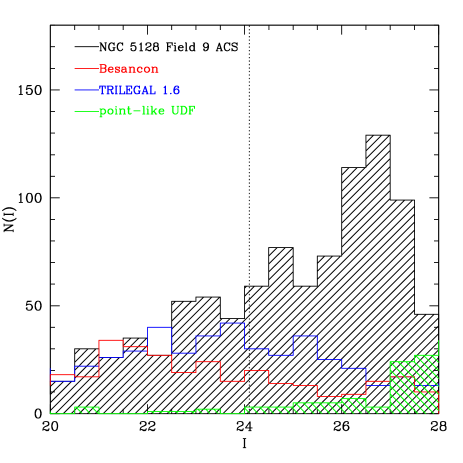
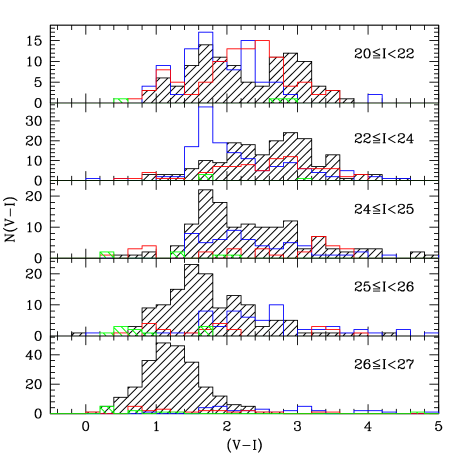
To estimate the foreground contamination quantitatively we use the TRILEGAL (Girardi et al., 2005) and Besançon (Robin et al., 2003) MW models, while the contamination by background unresolved galaxies can be evaluated from the Hubble Ultra Deep Field (UDF) observations444http://heasarc.gsfc.nasa.gov/W3Browse/hst/hubbleudf.html. We transformed the UDF F775W AB measurements to F814W on Vegamag photometric system adopting the relation from Sirianni et al. (2005). An example of the model field components is shown in Figure 3 for F9. The model starcounts above the RGB tip reveal significant differences between TRILEGAL and Besançon. Though the investigation of these differences is beyond the scope of this work, we decided to adopt TRILEGAL (version 1.6), because it had about 30% more stars with respect to the Besançon simulation, and it better matched the bright end of the observed luminosity function (Fig. 3, left), and the color distribution of the bright foreground stars with (Fig. 3, right).
The model field population from TRILEGAL run at each field location, normalized to the ACS/WFC and WFC3 areas, was used to statistically clean the observed CMDs in all five fields. This step removed almost all stars brighter than the RGB tip, except stars redder than , which are missing in the TRILEGAL simulations. The simulations include reddening, but were not corrected for incompleteness and therefore it is likely that the faintest stars are oversubtracted. However, since we are interested in the upper magnitude below the RGB tip, from which we measure the metallicity distributions, and the photometry is highly complete at that level, any such corrections will have no significant effect on the MDFs. Remaining potential contaminants from unresolved galaxies are mostly fainter and bluer than the stars used to derive MDFs (Fig. 3, right). This, combined with their low total number shows that the unresolved galaxies do not affect our metallicity distribution derivation.
The fact that the RGB is still detectable in F7 at 140 kpc () is noteworthy by itself; our original expectation in designing the observations was that it would act as a “control field” of almost pure field population based on outward extrapolation of the inner-halo density profile. In short, we have not yet found the limits of this giant galaxy’s halo. It is also striking that the CMD in the F9 minor axis field, lying on the same ellipse as F6 (the major axis field at ), appears similar to F7 at the much larger distance of along the major axis field; if the isophotal contours kept the same ellipticity with radius, then the level of star counts in F9 should be the same as in F6, but instead it is considerably lower, and similar to that in F7 (see Sec. 3.2). This evidence suggests that either the outer halo becomes increasingly elongated, as already suspected from the VIMOS observations by Crnojević et al. (2013); or that some sort of very extended tidal debris plume lies along the major axis, boosting the level of starcounts over the normal smooth halo component.
3.2. Halo Metallicity and Number Density Profiles
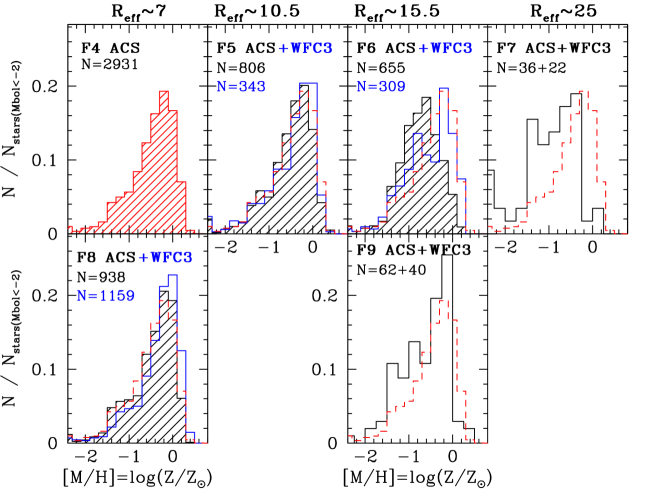
Our analysis of the very deep F4 photometry, which reached the red clump helium burning stars, quantitatively demonstrated that 70-80% of the stars have classically “old” ages in excess of Gyr (Rejkuba et al., 2011). The colors of the old RGB stars can therefore be used also for other halo fields to derive the MDF without complications from the age/metallicity degeneracy. Conversion of to heavy-element abundance for stars with was done by interpolation in an isochrone grid as described in Harris & Harris (2000), with the -enhanced Teramo isochrones (Pietrinferni et al., 2006) as done for F4 (Rejkuba et al., 2011). The MDFs for the inner fields 1-3 (observed with WFPC2) have also been re-derived with this newer isochrone set. The absolute metallicity scale coming from the use of the new set of isochrones results in slightly higher average metallicity (by about 0.2 dex) than reported in Rejkuba et al. (2005). However, all metallicities derived in this work are on the same scale and thus a relative comparison between the distributions of different fields is robust and can be used to investigate the halo metallicity gradient.
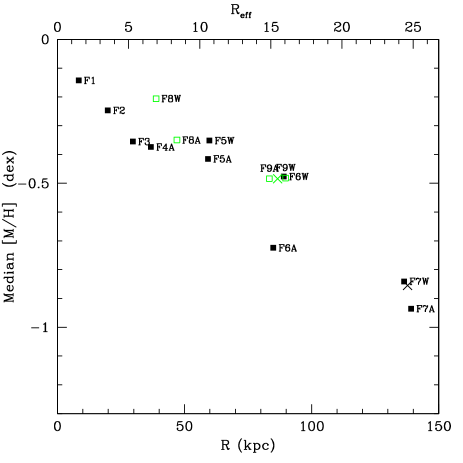
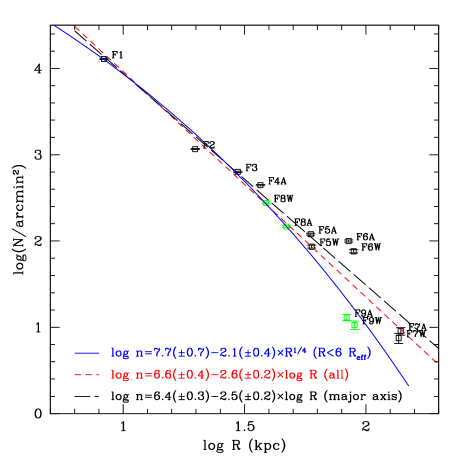
Figure 4 shows the new MDFs for all our fields F4-F9, derived from the foreground cleaned CMDs. The metallicity distributions are wide in all the panels, but in F7 and F9 they are poorly sampled because of small number statistics. We thus show combined WFC3 and ACS MDFs for F7 and F9. For comparison in all panels we overplot the MDF measured from ACS F4 dataset.
The left panel of Figure 5 shows the median metallicity as a function of projected distance from the center of the galaxy along the major axis. The green open symbols denote minor axis fields (F8 and F9), for which the distance is scaled to the major axis by multiplying with the inverse axis ratio (a/b=1/0.77). A clear metallicity gradient exists, with slope [M/H]/ dex per kpc, or [M/H]/ dex per Reff. Remarkably, however, even in the most remote parts of the halo we have sampled, the median metallicity has not fallen below [M/H] dex.
Field-to-field scatter also shows up, such as much lower [M/H] in the ACS vs. WFC3 pointing of F6. For F7 and F9 fields we plot in addition to individual ACS and WFC3, also a median [M/H] from both cameras together (crosses). Bootstrap simulations with 5000 random extractions of smaller samples representative for F7 and F9 MDFs, show that the median metallicity can be derived with dex accuracy for samples with stars, while the uncertainty increases to dex for samples of 20–40 stars. These simulations demonstrate that the metallicity difference between F7 and F9 is significant in spite of low statistics.
The difference between the F7 and F9 mean metallicity is even more remarkable considering that these two fields have similar stellar density. The right panel of Figure 5 shows the number density of RGB stars with (selected from foreground cleaned CMDs) as a function of the projected distance along the major axis. Previously mentioned striking difference between the minor and major axis fields located at the same projected major axis distance (F6 and F9) is even better appreciated here. The minor axis fields density profile follows the extrapolation of profile, while a power law provides a better fit along the major axis beyond R, where the stellar density exceeds the shallower profile. Additional field-to-field variations seen in metallicity are also observed in density distribution gradient. We may, perhaps, be seeing the record of incompletely mixed debris from hierarchical buildup of the halo.
4. Discussion and Conclusions
The new HST observations presented here trace the halo of an early-type giant galaxy to unprecedentedly large distances (). It is interesting to put this distance in a context of cosmological ”virial radius” , at which the mean density equals 200 the cosmological critical density. Taking the total mass of M⊙ for the entire Cen A group (Woodley, 2006, using dynamics of all the satellites), would imply that the Cen A group virial radius is kpc, and our outermost field at 140 kpc corresponds to 1/3 of the virial radius.
Comparison of the RGB star counts between the major and minor axes suggests increasing elongation of the halo beyond . While sub-structure is expected to be present in the outer halo, the significantly lower density of stars at 16 Reff along the minor vs. major axis is also confirmed by the detection of stars at much larger distance along the major axis. This result furthermore confirms a tentative detection of the increasing ellipticity in the outer halo by Crnojević et al. (2013). This result is also interesting in comparison with the average ellipticity of stellar halos of early-type galaxies from Tal & van Dokkum (2011), which is based on a very deep stack of more than 42,000 SDSS images of luminous red galaxies. These authors found an increasing ellipticity with radius from at 10 kpc to at 100 kpc. The ellipticity in the halo of NGC 5128 appears to increase even more, although our so-far sparse sampling of the halo is only suggestive.
Tal & van Dokkum (2011) furthermore found that the surface brightness profile of their average stellar halo follows a Sersic model out to 100 kpc, but an excess of light beyond that is present in r, i and z-band stacks. They discuss whether this excess light is part of the galaxy haloes or it traces the unresolved intragroup or intracluster light. With our measurement of the NGC 5128 metallicity gradient and starcounts we find no clear transition to intragroup light beyond 90 kpc (beyond F6) in NGC 5128. Observations of further more distant fields along the minor and major axis would be necessary however to confirm this.
While the inner parts of the galaxy show a smooth metallicity gradient, we observe quite strong field-to-field variations in the median metallicity of the stars in the outer regions, as expected if the halo is built up by accretion of different satellites. However, the relatively high median metallicity is surprising, and the extended halo along the major axis might suggest that we are looking at least partly at material ejected from a long-ago accretion of a disk galaxy. This conclusion is supported by the analysis of the age distributions of stars (Rejkuba et al., 2011) and globular clusters (Woodley et al., 2010), as well as the presence of dynamical subgroupings of the globular clusters and planetary nebulae in the halo (Woodley & Harris, 2011).
References
- Abraham & van Dokkum (2014) Abraham, R. G., & van Dokkum, P. G. 2014, PASP, 126, 55
- Anderson & Bedin (2010) Anderson, J., & Bedin, L. R. 2010, PASP, 122, 1035
- Carollo et al. (2007) Carollo, D., Beers, T. C., Lee, Y. S., et al. 2007, Nature, 450, 1020
- Chapman et al. (2006) Chapman, S. C., Ibata, R., Lewis, G. F., et al. 2006, ApJ, 653, 255
- Cooper et al. (2013) Cooper, A. P., D’Souza, R., Kauffmann, G., et al. 2013, MNRAS, 434, 3348
- Crnojević et al. (2013) Crnojević, D., Ferguson, A. M. N., Irwin, M. J., et al. 2013, MNRAS, 432, 832
- Dufour et al. (1979) Dufour, R. J., Harvel, C. A., Martins, D. M., et al. 1979, AJ, 84, 284
- Fitzpatrick (1999) Fitzpatrick, E. L. 1999, PASP, 111, 63
- Font et al. (2011) Font, A. S., McCarthy, I. G., Crain, R. A., et al. 2011, MNRAS, 416, 2802
- Girardi et al. (2005) Girardi, L., Groenewegen, M. A. T., Hatziminaoglou, E., & da Costa, L. 2005, A&A, 436, 895
- Harris & Harris (2000) Harris, G. L. H., & Harris, W. E. 2000, AJ, 120, 2423
- Harris et al. (1999) Harris, G. L. H., Harris, W. E., & Poole, G. B. 1999, AJ, 117, 855
- Harris et al. (2010) Harris, G. L. H., Rejkuba, M., & Harris, W. E. 2010, PASA, 27, 457
- Harris & Harris (2002) Harris, W. E., & Harris, G. L. H. 2002, AJ, 123, 3108
- Harris et al. (2007) Harris, W. E., Harris, G. L. H., Layden, A. C., & Wehner, E. M. H. 2007, ApJ, 666, 903
- Jablonka et al. (2010) Jablonka, P., Tafelmeyer, M., Courbin, F., & Ferguson, A. M. N. 2010, A&A, 513, A78
- Johnston et al. (2008) Johnston, K. V., Bullock, J. S., Sharma, S., et al. 2008, ApJ, 689, 936
- Marleau et al. (2000) Marleau, F. R., Graham, J. R., Liu, M. C., & Charlot, S. 2000, AJ, 120, 1779
- Mihos et al. (2013) Mihos, J. C., Harding, P., Rudick, C. S., & Feldmeier, J. J. 2013, ApJ, 764, L20
- Naab & Ostriker (2009) Naab, T., & Ostriker, J. P. 2009, ApJ, 690, 1452
- Pietrinferni et al. (2006) Pietrinferni, A., Cassisi, S., Salaris, M., & Castelli, F. 2006, ApJ, 642, 797
- Rejkuba et al. (2005) Rejkuba, M., Greggio, L., Harris, W. E., Harris, G. L. H., & Peng, E. W. 2005, ApJ, 631, 262
- Rejkuba et al. (2011) Rejkuba, M., Harris, W. E., Greggio, L., & Harris, G. L. H. 2011, A&A, 526, A123+
- Rejkuba et al. (2001) Rejkuba, M., Minniti, D., Bedding, T., & Silva, D. 2001, A&A, 379, 781
- Rejkuba et al. (2003) Rejkuba, M., Minniti, D., Silva, D., & Bedding, T. 2003, A&A, 411, 351
- Robin et al. (2003) Robin, A. C., Reylé, C., Derrière, S., & Picaud, S. 2003, A&A, 409, 523
- Saha et al. (2011) Saha, A., Shaw, R. A., Claver, J. A., & Dolphin, A. E. 2011, PASP, 123, 481
- Schlafly & Finkbeiner (2011) Schlafly, E. F., & Finkbeiner, D. P. 2011, ApJ, 737, 103
- Schlegel et al. (1998) Schlegel, D. J., Finkbeiner, D. P., & Davis, M. 1998, ApJ, 500, 525
- Sirianni et al. (2005) Sirianni, M., Jee, M. J., Benítez, N., et al. 2005, PASP, 117, 1049
- Soria et al. (1996) Soria, R., Mould, J. R., Watson, A. M., et al. 1996, ApJ, 465, 79
- Stetson (1987) Stetson, P. B. 1987, PASP, 99, 191
- Tal & van Dokkum (2011) Tal, T., & van Dokkum, P. G. 2011, ApJ, 731, 89
- Ubeda & Anderson (2012) Ubeda, L., & Anderson, J. 2012, Study of the evolution of the ACS/WFC charge transfer efficiency, Tech. rep.
- Woodley (2006) Woodley, K. A. 2006, AJ, 132, 2424
- Woodley et al. (2010) Woodley, K. A., Harris, W. E., Puzia, T. H., et al. 2010, ApJ, 708, 1335
- Woodley & Harris (2011) Woodley, K. A., & Harris, W. E. 2011, AJ, 141, 27
- Zibetti et al. (2004) Zibetti, S., White, S. D. M., & Brinkmann, J. 2004, MNRAS, 347, 556