THE SHOCK-INDUCED STAR FORMATION SEQUENCE RESULTING FROM A CONSTANT SPIRAL PATTERN SPEED
Abstract
We utilize a suite of multiwavelength data, of 9 nearby spirals, to analyze the shock-induced star formation sequence, that may result from a constant spiral pattern speed. The sequence involves tracers as the HI, CO, , and FUV, where the spiral arms were analyzed with Fourier techniques in order to obtain their azimuthal phases as a function of radius. It was found that only two of the objects, NGC 628 and NGC 5194, present coherent phases resembling the theoretical expectations, as indicated by the phase shifts of CO-. The evidence is more clear for NGC 5194, and moderate for NGC 628. It was also found that the phase shifts are different for the two spiral arms. With the exception on NGC 3627, a two-dimensional Fourier analysis showed that the rest of the objects do not exhibit bi-symmetric spiral structures of stellar mass, i.e., grand design spirals. A phase order inversion indicates a corotation radius of for NGC 628, and for NGC 5194. For these two objects, the CO-H phase shifts corroborate the CO- azimuthal offsets. Also for NGC 5194, the CO-, CO-, and CO- phase shifts indicate a corotation region.
1 Introduction
Nowadays, the majority of numerical simulations show no agreement for the hypotheses of long-lived quasi-steady spiral structure (Lin & Shu, 1964; Bertin et al., 1989). Instead, recurrent short-lived transient spirals are often obtained (e.g., Sellwood, 2011; Wada et al., 2011; Fujii et al., 2011; Grand et al., 2012; Baba et al., 2013; D’Onghia et al., 2013; Roca-Fàbrega et al., 2013). However, azimuthal age gradients studies suggest otherwise (e.g., Martínez-García et al., 2009a; Martínez-García & González-Lópezlira, 2013), and are in agreement with other observational studies of age patterns (or offsets) across spiral arms (e.g., Efremov, 1985; Egusa et al., 2009; Grosbøl & Dottori, 2009; Sánchez-Gil et al., 2011; Cedrés et al., 2013). In a study of the age and the star formation rate of HII regions, Cedrés et al. (2013), had found newly evidence of the triggering of star formation by density waves (DWs). Also, the studies by Scarano et al. (2011), and Scarano & Lépine (2013), related to the “breaks” in the radial metallicity distribution found near the corotation, imply that spiral arms may be long-lived structures. Any discontinuities in the radial metallicity profiles would be smoothed out unless a dominant pattern speed exists with a sole corotation (Scarano & Lépine, 2013).
Altogether these observations suggest the presence of spiral DWs in galaxies. Age/color gradients, across spiral arms, indicate that the pattern speed for these objects must be a constant for all radii. From this point it is inferred that the patterns are long-lived as proposed by density wave (DW) theory. Nevertheless, there is no quantification of the lifetime of the spirals. However, it is known that spirals are expected to appear at redshifts of (Elmegreen & Elmegreen, 2014). Even more, an apparent spiral structure has been found at a redshift of (Law et al., 2012). For those spirals to survive at would require lifetimes of at least Gyr. Whether these structures are long-lasting patterns is still an unresolved issue.
The DW theory is not the only one that predicts a constant angular speed for the spiral pattern. The “manifold theory” (Romero-Gómez et al., 2006; Voglis & Stavropoulos, 2006a; Voglis et al., 2006b, c; Romero-Gómez et al., 2007; Tsoutsis et al., 2008, 2009; Athanassoula et al., 2009a, b, 2010), where chaotic orbits play a major role in generating spiral structure, also predicts the same behavior. In the view of Romero-Gómez et al. (2006, 2007); Athanassoula et al. (2009a, b, 2010), the “manifolds” behave as tube structures that trap chaotic orbits within them. In contrast to DW theory, where the stars that make up the spirals do not remain within them, the manifold theory (in the view of Athanassoula et al.) predicts that stars must follow along the arms in a direction away from corotation. Manifold theories had only been proposed for barred-spiral systems, where the bar’s gravitational potential generates unstable Lagrange points near corotation. A manifold theory to explain spiral structure in normal (or weakly barred) galaxies is under development (Athanassoula 2013, private communication).
Regardless of the theory involved, or the lifetime of the patterns, many of the observational evidence (discussed above) suggests that some disk galaxies must present a fixed spiral pattern speed for all radii at the present moment. If such spiral arms trigger star formation (SF), besides the previously discussed azimuthal age/color gradients, some observational tracers for different stages of the star formation sequence should show a spatial ordering (e.g., Foyle et al., 2011). From upstream to downstream before the corotation, and in the corotating frame, we may have dense HI tracing the compressed gas, CO tracing molecular gas, emission tracing dust-obscured star formation (Calzetti et al., 2007), and UV emission tracing unobscured young stars. This research involves the analysis of spiral galaxies in search for this sequence of stages of star formation. For this purpose we chose the Fourier method of Puerari & Dottori (1997), that determines the phases of the intensities for spiral arms as observed in different wavelengths.
2 Data sample
This research utilizes common data of nearby spirals in SINGS (Kennicutt et al., 2003), THINGS (Walter et al., 2008), HERACLES (Leroy et al., 2009), and GALEX (Gil de Paz et al., 2004, 2007). The Spitzer Infrared Nearby Galaxies Survey (SINGS) is a Legacy survey aimed to characterize the infrared emission across the entire range of galaxy properties and star formation environments. SINGS integrates visible/UV and IR/submillimeter studies into a coherent self-consistent whole. The HI Nearby Galaxy Survey (THINGS) was a program undertaken at the National Radio Astronomy Observatory (NRAO), Very Large Array (VLA), to perform 21-cm HI observations of nearby galaxies. The goal of THINGS was to investigate galaxy morphology, star formation and mass distribution across the Hubble sequence. Data from THINGS complement SINGS. The HERA CO-Line Extragalactic Survey (HERACLES) used the IRAM 30-m telescope to map CO emission from nearby galaxies. HERACLES was built to complement THINGS, SINGS, and associated surveys. The GALEX Nearby Galaxies Survey (NGS) intends to answer fundamental open questions on galaxy evolution and UV properties of galaxies. The NGS sample was partially built using the Spitzer’s Reserved Observations Catalog. The NGS was the forerunner of the GALEX Ultraviolet Atlas of Nearby Galaxies (Gil de Paz et al., 2007). Together these surveys give us a bolometric view of local galaxies in the universe.
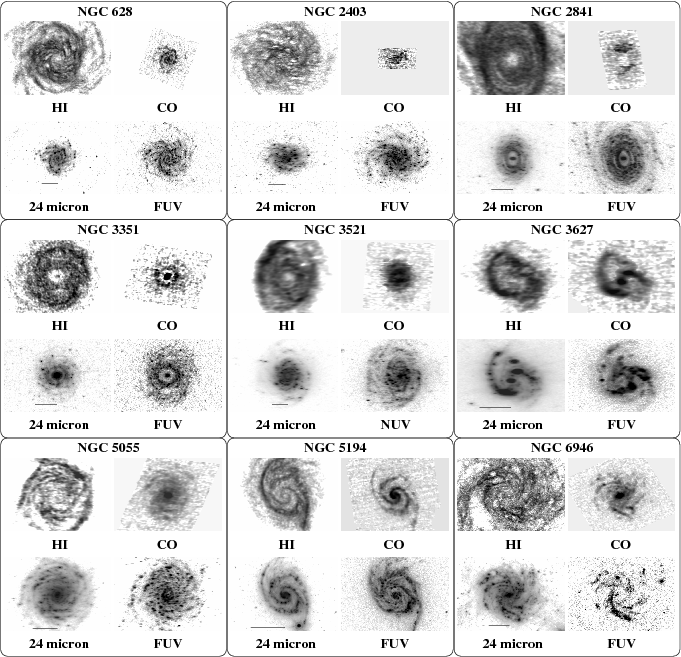
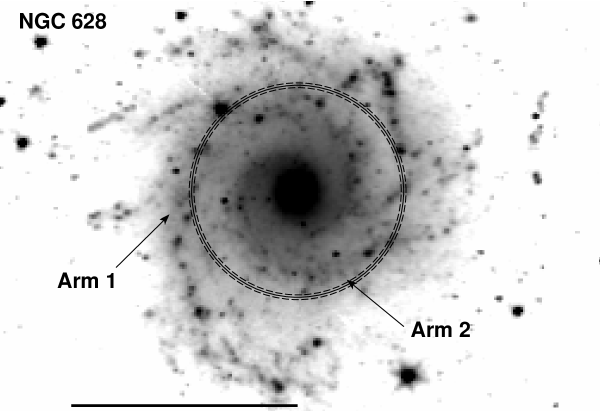
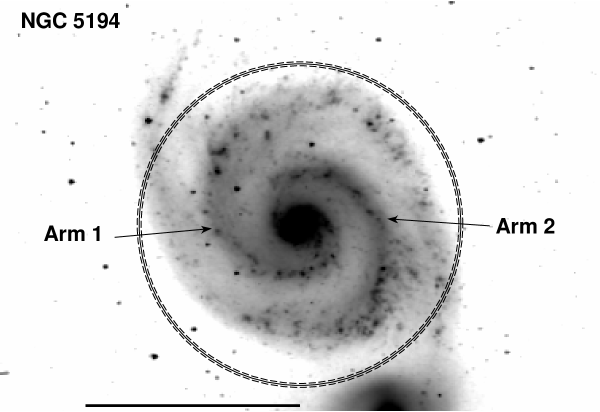
Our sample consists of 9 spiral galaxies with data from (SINGS, Kennicutt et al., 2003), HI (THINGS, Walter et al., 2008), 12CO (HERACLES, Leroy et al., 2009), and FUV111 With the exception of NGC 3521 where we use the NUV () waveband. (GALEX, , Gil de Paz et al., 2004, 2007). The sample was chosen following Foyle et al. (2011) who used a polar cross-correlation method and found little evidence of offsets for the different star formation stages assuming a DW scenario. Here we examine 9 objects of their sample adopting a different approach (phases via Fourier analysis, see section 3). We ensure that our selected objects have data in each of the frequencies of interest. The objects are shown in figure 1. Each frame was deprojected with the parameters presented in table 1. The images were registered using the WCS information of the THINGS data. The HI, , and FUV data were convolved with a circularly symmetric Gaussian function with a FWHM of , this corresponds to the resolution of the HERACLES data (Leroy et al., 2009).
The morphological classification (from RC3, de Vaucouleurs et al., 1991, see table 1) indicates that four of our objects (NGC 628, NGC 2841, NGC 5055, and NGC 5194) have no evident bar in general (SA galaxies), other four (NGC 2403, NGC 3521, NGC 3627, and NGC 6946) have characteristics intermediate between barred and nonbarred galaxies (SAB galaxies), and one object (NGC 3351) has a clear and well-defined bar (SB galaxy). The arm classification (Elmegreen & Elmegreen, 1982, 1987) indicates that five objects (NGC 628, NGC 3351, NGC 3627, NGC 5194, and NGC 6946) have two symmetric arms, i.e. arm class greater than 5, in which only NGC 5194 has two long symmetric arms dominating the optical disk, i.e. arm class 12. Regarding the environmental information of our sample of galaxies (cf. NED222http://ned.ipac.caltech.edu/), NGC 628 is a X-ray-faint group member (Sengupta & Balasubramanyam, 2006); NGC 5194 is a Pair member (Karachentsev, 1972); NGC 2403, NGC 2841, NGC 3521, and NGC 6946 are isolated galaxies (Karachentseva, 1973; Sandage & Tammann, 1975); while NGC 3351, NGC 3627, and NGC 5055 are in a radial-velocity based grouping (Mahtessian, 1998).
| Object | Type | AC | Incl. () | P.A. () | (km s | Dist.(Mpc) |
|---|---|---|---|---|---|---|
| NGC 628 (M74) | SA(s)c | 9 | 7 | 20 | 179 | 9.93 |
| NGC 2403 | SAB(s)cd | 4 | 63 | 124 | 118 | 4.55 |
| NGC 2841 | SA(r)b | 3 | 63 | 148 | 327 | 12.26 |
| NGC 3351 (M95) | SB(r)b | 6 | 41 | 192 | 187 | 9.00 |
| NGC 3521 | SABrs)bc | 3 | 65 | 162 | 234 | 8.00 |
| NGC 3627 (M66) | SAB(s)b | 7 | 62 | 173 | 183 | 6.53 |
| NGC 5055 (M63) | SA(rs)bc | 3 | 59 | 102 | 208 | 8.33 |
| NGC 5194 (M51) | SA(s)bc | 12 | 20 | 172 | 211 | 9.12 |
| NGC 6946 | SAB(rs)cd | 9 | 33 | 242 | 181 | 5.49 |
Note. — Column 2: morphological type (RC3, de Vaucouleurs et al., 1991). Column 3: arm class (Elmegreen & Elmegreen, 1982, 1987). Columns 4 and 5: inclination and position angles in degrees (Foyle et al., 2011). Column 6: observed maximum velocity of rotation (Paturel et al., 2003), corrected for inclination (column 4). Column 7: Hubble flow distance from the NASA/IPAC extragalactic database (Virgo + Great Attractor + Shapley Supercluster), km/s/Mpc, , and .
3 Analysis
Our adopted method is based on the Fourier analysis of azimuthal intensities to locate the corotation radius () in spiral galaxies (Puerari & Dottori, 1997). The Fourier transform
| (1) |
where is the intensity of radiation as a function of radius (), is computed for the object’s image at a certain waveband. The azimuthal phase, , is then computed as
| (2) |
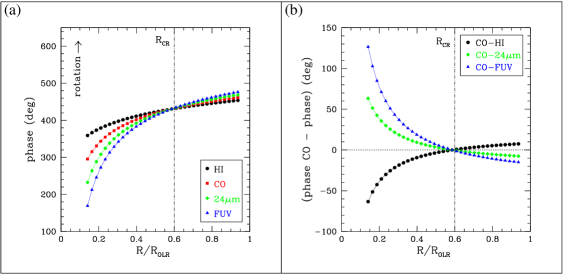
For bi-symmetrical spirals we have , then . This method has the advantage of getting the phase of the spiral even in the presence of noise or when the data is mixed with radiation from other sources (e.g., foreground and background objects). For the case when the spiral pattern speed is a constant for all radii (as in the DW scenario) we expect the HI,333We notice that we keep the HI at the beginning of the sequence, assuming that it is tracing the highly compressed gas, despite the fact that it is affected by the process of molecular photodissociation in star-forming regions (e.g., Allen et al., 1986; Rand et al., 1992; Louie et al., 2013). CO, , and FUV spirals to present Fourier phases in a sequential order. This order should be inverted near corotation, as shown in figure 2.444 As compared with the phases, the maximums of the azimuthal emission in the arms would be displaying a reverse order. Also the curvature of the lines plotted in panel “a” of figure 2 changes from concave to convex if the maximum of the azimuthal emission is graphed instead of the respective phases. This is because before corotation the angular velocity of the disk material, , is higher than the angular velocity of the spiral pattern, . The angular velocities are equal at corotation, and beyond corotation exceeds .
The curves for the phases in figure 2 can be described with the equation
| (3) |
where is the pitch angle of the spiral shock, is a constant that determines the angular spatial location of the spiral shock (in the corotating frame), is the time elapsed between the shock and the corresponding star formation stage, and is the circular velocity of rotation. In this sense, each phase angle curve dependence on the waveband is given by the quantity . We must remark that equation 3 assumes circular orbits for the gas and stars involved in the star formation sequence. However, after passing through a spiral shock the material flows to some extent along the arms, and then flows to the interam region (Martínez-García et al., 2009b; Dobbs & Pringle, 2010). Martínez-García et al. (2009b) has shown that by assuming a circular motion model, the determination of the pattern speed () is affected for radii different from corotation (), and that this effect does not prevents that star formation offsets (or the corresponding azimuthal age gradients) are observed across the arms. The material’s non-circular motions near the spiral arms (or streaming motions) can distort the curves shown in figure 2, but only for radii away from .
The HI, CO, , and FUV data for our sample of objects were analyzed via the Fourier phases method. We assumed trailing spirals and adopt positive values for the phases in the direction of rotation.
3.1 Mass spirals of the grand design type
Taking into account the structural type of their arms only grand design spirals are suitable to test the predictions of DW theory (e.g., Efremov, 2011). The multi-arm and flocculent spirals do not fall under this context. To ensure that a spiral galaxy is of the grand design type, its mass structure has to be analyzed (Martínez-García & González-Lópezlira, 2013).555In the early stages of this research (Martínez-García & Puerari, 2014), we obtained two-dimensional stellar mass maps (Zibetti, Charlot, & Rix, 2009) by comparing photometry with a Monte Carlo library of stellar population synthesis models, and dust radiation models for longer wavelengths (da Cunha et al., 2008). We obtained a filamentary mass structure in the spiral arms of some objects, e.g., NGC 5194. The structure is coincident with dust lane locations in the optical, and is preserved even if only optical colors are adopted in the method. A possible explanation may come from mass and dust relations, derived from studies of nearby spiral galaxies (Brinchmann et al., 2004; Grootes et al., 2013; Zahid et al., 2013), which show a similar behavior. Also in the case of NGC 5194, Mentuch Cooper et al. (2012) suggest that stellar and dust components may be coupled. More research will be conducted in the future in this respect. This is due to the fact that even in the NIR wavelengths the old population can be significantly contaminated with young stellar objects, and dust radiation for wavelengths longer than (e.g., Meidt et al., 2012).
To tackle this problem we take into account the fact that strong “mass spirals” must produce strong “large-scale spiral arm shocks” and the corresponding dust lanes (Roberts, 1969; Slyz et al., 2003; Gittins & Clarke, 2004). Dust lanes can be adequately traced near spiral arms because of the extinction of radiation that reveals them (see e.g., Gonzalez & Graham, 1996).
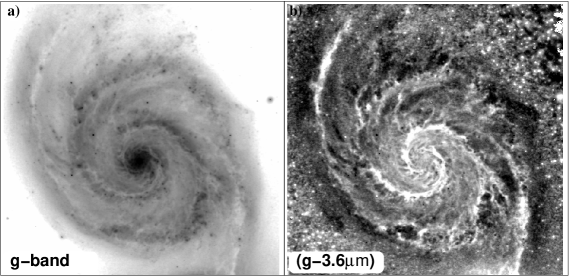
In order to trace the dust lanes we obtain maps of the 666All the objects in our sample have cross-sections in SDSS DR8 (Aihara et al., 2011), expect for NGC 6946 for which we use the -band (Kennicutt et al., 2003), and obtain the color. color for each object in our sample (see e.g., figure 3). For each of these images we apply the 2D (two-dimensional) Fourier transform method commonly used to determine spiral arms pitch angle (e.g., Considere & Athanassoula, 1988; Puerari & Dottori, 1992; Saraiva Schroeder et al., 1994; Davis et al., 2012; Savchenko, 2012). The Fourier amplitudes are given by
| (4) |
where ; and are the polar coordinates; is the intensity at coordinates , ; is the number of spiral arms (or modes); and is related to the spiral arms pitch angle () by
| (5) |
where corresponds to the maximum of where , i.e. the maximum of the Fourier spectrum for mode . Therefore, once the radial annulus to be analyzed is chosen by fixing and , the amplitude of the complex matrix will show the more probable pitch angle of that structure in that annulus.
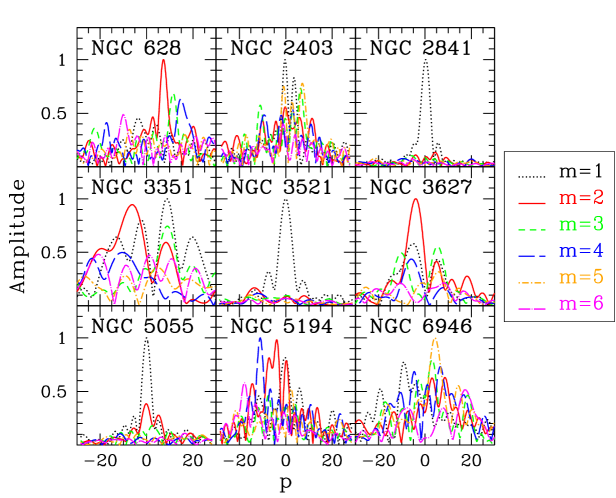
The Fourier amplitudes for modes through were determined as a function of the frequency . The adopted radial ranges, wherein the spiral structure is contained, are shown in table 2. The method gives negative or positive pitch angles () depending on the “S” or “Z” on-the-sky view of the object.777 It should be noted that all frequencies, positive and negative, can have an important role when spiral arm modulation is studied (Puerari et al., 2000).
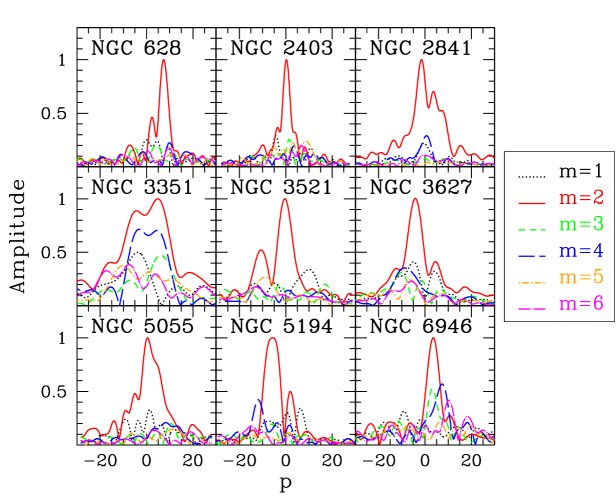
The purpose of applying the 2D Fourier transform method was to identify which objects host strong mass spirals with . To achieve this goal we utilize the “footprints” that the gravitational potential produces in the gas as it shocks. In figure 4 we show the results of this analysis for the images. According to this result, only three of the objects, NGC 628, NGC 3627, and NGC 5194, present evidence to host strong mass spirals with in their disks. Less clear evidence can also be appreciated for NGC 3351 and NGC 5055. In the case of NGC 5194 the mode is competing in amplitude with the mode, although with a smaller pitch angle. For comparison we apply the same method to the image and plot the results in figure 5. Significant differences can be appreciated for some objects, e.g., NGC 2841, and NGC 6946. As explained before, the radiation of the old stellar population as seen in the image is accompanied by radiation of young stellar objects, and dust emission (Meidt et al., 2012). In this sense, the mass distribution that can be inferred from the image would not be the same to that required to produce the dust lanes on the image, i.e., the product of the spiral shock. The difference between figures 4 and 5 is more probably due to the fact that the NIR images do not trace solely the stellar mass.
This preliminary test gives us information of which objects present mass spirals with strong modes in their disks, and, if this is the case, are likely to have a constant spiral pattern speed for all radii. For the rest of the objects, we anticipate that a lack of positive results, regarding offsets for the different stages of the star formation sequence, is probably due to the absence of adequate spiral perturbations causing the expected phenomenon.
| Object | |||
|---|---|---|---|
| NGC 628 | 190 | 9.1 | (26.3-223.0) |
| NGC 2403 | 368 | 8.1 | (28.9-348.3) |
| NGC 2841 | 158 | 9.4 | (31.5-199.0) |
| NGC 3351 | 158 | 6.9 | (95.0-214.7) |
| NGC 3521 | 115 | 4.5 | (35.8-125.0) |
| NGC 3627 | 165 | 5.2 | (63.3-189.4) |
| NGC 5055 | 180 | 7.3 | (52.4-288.4) |
| NGC 5194 | 270 | 11.9 | (43.5-295.7) |
| NGC 6946 | 195 | 5.2 | (57.4-243.9) |
4 Results and discussion
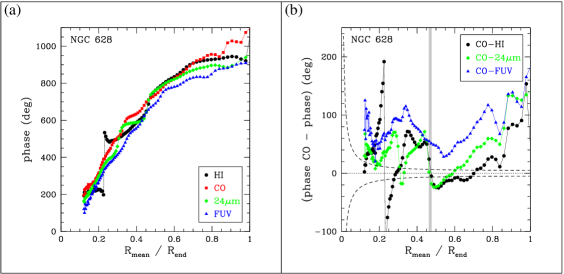
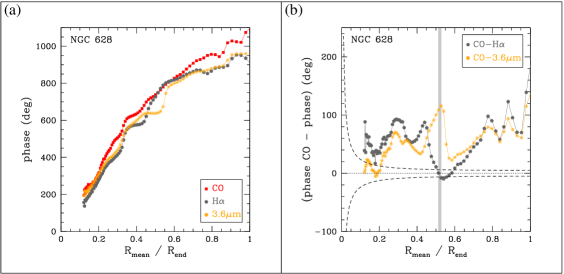
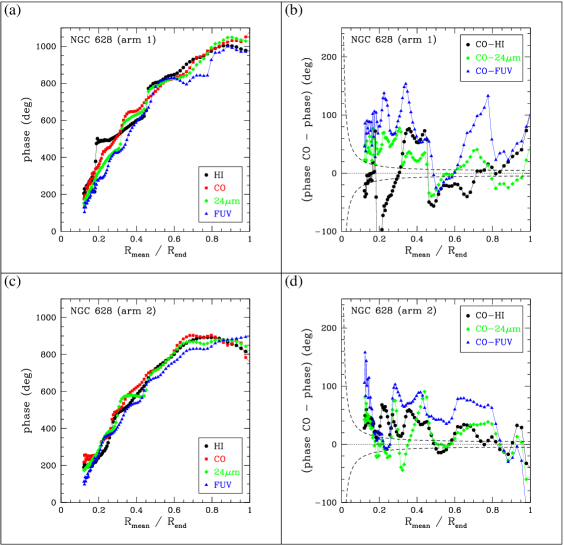
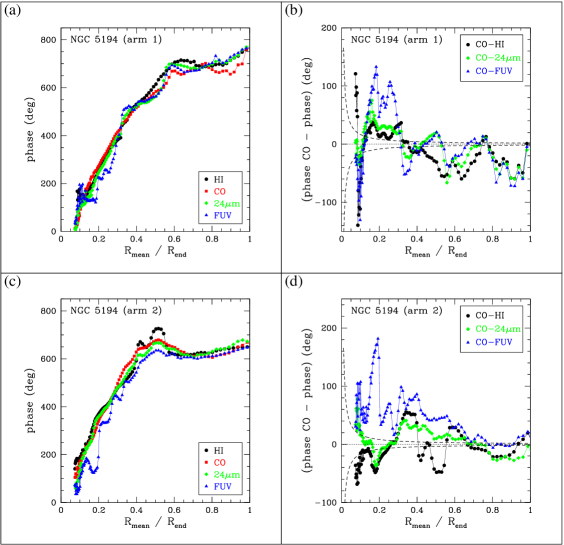
We compare the phases obtained for the 9 objects in our sample with the expected star formation sequence. We find that only two of the objects, NGC 628 & NGC 5194, present coherent phases similar to the predictions of our model (equation 3, and figure 2). For the rest of the objects the plots show dissimilar patterns as compared to the model (see also section 3.1). Figures 6 and 7, show the phases plots for NGC 628 and NGC 5194 respectively, as a function of radius. The mean radius, , has been normalized to the radius where the spirals are observed to end in the image (SINGS, Kennicutt et al., 2003). These “spiral end points” () are listed in table 2. The long-dashed lines, in the right panels of the figures, indicate the error as a function of radius, this takes into account the resolution of the data (FWHM), and the median error from the Montecarlo simulations (see section 4.1).
For the NGC 628 HI data, we did not obtained Fourier phases that resemble our theoretical model (i.e., equation 3, and figure 2). The CO, , and FUV phases seem to have the expected order of the star formation sequence for the inner radii (before an hypothetical corotation). However, only the CO and phases show an indication of a corotation around (). Before this region, most of the CO phase shifts show positive values as expected. The agreement with expectations is not fulfilled after (), where positive CO phase shifts are obtained instead of negative ones. The phase shifts indicate that NGC 628’s strong spirals may terminate near the suggested corotation (see also Contopoulos & Grosbol, 1986; Patsis et al., 1991), if we assume a constant spiral pattern speed of the DW type. We consider the evidence of having constant for NGC 628 as moderate (see also Cedrés et al., 2013).
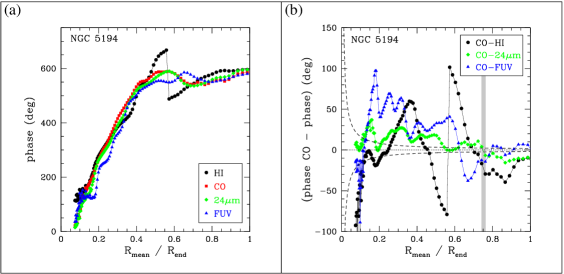
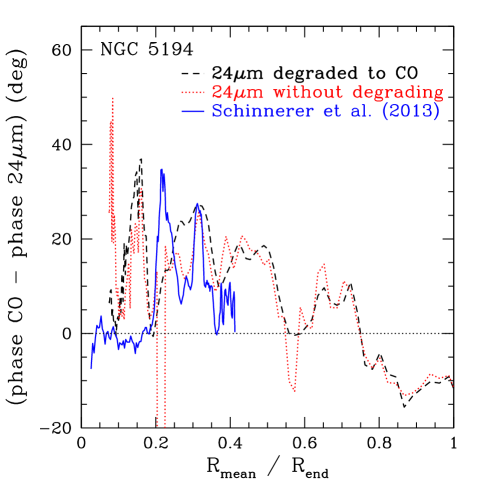
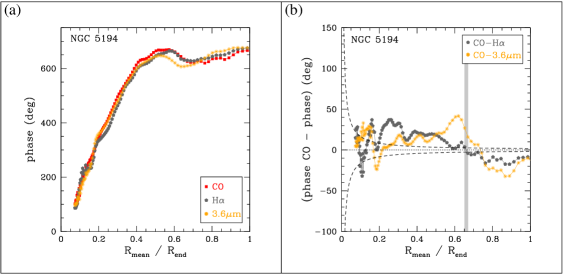
For NGC 5194 we again did not obtain phases values coincident with expectations for the HI data. Once more the CO, , and FUV phases present an ordered pattern that resembles the anticipated model (equation 3, and figure 2). The CO phase shifts suggest a corotation zone near (). Before this zone most of the CO phase shifts show positive values, and negative values are obtained afterwards. The COFUV phase shifts also feature a corotation radius near (). In figure 8 we show that the size of the CO angular offsets are of the same magnitude as those obtained by Schinnerer et al. (2013), who adopt a polar cross-correlation method. Schinnerer et al. (2013) take advantage of the PdBI Arcsecond Whirlpool Survey (PAWS), mapping 12CO . We consider a clear evidence of having constant for NGC 5194.
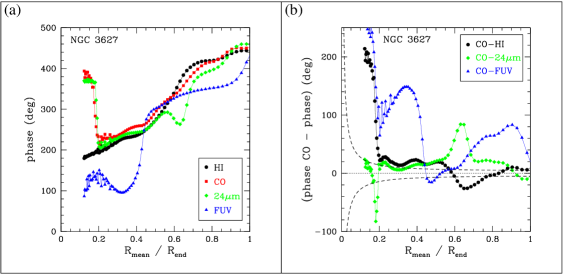
The case of the barred galaxy NGC 3627 is shown in figure 9. It has been shown that this object hosts strong () mass spirals in its disk (see section 3.1). For the CO-FUV phase shifts there is a hint of a corotation around (). However the phase shifts for COHI, and CO do not confirm this possibility. The bar length is , or for .
As a supplementary study we also analyzed the H and data from SINGS (Kennicutt et al., 2003), for NGC 628 and NGC 5194, as well as the , , and data for NGC 5194, the latter obtained from the VNGS (The Very Nearby Galaxy Survey888http://hedam.lam.fr) that has used the PACS and SPIRE instruments on Herschel Space Observatory (Pilbratt et al., 2010). We compare the H and phases with the CO. Figures 10 and 11 show these complementary phases plots for NGC 628 and NGC 5194 respectively. The CO-H phase shift plots show a very similar behavior as compared with the CO phase shifts. In the case of NGC 628, the CO phase shifts show no indication of a corotation. For NGC 5194 the CO phase shift may be consistent with expectations for (), if we assume that the comes solely from an old stellar population downstream the shock? Albeit the local radiation can be strongly affected by dust emission and young stellar components (Meidt et al., 2012).
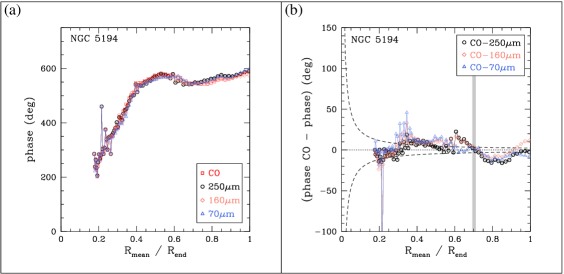
In the case of the analysis of NGC 5194’s Herschel data, we convolved the HERACLES CO, PACS , and PACS images with a Gaussian function having a FWHM of (the resolution of the SPIRE image). The results are shown in figure 12. We will discuss the region within (). Before this region, the phase shifts are within the data resolution, and to larger radii we approach the zone of influence of NGC 5195. The phase shifts between CO, CO, and CO, show a transition zone from being mostly positive to negative around (). This is another indication of a possible corotation near this zone. The figure also indicates that, for most of the spiral arm, the sequence of these tracers is arranged so that the CO is prior the emission, and followed by the emission. For the emission the situation is unclear, it seems to be located prior the emission before the corotation region, and later the after the corotation region.
4.1 Error analysis
In this section we analyze the sources of uncertainty that arise by using the Fourier phases method to analyze spiral perturbations. There are mainly three sources of error that may introduce biases in the results. These are the radians symmetry assumption (i.e., ), the inherent uncertainties in the intensities, and the projection parameters.
To analyze the errors that the radians symmetry assumption () has on our results, we isolate the spiral arms of NGC 628 and NGC 5194 according to figures 13, and 14 respectively. Then, the isolated spiral arms were treated as modes and analyzed with the Fourier technique. For NGC 628, the results of this test are shown on figure 15. For the spiral arm listed as number “1”, the phase shifts exhibit a similar behavior to the mode analysis (figure 6). Albeit the transition from positive CO phase shifts to the corotation, (), bears a better resemblance, and less scatter, as compared to the expected model (equation 3, and figure 2). For the spiral arm listed as number “2”, the phase shifts behavior is more chaotic in comparison with expectations. The results for NGC 5194 are shown in figure 16. For the spiral arm “1” the phase shifts show no clear corotation region. Contrariwise, the CO phase shifts for spiral arm “2” present a very good resemblance to the expected model. From these tests we can conclude that, in the case for NGC 628 and NGC 5194, the two arms presents dissimilar characteristics. Nonetheless, by adopting a radians symmetry () we are basically obtaining an “average” result for both arms, which still indeed shows an indication of a corotation.
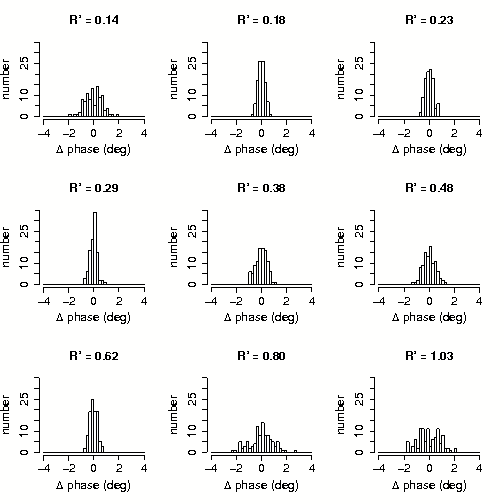
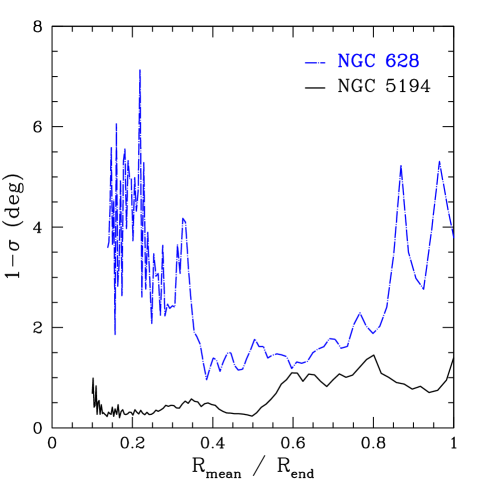
The errors related to the inherent uncertainties in the intensities can be analyzed with Monte Carlo methods. For this purpose we adopt the HERACLES (CO, Leroy et al., 2009) uncertainty maps. Each pixel of the integrated intensity maps was modeled with a Gaussian distribution with a standard deviation equal to its respective uncertainty. We generate 100 images by randomly assigning an intensity value to each pixel in the CO map in accordance to the Gaussian model. For each of the 100 frames we compute the Fourier phases values (see section 3). Then we obtained a probability distribution of the phases for each analyzed radius (see figure 17). From the probability distributions we estimate the error for each radius. The outcomes are shown in figure 18 for NGC 628, and NGC 5194. From these radial distributions we obtain the median error. This median error was added in quadrature to the error corresponding to the data resolution. We assume that the data from the other analyzed wavebands have similar uncertainties.
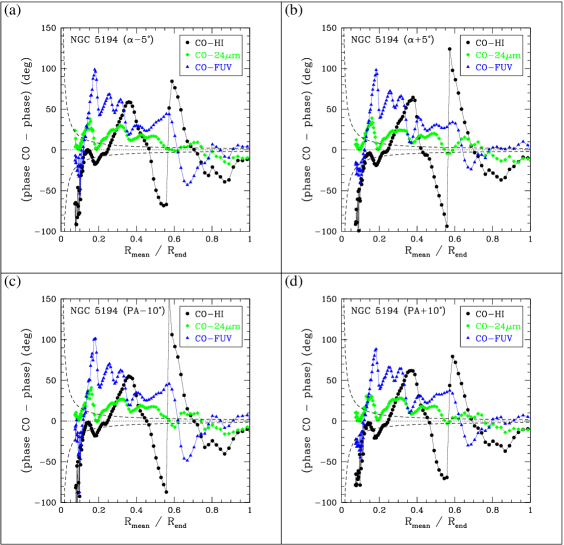
To asses the errors that the projection parameters may introduce in our analysis we modified the inclination angles () by , and the position angles (PA) by . The phases were recalculated. We show the results for NGC 5194 in figure 19. It was found that by varying the projection parameters we introduce small differences in the values of the phases, however, the overall trends and spatial distributions are much the same. This means that the “real” values for the phases are certainly affected by the “correct” projection parameters, but these uncertainties do not affect the main results of our analysis. The same conclusions are achieved for NGC 628.
4.2 UV emission
The UV radiation from young stellar objects belongs mainly to stars with spectral type O. These stars are short-lived ( Myr), hence they are never found too far away from their birthplaces, which can be strongly affected by dust attenuation. By the time when dust has been photo-evaporated locally, O stars may cease to exist and their unobscured UV radiation would be significantly reduced for that region. A possible example of this phenomenon may be that of NGC 5195 (the companion of NGC 5194). NGC 5195 is not detected in the FUV (Kuchinski et al., 2000) but only in the NUV. In the case of our research, we would not expect to find important UV radiation as expected in the ordered sequence of figure 2. This may be occurring for the results obtained for NGC 628 and NGC 5194, where the FUV Fourier phases partially behave as expected. O stars radiation may also heat the molecules of CO (as they do with the dust) affecting its emission (Rosa González-Lópezlira, private communication 2013). This may explain the “bumps” in the CO phase shifts obtained in figures 6, and 7, for NGC 628, and NGC 5194 respectively.
4.3 Spiral pattern speed dependence with radius
Our result for a constant spiral pattern speed for NGC 5194 differs from the findings of Meidt et al. (2008), who applied the radial Tremaine-Weinberg (TWR) method and found a dependence of with radius (see also Martínez-García et al., 2009b). The validity of the TWR method is based on the use of a kinematic tracer (gas) that must obey the continuity equation in the plane of the galaxy. However, the gas kinematics in the spiral arms and interarms of NGC 5194, indicate that out-of-plane motions may be significant (Shetty et al., 2007). Moreover, the spiral shock can extend to heights above the galactic midplane (Martos et al., 1999; Alfaro et al., 2001). The velocity vector towards the observer would be affected by these circumstances, and in the same way the continuity equation in the plane of the galaxy.
5 Conclusions
The results for the HI distribution near the spiral arms of NGC 628 and NGC 5194, indicate, once again, that HI is a photodissociated product of H2 molecules near star forming regions (Allen et al., 1986; Tilanus et al., 1988; Rand et al., 1992; Louie et al., 2013). In a DW scenario it would not entirely trace the highly compressed gas near the dust lanes. Thus its location in figure 2 is not entirely accurate.
The results obtained for NGC 5194 in this research are consistent with the findings of, e.g., Vogel et al. (1988), Tosaki et al. (2002), and Patrikeev et al. (2006), where the CO emission is preceding the star formation across the spiral arms. Egusa et al. (2009) already reported dissimilar CO-H offsets for the two different spiral arms. This may be due to the gravitational influence of the companion. In the case of NGC 628, Gusev & Efremov (2013) and Gusev et al. (2014), studied the different behavior of the star formation for the two distinct spiral arms. They indicate that this feature is seen for other grand design spirals, and the reason for this is not fully understood. Why is the star formation dissimilar for the two distinct arms in some grand-design spirals? The answer to this question may have to do with the origin of the (grand design) spiral structure which is not fully understood yet.
In summary our results indicate that two of the nine analyzed objects present a constant spiral pattern speed with a main corotation, as inferred from the comparison of observations and the star forming sequence model (equation 3 and figure 2, excluding the HI data), across spiral arms. These are NGC 628 with a corotation (see figure 13), and NGC 5194 with a corotation (see figure 14). By assuming a flat rotation curve, and adopting the parameters in table 1, we have spiral pattern speeds of (km s-1 kpc-1) for NGC 628, and (km s-1 kpc-1) for NGC 5194. The evidence of having constant is more clear for NGC 5194 than for NGC 628. The only object with strong two-arm () spiral structure not showing signs of a star formation sequence across its spiral arms is NGC 3627. For the remaining galaxies it was found that they do not present coherent phases, a fact that can be explained by the absence of a strong two-arm () mass structure in their spirals.
References
- Aihara et al. (2011) Aihara, H., Allende Prieto, C., An, D., et al. 2011, ApJS, 193, 29
- Alfaro et al. (2001) Alfaro, E. J., Pérez, E., González Delgado, R. M., Martos, M. A., & Franco, J. 2001, ApJ, 550, 253
- Allen et al. (1986) Allen, R. J., Atherton, P. D., & Tilanus, R. P. J. 1986, Nature, 319, 296
- Athanassoula et al. (2009a) Athanassoula, E., Romero-Gómez, M., & Masdemont, J. J. 2009a, MNRAS, 394, 67
- Athanassoula et al. (2009b) Athanassoula, E., Romero-Gómez, M., Bosma, A., & Masdemont, J. J. 2009b, MNRAS, 400, 1706
- Athanassoula et al. (2010) Athanassoula, E., Romero-Gómez, M., Bosma, A., & Masdemont, J. J. 2010, MNRAS, 407, 1433
- Baba et al. (2013) Baba, J., Saitoh, T. R., & Wada, K. 2013, ApJ, 763, 46
- Bertin et al. (1989) Bertin, G., Lin, C. C., Lowe, S. A., Thurstans, R. P. 1989, ApJ, 338, 78
- Brinchmann et al. (2004) Brinchmann, J., Charlot, S., White, S. D. M., et al. 2004, MNRAS, 351, 1151
- Calzetti et al. (2007) Calzetti, D., Kennicutt, R. C., Engelbracht, C. W., et al. 2007, ApJ, 666, 870
- Cedrés et al. (2013) Cedrés, B., Cepa, J., Bongiovanni, Á., et al. 2013, A&A, 560, A59
- Considere & Athanassoula (1988) Considere, S., & Athanassoula, E. 1988, A&AS, 76, 365
- Contopoulos & Grosbol (1986) Contopoulos, G., & Grosbol, P. 1986, A&A, 155, 11
- da Cunha et al. (2008) da Cunha, E., Charlot, S., & Elbaz, D. 2008, MNRAS, 388, 1595
- Davis et al. (2012) Davis, B. L., Berrier, J. C., Shields, D. W., et al. 2012, ApJS, 199, 33
- Dobbs & Pringle (2010) Dobbs, C. L., & Pringle, J. E. 2010, MNRAS, 409, 396
- D’Onghia et al. (2013) D’Onghia, E., Vogelsberger, M., & Hernquist, L. 2013, ApJ, 766, 34
- de Vaucouleurs et al. (1991) de Vaucouleurs, G., de Vaucouleurs, A., Corwin, H. G., Jr., Buta, R. J., Paturel, G.,& Fouque, P. 1991, ThirdReference Catalogue of Bright Galaxies (Berlin: Springer), (RC3)
- Efremov (1985) Efremov, Y. N. 1985, Soviet Astronomy Letters, 11, 69
- Efremov (2011) Efremov, Y. N. 2011, Astronomy Reports, 55, 108
- Egusa et al. (2009) Egusa, F., Kohno, K., Sofue, Y., Nakanishi, H., & Komugi, S. 2009, ApJ, 697, 1870
- Elmegreen & Elmegreen (1982) Elmegreen, D. M., & Elmegreen, B. G. 1982, MNRAS, 201, 1021
- Elmegreen & Elmegreen (1987) Elmegreen, D. M., & Elmegreen, B. G. 1987, ApJ, 314, 3
- Elmegreen & Elmegreen (2014) Elmegreen, D. M., & Elmegreen, B. G. 2014, ApJ, 781, 11
- Foyle et al. (2011) Foyle, K., Rix, H.-W., Dobbs, C. L., Leroy, A. K., & Walter, F. 2011, ApJ, 735, 101
- Fujii et al. (2011) Fujii, M. S., Baba, J., Saitoh, T. R., et al. 2011, ApJ, 730, 109
- Gil de Paz et al. (2004) Gil de Paz, A., Madore, B. F., Boissier, S., & GALEX Science Team 2004, Bulletin of the American Astronomical Society, 36, 1410
- Gil de Paz et al. (2007) Gil de Paz, A., Boissier, S., Madore, B. F., et al. 2007, ApJS, 173, 185
- Gittins & Clarke (2004) Gittins, D. M., Clarke, C. J. 2004, MNRAS, 349, 909
- Gonzalez & Graham (1996) Gonzalez, R. A., & Graham, J. R. 1996, ApJ, 460, 651
- Grand et al. (2012) Grand, R. J. J., Kawata, D., & Cropper, M. 2012, MNRAS, 421, 1529
- Grootes et al. (2013) Grootes, M. W., Tuffs, R. J., Popescu, C. C., et al. 2013, ApJ, 766, 59
- Grosbøl & Dottori (2009) Grosbøl, P., & Dottori, H. 2009, A&A, 499, L21
- Gusev & Efremov (2013) Gusev, A. S., & Efremov, Y. N. 2013, MNRAS, 434, 313
- Gusev et al. (2014) Gusev, A. S., Egorov, O. V., & Sakhibov, F. 2014, MNRAS, 437, 1337
- Karachentsev (1972) Karachentsev, I. D. 1972, Astrofizicheskie Issledovaniia Izvestiya Spetsial’noj Astrofizicheskoj Observatorii, 7, 3
- Karachentseva (1973) Karachentseva, V. E. 1973, Astrofizicheskie Issledovaniia Izvestiya Spetsial’noj Astrofizicheskoj Observatorii, 8, 3
- Kennicutt et al. (2003) Kennicutt, R. C., Jr., Armus, L., Bendo, G., et al. 2003, PASP, 115, 928
- Kuchinski et al. (2000) Kuchinski, L. E., Freedman, W. L., Madore, B. F., et al. 2000, ApJS, 131, 441
- Law et al. (2012) Law, D. R., Shapley, A. E., Steidel, C. C., et al. 2012, Nature, 487, 338
- Leroy et al. (2009) Leroy, A. K., Walter, F., Bigiel, F., et al. 2009, AJ, 137, 4670
- Lin & Shu (1964) Lin, C. C., & Shu, F. H. 1964, ApJ, 140, 646
- Louie et al. (2013) Louie, M., Koda, J., & Egusa, F. 2013, ApJ, 763, 94
- Martínez-García et al. (2009a) Martínez-García, E. E., González-Lópezlira, R. A., & Bruzual-A, G. 2009a, ApJ, 694, 512
- Martínez-García et al. (2009b) Martínez-García, E. E., González-Lópezlira, R. A., & Gómez, G. C. 2009b, ApJ, 707, 1650
- Martínez-García & González-Lópezlira (2013) Martínez-García, E. E., & González-Lópezlira, R. A. 2013, ApJ, 765, 105
- Martínez-García & Puerari (2014) Martínez-García, E. E., & Puerari, I. 2014, Astronomical Society of the Pacific Conference Series, 480, 137
- Martos et al. (1999) Martos, M., Allen, C., Franco, J., & Kurtz, S. 1999, ApJ, 526, L89
- Mahtessian (1998) Mahtessian, A. P. 1998, Astrofizika, 41, 308
- Meidt et al. (2008) Meidt, S. E., Rand, R. J., Merrifield, M. R., Shetty, R., & Vogel, S. N. 2008, ApJ, 688, 224
- Meidt et al. (2012) Meidt, S. E., Schinnerer, E., Knapen, J. H., et al. 2012, ApJ, 744, 17
- Mentuch Cooper et al. (2012) Mentuch Cooper, E., Wilson, C. D., Foyle, K., et al. 2012, ApJ, 755, 165
- Patrikeev et al. (2006) Patrikeev, I., Fletcher, A., Stepanov, R., et al. 2006, A&A, 458, 441
- Patsis et al. (1991) Patsis, P. A., Contopoulos, G., & Grosbol, P. 1991, A&A, 243, 373
- Paturel et al. (2003) Paturel, G., Petit, C., Prugniel, P., et al. 2003, A&A, 412, 45
- Pilbratt et al. (2010) Pilbratt, G. L., Riedinger, J. R., Passvogel, T., et al. 2010, A&A, 518, L1
- Puerari & Dottori (1992) Puerari, I., & Dottori, H. A. 1992, A&AS, 93, 469
- Puerari & Dottori (1997) Puerari, I., & Dottori, H. 1997, ApJ, 476, L73
- Puerari et al. (2000) Puerari, I., Block, D. L., Elmegreen, B. G., Frogel, J. A., & Eskridge, P. B. 2000, A&A, 359, 932
- Rand et al. (1992) Rand, R. J., Kulkarni, S. R., & Rice, W. 1992, ApJ, 390, 66
- Roberts (1969) Roberts, W. W. 1969, ApJ, 158, 123
- Roca-Fàbrega et al. (2013) Roca-Fàbrega, S., Valenzuela, O., Figueras, F., et al. 2013, MNRAS, 432, 2878
- Romero-Gómez et al. (2006) Romero-Gómez, M., Masdemont, J. J., Athanassoula, E., & García-Gómez, C. 2006, A&A, 453, 39
- Romero-Gómez et al. (2007) Romero-Gómez, M., Athanassoula, E., Masdemont, J. J., & García-Gómez, C. 2007, A&A, 472, 63
- Sánchez-Gil et al. (2011) Sánchez-Gil, M. C., Jones, D. H., Pérez, E., et al. 2011, MNRAS, 415, 753
- Sandage & Tammann (1975) Sandage, A., & Tammann, G. A. 1975, ApJ, 196, 313
- Saraiva Schroeder et al. (1994) Saraiva Schroeder, M. F., Pastoriza, M. G., Kepler, S. O., & Puerari, I. 1994, A&AS, 108, 41
- Savchenko (2012) Savchenko, S. S. 2012, Astrophysical Bulletin, 67, 310
- Scarano et al. (2011) Scarano, S., Jr., Lépine, J. R. D., & Marcon-Uchida, M. M. 2011, MNRAS, 412, 1741
- Scarano & Lépine (2013) Scarano, S., & Lépine, J. R. D. 2013, MNRAS, 428, 625
- Schinnerer et al. (2013) Schinnerer, E., Meidt, S. E., Pety, J., et al. 2013, ApJ, 779, 42
- Sellwood (2011) Sellwood, J. A. 2011, MNRAS, 410, 1637
- Sengupta & Balasubramanyam (2006) Sengupta, C., & Balasubramanyam, R. 2006, MNRAS, 369, 360
- Shetty et al. (2007) Shetty, R., Vogel, S. N., Ostriker, E. C., & Teuben, P. J. 2007, ApJ, 665, 1138
- Slyz et al. (2003) Slyz, A. D., Kranz, T., Rix, H.-W. 2003, MNRAS, 346, 1162
- Tilanus et al. (1988) Tilanus, R. P. J., Allen, R. J., van der Hulst, J. M., Crane, P. C., & Kennicutt, R. C. 1988, ApJ, 330, 667
- Tosaki et al. (2002) Tosaki, T., Hasegawa, T., Shioya, Y., Kuno, N., & Matsushita, S. 2002, PASJ, 54, 209
- Tsoutsis et al. (2008) Tsoutsis, P., Efthymiopoulos, C., & Voglis, N. 2008, MNRAS, 387, 1264
- Tsoutsis et al. (2009) Tsoutsis, P., Kalapotharakos, C., Efthymiopoulos, C., & Contopoulos, G. 2009, A&A, 495, 743
- Vogel et al. (1988) Vogel, S. N., Kulkarni, S. R., & Scoville, N. Z. 1988, Nature, 334, 402
- Voglis & Stavropoulos (2006a) Voglis, N., & Stavropoulos, I. 2006a, Recent Advances in Astronomy and Astrophysics, AIP Conference Proceedings, 848, 647
- Voglis et al. (2006b) Voglis, N., Stavropoulos, I., & Kalapotharakos, C. 2006b, MNRAS, 372, 901
- Voglis et al. (2006c) Voglis, N., Tsoutsis, P., & Efthymiopoulos, C. 2006c, MNRAS, 373, 280
- Wada et al. (2011) Wada, K., Baba, J., & Saitoh, T. R. 2011, ApJ, 735, 1
- Walter et al. (2008) Walter, F., Brinks, E., de Blok, W. J. G., et al. 2008, AJ, 136, 2563
- Zahid et al. (2013) Zahid, H. J., Yates, R. M., Kewley, L. J., & Kudritzki, R. P. 2013, ApJ, 763, 92
- Zibetti, Charlot, & Rix (2009) Zibetti, S., Charlot, S., & Rix, H.-W. 2009, MNRAS, 400, 1181