New Detections of Arsenic, Selenium, and Other Heavy Elements
in Two Metal-Poor Stars111
Based on observations made with the NASA/ESA Hubble Space Telescope,
obtained at the Space Telescope Science Institute,
which is operated by the Association of Universities for Research in
Astronomy, Inc., under NASA contract NAS 5-26555.
These observations are associated with programs GO-12268 and GO-12976.
Abstract
We use the Space Telescope Imaging Spectrograph on board the Hubble Space Telescope to obtain new high-quality spectra covering the 1900 2360 Å wavelength range for two metal-poor stars, HD 108317 and HD 128279. We derive abundances of Cu ii, Zn ii, As i, Se i, Mo ii, and Cd ii, which have not been detected previously in either star. Abundances derived for Ge i, Te i, Os ii, and Pt i confirm those derived from lines at longer wavelengths. We also derive upper limits from the non-detection of W ii, Hg ii, Pb ii, and Bi i. The mean [As/Fe] ratio derived from these two stars and five others in the literature is unchanged over the metallicity range 2.8 [Fe/H] 0.6, [As/Fe]0.28 0.14 ( 0.36 dex). The mean [Se/Fe] ratio derived from these two stars and six others in the literature is also constant, [Se/Fe]0.16 0.09 ( 0.26 dex). The As and Se abundances are enhanced relative to a simple extrapolation of the iron-peak abundances to higher masses, suggesting that this mass region (75 82) may be the point at which a different nucleosynthetic mechanism begins to dominate the quasi-equilibrium -rich freezeout of the iron peak. [Cu ii/Cu i]0.56 0.23 in HD 108317 (catalog HD 108317) and HD 128279 (catalog HD 128279), and we infer that lines of Cu i may not be formed in local thermodynamic equilibrium in these stars. The [Zn/Fe], [Mo/Fe], [Cd/Fe], and [Os/Fe] ratios are also derived from neutral and ionized species, and each ratio pair agrees within the mutual uncertainties, which range from 0.15 to 0.52 dex.
Subject headings:
nuclear reactions, nucleosynthesis, abundances — stars: abundances — stars: individual (HD 108317, HD 128279) — stars: Population II1. Introduction
The near ultra-violet (NUV) portion of the spectra of late-type (FGK) stars contains absorption lines of atomic species that are not accessible in the optical or near-infrared domains. In the last two decades, NUV data obtained with the Goddard High Resolution Spectrograph and Space Telescope Imaging Spectrograph (STIS) on board the Hubble Space Telescope (HST) have enabled the first compelling detections of numerous elements heavier than the iron-group in late-type stars that are not chemically stratified. These elements include germanium (Ge, 32), arsenic (As, 33), selenium (Se, 34), cadmium (Cd, 48), tellurium (Te, 52), lutetium (Lu, 71), tantalum (Ta, 73), tungsten (W, 74), rhenium (Re, 75), osmium (Os, 76), platinum (Pt, 78), gold (Au, 79), and bismuth (Bi, 83) (Cowan et al., 1996, 2002, 2005; Sneden et al., 1998, 2003; Roederer et al., 2009, 2010b, 2012a, 2012b; Barbuy et al., 2011; Peterson, 2011; Roederer, 2012; Roederer & Lawler, 2012; Siqueira Mello et al., 2013; Placco et al., 2014). These studies have also detected species not found in the optical domain, such as ionized molybdenum (Mo, 42); placed new upper limits on tin (Sn, 50) and mercury (Hg, 80); and increased the number of useful abundance indicators of zirconium (Zr, 40), iridium (Ir, 77), and lead (Pb, 82). The high signal-to-noise (S/N) and high spectral-resolution requirements for such studies limit HST to observing nearby, NUV-bright stars, so the number of stars where each of these heavy species have been studied rarely exceeds 5.
When found in low-metallicity stars, these elements provide observational constraints on the production of rare, heavy nuclei in the earliest generations of stars. They provide critical evidence to locate the sites and constrain models of heavy-element nucleosynthesis via charged-particle, -process, and -process reactions. For example, in low-metallicity stars the abundance of Ge appears correlated with iron (Fe, 26) (Cowan et al., 2005). Ge behaves like a primary element whose production may be linked with Fe. All previous observations of As and Se, however, only covered one star with [Fe/H] 2 (Roederer, 2012; Roederer & Lawler, 2012). There is no way to evaluate from these data whether As or Se correlate with Fe at low metallicity. Strontium (Sr, 38), the next heaviest element that is readily observable in low-metallicity stars, is not strongly correlated with Fe at low metallicity (e.g., Luck & Bond 1985; McWilliam 1998; Travaglio et al. 2004). In the earliest generations of stars, these observations indicate that the lightest heavy nuclei whose production is decoupled from iron-group nucleosynthesis lie between Ge and Sr, in the mass range 72 88.
These studies also may confirm line identifications by corroborating abundances derived from multiple lines of the same species. The NUV domain of late-type stars exhibits many unidentified absorption lines. Abundances derived from one absorption feature must be confirmed by others to minimize the possibility of misidentification. Barbuy et al. (2011), Roederer & Lawler (2012), and Roederer et al. (2012b) have made progress in this regard, but some detections remain unconfirmed (e.g., Cd i, Te i, Os ii, and Ir ii).
These studies also enable the detection of dominant ionization states (usually first ions) of elements whose minority species are detected in the optical domain. Nickel (Ni, 28), copper (Cu, 29), zinc (Zn, 30), and Mo are prominent examples (Peterson, 2011; Roederer & Lawler, 2012; Wood et al., 2014). These observations provide valuable constraints on possible systematic effects, like over-ionization relative to the local thermodynamic equilibrium (LTE) populations, that could impact the minority species.
HST is currently the only source of high-resolution NUV spectra, so observing targets must be selected with care. Our previous observations (Roederer et al., 2012b) revealed striking similarities between two physically-unrelated metal-poor giants, HD 108317 (catalog HD 108317) and HD 128279 (catalog HD 128279). These stars are first-ascent red giants with effective temperatures ( 5100 K) and surface gravities (log g 2.6 in cgs units) that are identical within their uncertainties. They have nearly identical metallicities ([Fe/H] 2.5) and light-element abundances. In contrast, the abundances of elements heavier than the iron-group in these two stars differ by a factor of 3. Thus the spectra of these two stars are virtually identical except for the strength of lines of heavy elements. This fortuitous combination of characteristics simplifies the process of searching for lines of heavy elements and prompted us to acquire new STIS observations extending farther into the NUV. Here we present these new observations. We report new abundance data for several heavy elements and new constraints on the sources of systematic uncertainty discussed above.
Throughout this paper, we use the standard definitions of elemental abundances and ratios. For element X, the logarithmic abundance is defined as the number of atoms of element X per 1012 hydrogen atoms, (X) . For elements X and Y, the logarithmic abundance ratio relative to the solar ratio of X and Y is defined as [X/Y] . Abundances or ratios denoted with the ionization state indicate the total elemental abundance as derived from that particular ionization state. When reporting relative abundance ratios (e.g., [X/Fe]), these ratios compare neutrals with neutrals and ions with ions when possible.
2. Observations
In program GO-12976, we obtained new STIS observations (Kimble et al., 1998; Woodgate et al., 1998) of HD 108317 (catalog HD 108317) and HD 128279 (catalog HD 128279) using the E230M echelle grating, centered on 1978 Å, and the NUV Multianode Microchannel Array (MAMA) detector. The 006 02 slit yields a 2 pixel resolving power (R ) 30,000. This setup produces wavelength coverage from 1610–2365 Å in a single exposure, although in practice only wavelengths longer than 1900 Å have useful S/N ratios.
A total of 12 individual exposures of HD 108317 (catalog HD 108317) were scheduled over four visits from 2013 May 21 to 2013 July 15, resulting in a total exposure time of 28.6 ks. Fifteen exposures of HD 128279 (catalog HD 128279) were scheduled over three visits from 2013 Jan 22 to 2013 Feb 01, resulting in a total exposure time of 37.4 ks. The standard observational sequence includes acquisition and peak-up images to center the star on the narrow slit. These observations are reduced and calibrated using the calstis pipeline. After co-adding the individual exposures, the spectrum of each star has S/N ratios ranging from 10 pix-1 near 1900 Å to 50 pix-1 near 2100 Å and 100 pix-1 at 2350 Å.
STIS observations of HD 108317 (catalog HD 108317) and HD 128279 (catalog HD 128279) obtained previously in program GO-12268 covered the NUV spectral range from 2280–3115 Å. We co-add those observations with our new observations in the region of overlap. Final S/N ratios in the region from 2280–2365 Å are 130 pix-1.
3. Model atmospheres and stellar parameters
We adopt the same ATLAS9 model atmospheres (Castelli & Kurucz, 2004) used in our previous study. For HD 108317 (catalog HD 108317), , log g, microturbulent velocity (), and metallicity ([M/H]) of the model atmosphere are 5100 200 K, 2.67 0.2, 1.50 0.2 km s-1, and 2.37 0.20, respectively. For HD 128279 (catalog HD 128279), , log g, , and [M/H] are 5080 200 K, 2.57 0.2, 1.60 0.2 km s-1, and 2.46 0.22, respectively.
Here we briefly summarize the methods Roederer et al. (2012b) used to derive these parameters. The Alonso et al. (1999) color-temperature relations were used to calculate an initial estimate for from the dereddened color. The log g values were calculated from these temperatures and Hipparcos parallax measurements, assuming a mass of 0.8 0.1 . Microturbulence velocities were derived by minimizing correlations between line strength and the abundances derived from optical Fe i lines. The initial values were revised to minimize correlations between the excitation potentials (E.P.) and the abundances derived from optical Fe i lines. An analysis of interstellar absorption lines toward each star supported the adjusted values. Revised log g values were calculated accordingly. Finally, the metallicity of the model atmosphere was adopted to be equivalent to the Fe abundance derived from Fe ii lines. These steps were iterated until convergence ( stable within 10 K, log g within 0.01 dex, within 0.05 km s-1, and [M/H] within 0.01 dex).
4. Iron abundance trends with wavelength
In our previous work on HD 108317 (catalog HD 108317) and HD 128279 (catalog HD 128279) (Roederer et al., 2012b), we uncovered evidence that Fe i lines did not yield consistent abundances over the NUV and optical spectral ranges. Specifically, abundances derived from lines with 4000 Å were lower than abundances derived from lines with longer wavelengths. The most severe deficiency in HD 108317 (catalog HD 108317) and HD 128279 (catalog HD 128279) occurred for lines with 3100 3647 Å, as illustrated in Figure 9 of Roederer et al. Subsequent studies by Lawler et al. (2013) and Wood et al. (2013) of NUV and optical Fe i, Ti i, and Ti ii lines revealed similar inconsistencies in the metal-poor subgiant HD 84937 (catalog HD 84937). However, Wood et al. (2014) did not find any such inconsistencies in their analysis of Ni i lines in this star. In an independent analysis of the metal-poor giant BD44 493 (catalog BD+44 493) by Ito et al. (2013; see also Placco et al. 2014), the Fe i lines with 3700 Å yield a mean abundance about 0.15 dex lower than the Fe i lines with 3700 Å, as shown by their Figure 6.

These studies investigated several possible causes of the abundance discrepancies. The wavelength region most severely affected is that around the transition from the Paschen continuum to the Balmer continuum. Roederer et al. (2012b) concluded that a missing source of continuous opacity could account for part of the effect. Lawler et al. (2013) and Wood et al. (2013, 2014) suggested that departures from LTE could also be partly responsible. Missing opacity would impact all species with transitions in the affected wavelength range equally, while non-LTE effects would affect each transition individually, if at all. Ultimately, Roederer et al. adopted an empirical set of wavelength-dependent abundance corrections for all transitions based on the results from Fe i lines.
Our new STIS data extend to even shorter wavelengths. We measure equivalent widths of relatively unblended Fe i and Fe ii lines in our data. All values are adopted from the National Institute of Standards and Technology (NIST) Atomic Spectra Database (ASD; Kramida et al. 2013). This critical compilation assesses the accuracy of these values to be 0.03 to 0.30 dex (grades B to D). The wavelengths, E.P., values, estimated accuracies, and equivalent widths are presented in Table 1.
| HD 108317 | HD 128279 | ||||||||
|---|---|---|---|---|---|---|---|---|---|
| Species | E.P. | NIST | Eq. Wid. | Eq. Wid. | |||||
| (Å) | (eV) | Gradeaa NIST grades correspond to accuracies of 7% (B), 10% (B), 18% (C), 25% (C), 40% (D), and 50% (D). | (mÅ) | (mÅ) | |||||
| Fe i | 2132.02 | 0.00 | 1.33 | C+ | 90.1 | 4.44 | |||
| Fe i | 2145.19 | 0.05 | 1.56 | C | 79.8 | 4.56 | 82.2 | 4.56 | |
| Fe i | 2161.58 | 0.11 | 1.76 | D+ | 83.0 | 4.89 | 86.1 | 4.89 | |
| Fe i | 2176.84 | 0.12 | 1.66 | C+ | 91.4 | 4.90 | |||
| Fe i | 2191.20 | 0.12 | 1.80 | C | 72.0 | 4.65 | 70.0 | 4.51 | |
| Fe i | 2196.04 | 0.11 | 0.59 | C+ | 144.2 | 4.45 | 156.3 | 4.51 | |
| Fe i | 2200.72 | 0.11 | 0.99 | C | 140.2 | 4.79 | |||
| Fe i | 2228.17 | 0.05 | 2.11 | D+ | 81.4 | 5.11 | 79.5 | 5.00 | |
| Fe i | 2259.28 | 0.05 | 2.31 | C | 60.2 | 4.62 | |||
| Fe i | 2259.51 | 0.00 | 1.32 | B+ | 187.4 | 5.32 | |||
| Fe i | 2265.05 | 0.05 | 2.11 | C | 96.3 | 5.38 | 91.0 | 5.24 | |
| Fe i | 2267.08 | 0.05 | 1.75 | B | 91.8 | 4.88 | |||
| Fe i | 2275.19 | 0.11 | 2.32 | D+ | 71.3 | 5.07 | 69.3 | 4.93 | |
| Fe i | 2283.30 | 0.12 | 2.22 | B+ | 92.7 | 5.50 | |||
| Fe i | 2294.41 | 0.11 | 1.54 | B | 83.6 | 4.63 | 86.0 | 4.62 | |
| Fe i | 2297.79 | 0.05 | 1.10 | D+ | 96.7 | 4.37 | 113.3 | 4.56 | |
| Fe i | 2298.66 | 0.11 | 2.42 | C | 82.5 | 5.48 | |||
| Fe i | 2299.22 | 0.09 | 1.55 | C | 76.4 | 4.43 | 85.2 | 4.57 | |
| Fe i | 2309.00 | 0.11 | 1.39 | C | 106.0 | 4.97 | 118.7 | 5.09 | |
| Fe ii | 2122.45 | 1.96 | 2.59 | D+ | 41.2 | 5.06 | 42.4 | 5.00 | |
| Fe ii | 2162.02 | 1.96 | 0.75 | C | 87.2 | 4.90 | 88.7 | 4.85 | |
| Fe ii | 2209.03 | 4.77 | 0.13 | C+ | 28.6 | 4.98 | |||
| Fe ii | 2251.55 | 0.05 | 2.35 | D | 156.8 | 5.03 | 159.9 | 5.00 | |
| Fe ii | 2254.41 | 0.11 | 3.07 | D | 78.0 | 4.83 | |||
| Fe ii | 2260.86 | 0.11 | 2.00 | C+ | 145.4 | 4.84 | 142.6 | 4.75 | |
| Fe ii | 2262.69 | 0.11 | 2.22 | C+ | 126.0 | 4.71 | 134.5 | 4.72 | |
| Fe ii | 2268.56 | 0.12 | 2.73 | C | 104.5 | 5.16 | 103.1 | 5.05 | |
| Fe ii | 2268.82 | 0.05 | 2.61 | C+ | 114.7 | 5.02 | 118.2 | 4.99 | |
| Fe ii | 2351.20 | 2.66 | 0.23 | C+ | 97.2 | 5.23 | 96.0 | 5.14 | |
| Fe ii | 2351.67 | 5.25 | 0.05 | C | 21.3 | 5.14 | |||
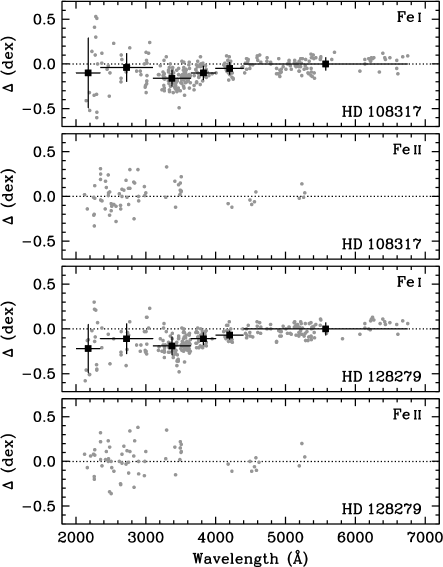
We derive the abundances using a recent version of the line analysis code MOOG (Sneden, 1973) that includes the contribution of Rayleigh scattering from H i in the source function, as discussed by Sobeck et al. (2011). Figure 1 illustrates the abundances derived from lines of Fe i and Fe ii as a function of wavelength. New abundances for lines with 2360 Å are shown, together with the data for lines at longer wavelengths from Roederer et al. (2012b). All abundances in Figure 1 are referenced to the mean Fe abundance derived from lines with 4400 Å. The line-to-line dispersion for Fe i and Fe ii lines at short wavelengths in both stars is significantly larger than for lines at longer wavelengths. The abundance “dip” found by Roederer et al. for lines with 3100 4000 Å exceeds the dispersion of Fe i at these wavelengths. No dip is apparent for Fe ii lines, but the number of lines in the affected region is small.
To eliminate the possibility that uncertainties in the values are a source of this error, we show the line-by-line differential abundances between HD 108317 (catalog HD 108317) and HD 128279 (catalog HD 128279) in Figure 2. For Fe i, the dispersion for lines with 3100 Å, 0.093 dex, is two times larger than the dispersion for lines with 3500 Å, 0.045 dex. For Fe ii, the dispersion for lines with 3100 Å, 0.090 dex, is also several times larger than the dispersion for lines with 3500 Å, 0.034 dex. The S/N ratios are 100 for the STIS, HIRES, and MIKE spectra used from 2350 Å to 6800 Å, and the S/N ratios are 50 from 2100 Å to 2350 Å. This demonstrates the challenge of deriving reliable abundances from crowded regions of spectra. This also suggests the presence of a threshold in abundance precision from being limited by S/N to being limited by line blends, continuum placement, etc. In principle, significantly higher spectral resolution ( 60,000) would help to identify the continuum level and signal the presence of blending lines.
Lacking further information about how to properly treat each species of each element, we follow Roederer et al. (2012b) in adopting a set of wavelength-dependent abundance corrections for all transitions based on the results from Fe i lines. The effect of these corrections is to adopt a local metallicity in hopes of preserving accurate ratios of one element to another. Our adopted corrections are listed in Table 2. For completeness, Table 2 also lists the corrections for longer wavelengths from Table 10 of Roederer et al.
| Wavelength | Std. Dev. | N | Correction | |
|---|---|---|---|---|
| Range (Å) | ||||
| HD 108317 | ||||
| 2360 | 4.87 | 0.39 | 9 | 0.10 |
| 2360–3100 | 4.93 | 0.16 | 32 | 0.04 |
| 3100–3647 | 4.81 | 0.09 | 107 | 0.16 |
| 3647–4000 | 4.87 | 0.08 | 40 | 0.10 |
| 4000–4400 | 4.92 | 0.07 | 27 | 0.05 |
| 4400–6750 | 4.97 | 0.07 | 94 | 0.0 |
| HD 128279 | ||||
| 2360 | 4.80 | 0.27 | 10 | 0.22 |
| 2360–3100 | 4.91 | 0.17 | 28 | 0.11 |
| 3100–3647 | 4.83 | 0.10 | 96 | 0.19 |
| 3647–4000 | 4.91 | 0.07 | 32 | 0.11 |
| 4000–4400 | 4.97 | 0.07 | 19 | 0.05 |
| 4400–6750 | 5.02 | 0.07 | 91 | 0.0 |
5. Heavy element line detection
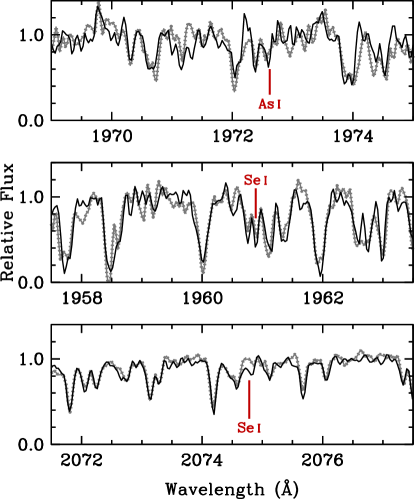
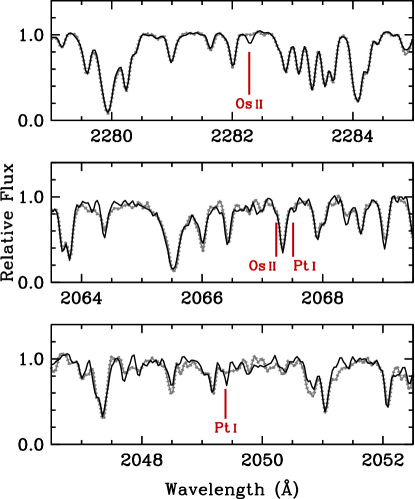
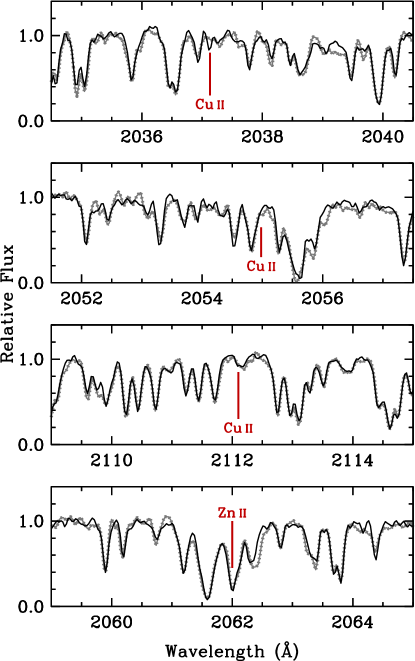
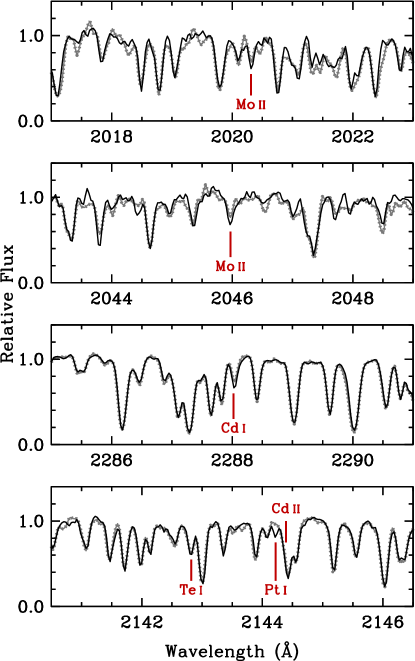
We follow the same approach as Roederer et al. (2012b) to identify reliable abundance indicators of heavy elements in the NUV spectra of HD 108317 (catalog HD 108317) and HD 128279 (catalog HD 128279). We search for transitions reported in recent studies by Peterson (2011), Roederer & Lawler (2012), Roederer et al. (2012b), and Siqueira Mello et al. (2013). We search for leading lines in the NUV that are listed in recent laboratory or theoretical studies of heavy element spectra (Den Hartog et al., 2005; Nilsson et al., 2008). We also overplot the high S/N spectra of HD 108317 (catalog HD 108317) and HD 128279 (catalog HD 128279) and search for significant differences by eye. As demonstrated by Roederer et al. (2012a, b), these differences frequently indicate the presence of heavy element absorption lines in HD 108317 (catalog HD 108317). We then generate a synthetic spectrum for each line. Many candidates are too weak or too blended to yield a secure detection. Figures 3 and 4 illustrate sections of the STIS spectra around 17 lines that are detected in one or both stars.
6. Abundance analysis of heavy elements
The atomic data for lines of interest are listed in Table 6. References and uncertainties for the values are noted. We use MOOG to generate synthetic spectra, and we derive abundances or upper limits by spectrum-synthesis matching. We include hyperfine splitting (hfs) of As i, Cd ii, Yb ii, and Hg ii. Isotope shifts (IS) are included in our syntheses of Cd ii, Yb ii, and Hg ii, and we use the -process isotope mixtures presented by Sneden et al. (2008). The complete hfs and IS line component patterns for these transitions are presented in Tables 4, 8, 10, and 12 of Roederer & Lawler (2012).
| Species | Wavelengthaa Air wavelengths are given for 2000 Å and vacuum values below. | E.P. | () | Ref. | () | () | |
|---|---|---|---|---|---|---|---|
| (Å) | (eV) | HD 108317 | HD 128279 | ||||
| Cu ii | 29 | 2037.13 | 2.83 | 0.23 (0.03) | 1 | 1.48 (0.15) | 1.21 (0.30) |
| Cu ii | 29 | 2054.98 | 2.93 | 0.29 (0.03) | 1 | 1.57 (0.20) | 1.45 (0.30) |
| Cu ii | 29 | 2112.10 | 3.25 | 0.11 (0.10) | 1 | 1.24 (0.20) | 1.42 (0.30) |
| Cu ii | 29 | 2126.04 | 2.83 | 0.23 (0.07) | 1 | 1.39 (0.20) | |
| Zn ii | 30 | 2062.00 | 0.00 | 0.29 (0.04) | 2 | 2.50 (0.30) | 2.38 (0.30) |
| Ge i | 32 | 2041.71 | 0.00 | 0.7 (0.10) | 3 | 0.53 (0.30) | |
| Ge i | 32 | 2065.21 | 0.07 | 0.79 (0.10) | 3 | 0.85 | |
| As i | 33 | 1972.62 | 0.00 | 0.63 (0.05) | 1 | 0.30 (0.40) | 0.49 (0.40) |
| Se i | 34 | 1960.89 | 0.00 | 0.43 (0.08) | 4 | 1.30 (0.40) | 0.57 (0.40) |
| Se i | 34 | 2074.78 | 0.00 | 2.26 (0.03) | 4 | 1.25 (0.40) | 0.53 (0.40) |
| Mo ii | 42 | 2015.11 | 0.00 | 0.49 (0.11) | 5 | 0.74 (0.30) | |
| Mo ii | 42 | 2020.31 | 0.00 | 0.02 (0.10) | 5 | 0.16 (0.30) | 0.51 (0.20) |
| Mo ii | 42 | 2045.97 | 0.00 | 0.35 (0.12) | 5 | 0.18 (0.20) | 0.48 (0.20) |
| Mo ii | 42 | 2660.58 | 1.49 | 0.14 (0.15) | 5 | 0.15 (0.20) | |
| Cd i | 48 | 2288.02 | 0.00 | 0.15 (0.02) | 4 | 1.21 (0.20) | 1.34 (0.30) |
| Cd ii | 48 | 2144.39 | 0.00 | 0.02 (0.02) | 1 | 1.08 (0.30) | 1.30 (0.30) |
| Te i | 52 | 2142.82 | 0.00 | 0.32 (0.08) | 6 | 0.14 (0.30) | 0.04 (0.30) |
| Yb ii | 70 | 2116.68 | 0.00 | 1.34 (0.10) | 1 | 0.50 | 0.98 |
| W ii | 74 | 2088.20 | 0.39 | 0.02 (0.03) | 7 | 0.80 | 0.58 |
| W ii | 74 | 2118.88 | 0.00 | 0.77 (0.05) | 7 | 0.40 | 0.68 |
| Os ii | 76 | 2067.23 | 0.45 | 0.05 (0.03) | 8 | 0.47 (0.30) | 0.38 |
| Os ii | 76 | 2282.28 | 0.00 | 0.05 (0.04) | 9 | 0.83 (0.15) | 1.28 |
| Pt i | 78 | 2049.39 | 0.00 | 0.02 (0.06) | 1 | 0.42 (0.20) | 0.53 |
| Pt i | 78 | 2067.51 | 0.00 | 0.62 (0.03) | 10 | 0.01 (0.30) | 0.02 |
| Pt i | 78 | 2144.21 | 0.00 | 0.37 (0.07) | 11 | 0.37 (0.20) | 0.78 |
| Hg ii | 80 | 1942.27bb The wavelength of this line was incorrectly listed in Table 14 of Roederer & Lawler (2012). The value given here is correct. | 0.00 | 0.40 (0.04) | 1 | 0.30 | 0.53 |
| Pb ii | 82 | 2203.53 | 1.75 | 0.14 (0.10) | 3 | 0.09 | 0.12 |
| Bi i | 83 | 2230.61 | 0.00 | 0.02 (0.06) | 12 | 1.02 |
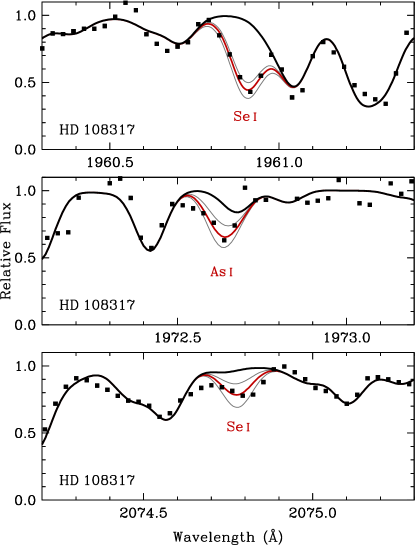
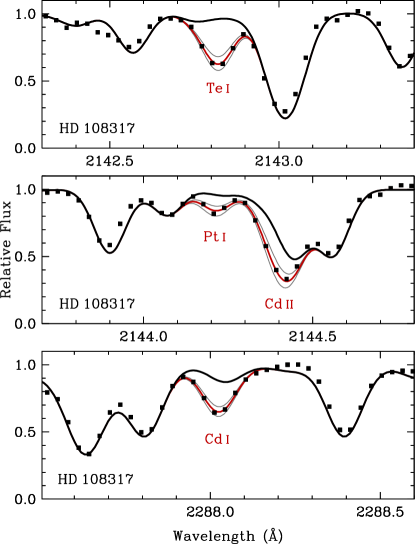
Several examples of key lines of interest in HD 108317 (catalog HD 108317) are illustrated in Figure 5. Our procedure for generating the line lists and producing acceptable matches to the observed spectra is described in detail in Roederer et al. (2012b). We briefly summarize these methods here. There are numerous unidentified lines in NUV spectra of low-metallicity late-type stars, and the transition probabilities for many identified lines are not known with sufficient accuracy to produce acceptable matches between the observed and synthetic spectra without additional effort. Transition probabilities measured by laboratory experiments are used in our syntheses whenever possible. Unidentified lines are fit assuming the absorption arises from Fe i lines with a lower E.P. of 1.5 eV, and we use the observed line profile to constrain the strength of each line. Lines of interest must be distinct from such lines to merit use as abundance indicators.
7. Comments on individual elements
In this section, we discuss the detection of multiple lines as a way to confirm the line identifications for Te, Ir, and Pt. We also discuss the limitations of line identification for Pb and Bi.
7.1. Tellurium
Although two Te i lines have been used as abundance indicators previously, the spectra of the four stars studied by Roederer & Lawler (2012) and Roederer et al. (2012a) did not cover both lines simultaneously in any of these stars. Now, our combined NUV observations of HD 108317 (catalog HD 108317) and HD 128279 (catalog HD 128279) cover both Te i lines (2142 and 2385 Å) in these two stars. The abundances derived from these lines agree for each star. In HD 108317 (catalog HD 108317) the Te i 2142 and 2385 Å lines yield (Te) 0.14 0.30 and 0.02 0.25, and in HD 128279 (catalog HD 128279) these lines yield (Te) 0.04 0.30 and 0.18 0.25. This increases our confidence that both detections are legitimate and that both lines are reliable abundance indicators.
7.2. Iridium
A line of Ir ii at 2126 Å has been used previously by Roederer & Lawler (2012) as an abundance indicator in HD 160617 (catalog HD 160617). This line also appears in our spectra of HD 108317 (catalog HD 108317) and HD 128279 (catalog HD 128279). Its presence in HD 128279 (catalog HD 128279) is surprising, since no absorption lines of the neighboring elements Os or Pt are detected in HD 128279 (catalog HD 128279). If we assume that the absorption at 2126.81 Å in HD 128279 (catalog HD 128279) is due to Ir ii, we derive an Ir abundance (0.3 0.3) that is 1.0 dex higher than the upper limit on Os (1.28) and 0.5 dex higher than the upper limit on Pt (0.78). This suggests that the absorption at 2126.81 Å is probably not due to Ir ii in HD 108317 (catalog HD 108317) or HD 128279 (catalog HD 128279). Instead, this absorption can be fit by increasing the value of the Fe i line at 2126.82 Å. Conservatively, we assume that the absorption detected in HD 160617 (catalog HD 160617) is also not due to Ir ii. The Ir abundances reported in Tables 14 and 15 of Roederer & Lawler should be regarded as upper limits.
7.3. Platinum
Roederer & Lawler (2012) derived Pt abundances from the Pt i 2049.39 and 2067.51 Å lines in HD 160617 (catalog HD 160617), and we also detect these lines in HD 108317 (catalog HD 108317). One new line of Pt i, 2144.21 Å, is also detected in HD 108317 (catalog HD 108317) and listed in Table 6. Den Hartog et al. (2005) measured the radiative lifetime of the upper level of this transition [ (); 46622.489 cm-1]. The 2144.21 Å line is a dominant (68%) decay branch to the ground level ( ). We use these measurements to calculate the value of this line, 0.37 0.07. The abundances derived from all three Pt i lines are in agreement, as shown in Table 6. They are also in agreement with the abundances derived from two Pt i lines at longer wavelengths in HD 108317 (catalog HD 108317), listed in Table 3 of Roederer et al. (2012b).
7.4. Lead
Only a few lines of neutral Pb have been detected in the optical and NUV spectral range, and these are usually blended with other features that complicate attempts to secure a reliable detection. Neutral Pb never comprises more than a few percent of all Pb atoms in the conditions found in late-type stellar atmospheres (Mashonkina et al., 2012; Roederer & Lawler, 2012). Mashonkina et al. investigated the effect of overionization on Pb i lines and presented a set of non-LTE corrections for abundances derived from Pb i lines. For the Pb i 4057 Å line in HD 108317 (catalog HD 108317), their calculations suggest the correction is 0.52 dex.
Ionized Pb is even more elusive. The NIST database lists only eight classified Pb ii transitions from 2000–10000 Å, and only one of these transitions originates from an electronic level below 7 eV. The 2203.53 Å transition connects the upper level to the lower level. It is difficult to estimate the accuracy of the value of this line, which Morton (2000) reports based on calculations by Migdałek (1983).
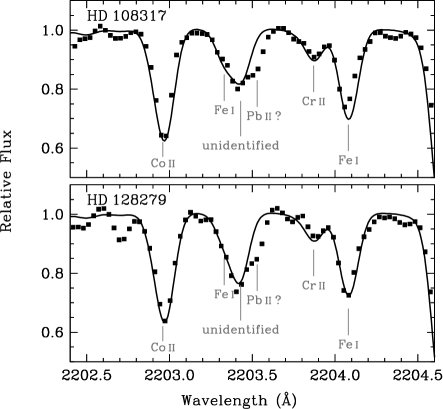
A small amount of absorption is detected at the predicted wavelength of the Pb ii line, 2203.53 Å. As shown in Figure 6, this absorption falls on the red wing of a stronger, unidentified feature with wavelength 2203.44 Å. A weak Fe i line also shows absorption in the blue wing of this unidentified feature. We generate a fictitious line at 2203.44 Å in our synthesis to reproduce the observed line profile in both HD 108317 (catalog HD 108317) and HD 128279 (catalog HD 128279), yet residual absorption at the predicted wavelength of the Pb ii line persists. As shown in Figure 6, this absorption is present in both HD 108317 (catalog HD 108317) and HD 128279 (catalog HD 128279). Roederer et al. (2012b) found that none of the elements at or beyond the 3rd -process peak could be detected in HD 128279 (catalog HD 128279). It would be uncharacteristic of the heavy-element abundance patterns in these two stars if absorption due to Pb ii was of nearly equal strength in each one. There are many unidentified absorption features in the NUV spectra of these two stars, and we suspect that the residual absorption at 2203.53 Å is probably not due to Pb ii in HD 108317 (catalog HD 108317) or HD 128279 (catalog HD 128279). We derive an upper limit on the Pb abundance from this Pb ii line assuming all of the residual absorption is due to Pb ii.
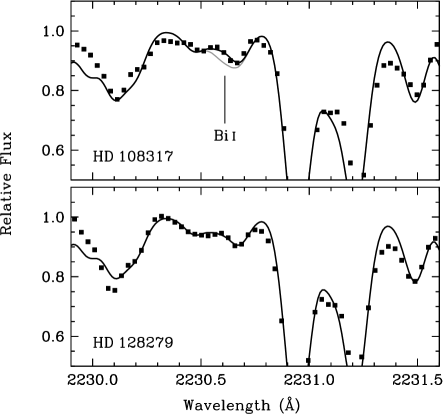
7.5. Bismuth
We derive an upper limit on the Bi abundance from the Bi i resonance line at 2230.61 Å in HD 108317 (catalog HD 108317). As shown in Figure 7, this feature is weak, but Morton (2000) indicates that it should be among the strongest of all Bi i lines in late-type stars. Other species may also contribute to the absorption at this wavelength. To estimate the contribution from Bi i, we employ a technique we have used previously to estimate the absorption due to Au in HD 108317 (catalog HD 108317) (see Appendix A of Roederer et al. 2012b). Since the 3rd -process peak elements are not detected in HD 128279 (catalog HD 128279), we assume that all absorption at this wavelength in HD 128279 (catalog HD 128279) is not due to Bi, and we adjust our line list to fit the observed line profile in HD 128279 (catalog HD 128279). We then use this line list to fit the absorption features in HD 108317 (catalog HD 108317). The fit is not satisfactory, so we cannot state with confidence that the Bi i line is detected. Figure 7 illustrates our derived upper limit.
8. Results
Table 6 lists the abundances or upper limits derived from each line. Table 4 lists the mean abundances or upper limits for each species. The means include lines from other NUV transitions at longer wavelengths, when available. Values in Table 4 supersede those published previously by Roederer et al. (2012a, b).
8.1. Summary of statistical uncertainties
The means in Table 4 are weighted by the statistical uncertainty obtained from the quadrature sum of the fitting uncertainty (Table 6), uncertainty in the values (Table 6), and the uncertainty introduced by the wavelength-dependent corrections (Table 2). The uncertainties in Table 6 reflect fitting uncertainties estimated during the spectrum-synthesis matching. The main sources of error are continuum placement and blending features whose strength cannot be empirically set by fitting the observed line profile. These uncertainties are typically larger than those estimated for optical data.
| HD 108317 | HD 128279 | ||||||||||||
|---|---|---|---|---|---|---|---|---|---|---|---|---|---|
| Species | [X/Fe] | N | [X/Fe] | N | |||||||||
| Cu ii | 29 | 4.19 | 1.42 | 0.40 | 0.22 | 0.28 | 4 | 1.36 | 0.37 | 0.23 | 0.29 | 3 | |
| Zn ii | 30 | 4.56 | 2.50 | 0.31 | 0.49 | 0.52 | 1 | 2.38 | 0.28 | 0.41 | 0.44 | 1 | |
| Ge i | 32 | 3.65 | 0.19 | 0.93 | 0.14 | 0.18 | 4aa The mean abundance or upper limit includes one or more lines from Roederer et al. (2012b) | 0.03 | 1.20 | 0.25 | 0.28 | 3aa The mean abundance or upper limit includes one or more lines from Roederer et al. (2012b) | |
| As i | 33 | 2.30 | 0.30 | 0.07 | 0.56 | 0.57 | 1 | 0.49 | 0.31 | 0.49 | 0.50 | 1 | |
| Se i | 34 | 3.34 | 1.28 | 0.47 | 0.40 | 0.42 | 2 | 0.55 | 0.31 | 0.34 | 0.36 | 2 | |
| Mo ii | 42 | 1.88 | 0.05 | 0.44 | 0.28 | 0.33 | 3 | 0.56 | 0.02 | 0.22 | 0.28 | 3 | |
| Cd i | 48 | 1.71 | 1.21 | 0.39 | 0.44 | 0.46 | 1 | 1.34 | 0.57 | 0.34 | 0.36 | 1 | |
| Cd ii | 48 | 1.71 | 1.08 | 0.42 | 0.49 | 0.52 | 1 | 1.30 | 0.55 | 0.40 | 0.43 | 1 | |
| Te i | 52 | 2.18 | 0.06 | 0.41 | 0.28 | 0.30 | 2aa The mean abundance or upper limit includes one or more lines from Roederer et al. (2012b) | 0.12 | 0.18 | 0.27 | 0.30 | 2aa The mean abundance or upper limit includes one or more lines from Roederer et al. (2012b) | |
| Yb ii | 70 | 0.92 | 1.13 | 0.32 | 0.14 | 0.22 | 1aa The mean abundance or upper limit includes one or more lines from Roederer et al. (2012b) | 1.69 | 0.15 | 0.13 | 0.21 | 1aa The mean abundance or upper limit includes one or more lines from Roederer et al. (2012b) | |
| W ii | 74 | 0.65 | 0.80 | 0.92 | 2 | 0.68 | 1.13 | 2 | |||||
| Os ii | 76 | 1.40 | 0.68 | 0.29 | 0.32 | 0.36 | 2 | 1.28 | 0.22 | 2 | |||
| Pt i | 78 | 1.62 | 0.40 | 0.51 | 0.15 | 0.19 | 5aa The mean abundance or upper limit includes one or more lines from Roederer et al. (2012b) | 0.78 | 0.08 | 5aa The mean abundance or upper limit includes one or more lines from Roederer et al. (2012b) | |||
| Hg ii | 80 | 1.17 | 0.30 | 1.50 | 1 | 0.53 | 1.82 | 1 | |||||
| Pb ii | 82 | 2.04 | 0.09 | 0.42 | 1 | 0.12 | 0.54 | 1 | |||||
| Bi i | 83 | 0.65 | 1.02 | 0.86 | 1 | ||||||||
Note. — The [X/Fe] ratios, where X represents one of the heavy elements of interest, are calculated by comparing neutrals with neutrals and ions with ions.
8.2. Systematic uncertainties
Systematic uncertainties resulting from errors in the model atmosphere parameters have been discussed previously (Cowan et al., 2005), and we adopt their assessment of the uncertainties. This uncertainty amounts to 0.12 dex for lines of neutral species and 0.17 dex for lines of ionized species. These uncertainties are added in quadrature with the statistical errors listed in Table 4 to form the total errors listed there.
We detect multiple transitions of many of the species examined in our study. For Cu ii, Ge i, Se i, Mo ii, Te i, and Pt i, the abundances derived from multiple transitions are in good agreement. These values are listed in Table 6 in the present study and Table 3 of Roederer et al. (2012b).
We detect neutral and singly-ionized states of Cu, Zn, Mo, Cd, and Os. The neutral species of Cu, Zn, and Mo were detected from optical transitions by Roederer et al. (2012b). These abundances are listed in Table 5. The [Zn/Fe], [Mo/Fe], [Cd/Fe], and [Os/Fe] ratios derived from neutral and ionized atoms agree, although the uncertainties are substantial in some cases. Nevertheless, this places limits on the magnitude of overionization or other non-LTE effects that could occur for the transitions studied in these two stars.
| Species | HD 108317 | HD 128279 |
|---|---|---|
| Cu i | 0.96 0.16 | 0.92 0.16 |
| Cu ii | 0.40 0.28 | 0.37 0.29 |
| Zn i | 0.23 0.15 | 0.10 0.15 |
| Zn ii | 0.31 0.52 | 0.28 0.44 |
| Mo i | 0.42 0.19 | 0.07 0.18 |
| Mo ii | 0.44 0.33 | 0.02 0.28 |
| Cd i | 0.39 0.46 | 0.57 0.36 |
| Cd ii | 0.42 0.52 | 0.55 0.43 |
| Os i | 0.63 0.23 | 0.69 |
| Os ii | 0.29 0.36 | 0.22 |
| Pb i | 0.23 | 0.35 |
| Pb ii | 0.42 | 0.54 |
In contrast, the [Cu/Fe] ratio derived from ions is higher than that derived from the neutral species in HD 108317 (catalog HD 108317) and HD 128279 (catalog HD 128279): [Cu ii/Cu i]0.56 0.23. For completeness, we note that Roederer & Lawler (2012) found a difference of 0.29 0.35 dex in the [Cu/Fe] ratios derived from Cu ii and i lines in the warm (5950 K) metal-poor ([Fe/H] 1.8) subgiant HD 160617 (catalog HD 160617). Most Cu atoms are ionized in these stellar atmospheres, so overionization of Cu i relative to the LTE populations could occur. The Cu i abundances in these three stars are derived from the 3247 and 3273 Å resonance lines. Bonifacio et al. (2010) found that these lines did not give consistent results with the Cu i 5105 and 5782 Å lines in dwarfs and giants in two metal-poor globular clusters. Their 3D LTE modeling of the line formation could not fully reconcile the abundances, and it was not apparent which set of lines (if either) could be reliable Cu abundance indicators given the current state of modeling tools. Our results further suggest that Cu i lines may not be formed in LTE, but clearly more work is needed to better understand the formation of Cu lines in cool stars.
Roederer et al. (2012b) discussed the possible discrepancy between the [Os/Fe] ratios derived from Os i and ii lines in HD 108317 (catalog HD 108317): the Os i 3058 Å line yields an abundance ([Os/Fe] 0.63 0.23) higher than that given by the Os ii 2282 Å line ([Os/Fe] 0.14 0.42). Roederer et al. (2010b) reported an abundance difference of 0.34 0.30 dex between the Os i 3058 Å line and the Os ii 2282 Å line in the metal-poor giant BD17 3248 (catalog BD+17 3248). Each difference is not significant given the uncertainties, and other results suggest these differences are not symptoms of systematic uncertainties. Cowan et al. (2005) found that the Os i 3058 Å line gave concordant results with the Os i 2838 and 3301 Å lines ( 0.08 dex) in BD17 3248 (catalog BD+17 3248). Ivarsson et al. (2004) found that the Os ii 2282 Å line also gave concordant results with the Os ii 2067 and 2070 Å lines ( 0.1 dex) in the chemically peculiar star Lupi (catalog chi Lup). The extant data do not indicate systematic differences between the Os abundance indicators, but reducing the statistical uncertainties and examining abundances derived from these lines in additional stars would provide worthwhile checks.
As shown in Table 5, the upper limits on [Pb/Fe] derived from the Pb ii 2203 Å line are slightly higher than the strongest upper limits on [Pb/Fe] derived from the Pb i 2833 Å line (Roederer et al., 2012b). Roederer et al. (2010a) reported a detection of the Pb i 4057 Å line in HD 108317 (catalog HD 108317) based on a higher-quality spectrum taken with the Tull Spectrograph (Tull et al., 1995) on the Smith Telescope at McDonald Observatory. The line is weak, and that detection is tenuous. If it is indeed a detection, however, we would derive [Pb/Fe] 0.1 0.3 using our model atmosphere for HD 108317 (catalog HD 108317). The Mashonkina et al. (2012) non-LTE correction to the Pb abundance derived from the Pb i 4057 Å line implies [Pb/Fe] 0.62 0.3. If the [Pb/Fe] derived in LTE from Pb ii lines (0.42) accurately reflects the Pb abundance, then our upper limit is 0.2 dex lower than the value predicted by the non-LTE corrections. This difference is within the uncertainties, so it does not justify revision of the non-LTE corrections or rejection of the detection.
9. Discussion
9.1. The [As/Fe] and [Se/Fe] ratios
Figure 8 illustrates the [As/Fe] and [Se/Fe] ratios in HD 108317 (catalog HD 108317), HD 128279 (catalog HD 128279), and seven other stars where As and Se have been studied. The data show no compelling evidence for a cosmic dispersion in either [As/Fe] or [Se/Fe]. On average, both ratios are slightly super-solar over the entire metallicity range considered. The mean [As/Fe] and [Se/Fe] ratios are 0.28 0.14 ( 0.36 dex) and 0.16 0.09 ( 0.26 dex), respectively. In these expressions of uncertainties, the former value (e.g., 0.14 dex) is the standard error of the mean, and the latter value (e.g., 0.36 dex) is the sample standard deviation.

Figure 8 also illustrates the [Ge/Fe] ratios in HD 108317 (catalog HD 108317), HD 128279 (catalog HD 128279), and 17 other stars where Ge has been detected. There is relatively little change in the [Ge/Fe] ratio for stars with metallicities in the range 3.1 [Fe/H] 1.4, a fact first noticed by Cowan et al. (2005). That study also noticed that [Ge/Fe] showed no correlation with [Eu/Fe] for the 10 stars in their sample. Cowan et al. concluded that Ge production in the early Galaxy was decoupled from the -process nucleosynthesis responsible for heavy elements, such as europium (Eu, 63).
In contrast with the [As/Fe] and [Se/Fe] ratios, the mean [Ge/Fe] ratio in stars with [Fe/H] 1.4 is 0.91 0.07 ( 0.26 dex). At higher metallicities, the [Ge/Fe] ratio increases toward the solar ratio, whereas [As/Fe] and [Se/Fe] do not show a similar increase. Roederer (2012) tentatively attributed the increase in [Ge/Fe] to the weak component of the -process (see also Pignatari et al. 2010), which does not appear to have contributed noticeable amounts of As or Se to these stars.
9.2. The heavy element abundance patterns
Figure 9 combines our results with those of Roederer et al. (2012b) to illustrate the heavy-element abundance patterns of HD 108317 (catalog HD 108317) and HD 128279 (catalog HD 128279). The Solar System -process and -process patterns (Sneden et al., 2008) are shown as fiducials for comparison. The bottom panels of Figure 9 illustrate the differences between the derived abundances in each star and the solar -process residuals when normalized to Eu. A relatively smooth pattern emerges among the differences in HD 108317 (catalog HD 108317). The Ge, As, and Se (32 34) abundances in HD 108317 (catalog HD 108317) exhibit an upward trend relative to the scaled Solar System -process component. This trend flattens for Sr through Mo (38 42), and the differences then smoothly decrease for Ru through Cd (44 48). There may be a gentle increase from Cd through Ba (48 56), indicated by Te, and possibly extending through Pr ( 59). Otherwise, the abundances of Ba through Lu (56 71) closely follow the scaled Solar System -process pattern. This close correspondence may extend to Os and Pt ( 76 and 78) at the 3rd -process peak. There are several anomalous elements that do not follow this general pattern (Y, 39; Hf, 72; Au, 79), but overall there is a relatively smooth pattern among the differences.
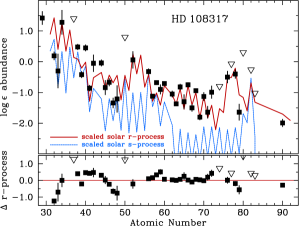
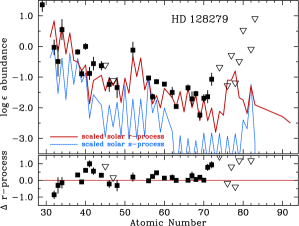
Similar trends are observed in HD 128279 (catalog HD 128279), as shown in Figure 9, but there is more element-to-element scatter obscuring them. The upper limits on Os and Pt at the 3rd -process peak indicate a downturn in the abundances in HD 128279 (catalog HD 128279) relative to the scaled Solar System -process pattern.
9.3. The 2nd -process peak
There is ample observational evidence for the existence of at least two components of -process nucleosynthesis (the so-called main and weak components) operating in the early Galaxy (e.g., McWilliam 1998; Johnson & Bolte 2002; Aoki et al. 2005; Qian & Wasserburg 2008; Hansen et al. 2012). Elements through Cd ( 116) are commonly associated with the weak component, and the consistent -process abundance pattern found for Ba and the rare-earth elements ( 135) is a defining characteristic of the main component.
Te (125 130), an element at the 2nd -process peak, has been detected in four stars: BD17 3248 (catalog BD+17 3248), HD 108317 (catalog HD 108317), HD 128279 (catalog HD 128279), and HD 160617 (catalog HD 160617) (Roederer & Lawler 2012; Roederer et al. 2012a, b; this study). The dispersions among the ratios of Te and lighter elements ([Te/Ru], [Te/Pd], [Te/Ag], and [Te/Cd]) are 0.14, 0.19, 0.08, and 0.28 dex, respectively. The dispersions among the ratios of Te and heavier elements ([Te/Ba], [Te/La], [Te/Ce], and [Te/Nd]) are 0.31, 0.16, 0.12, and 0.13 dex, respectively. There is no obvious preference for smaller dispersions among Te and lighter or heavier element groups, which might be expected if Te was predominantly produced in one of the weak or main components. We interpret these data to indicate that Te owes its nucleosynthesis to conditions intermediate between the main and weak components.
9.4. The 1st -process peak
Figure 9 indicates that the Se abundances in HD 108317 (catalog HD 108317) and HD 128279 (catalog HD 128279) are a good match to the Solar System -process residuals when normalized to Eu. We can estimate the percentage of Se that originated in the main and weak components of the -process. We need to consider only the differential abundance ratios in HD 108317 (catalog HD 108317) and HD 128279 (catalog HD 128279) because the stellar parameters of these two stars are so similar.
We subtract the main component of the -process pattern (given by the star CS 22892–052 (catalog BPS CS 22892-052); Sneden et al. 2003, 2009), normalized to Eu, from both HD 108317 (catalog HD 108317) and HD 128279 (catalog HD 128279). The residual abundance pattern is attributed to the weak component of the -process (cf. Montes et al. 2007). The weak-to-main ratio in HD 108317 (catalog HD 108317) is 3.7 0.5 times greater than in HD 128279 (catalog HD 128279) for elements between the 1st and 2nd -process peaks. The ratio of the Se/Eu abundance ratios in HD 108317 (catalog HD 108317) and HD 128279 (catalog HD 128279) would be low (1.0) if the Se originated only in the main component of -process, and it would be high (3.7) if the Se originated only in the weak component. The observed ratio of the Se/Eu ratios is 1.4. This is compatible with 1.0 but is mildly incompatible with 3.7 0.5, hinting that a portion of the Se could have originated in the main -process. The 1 upper limit of 2.8 on the ratio of Se/Eu ratios translates into a lower limit of the contribution from the main -process to Se of about 12 4%.
Tighter observational uncertainties are the key to constraining this value better and disentangling the weak and main -process contributions to the elements in the 80 mass region. Great effort by experimentalists has provided much of the necessary nuclear data (masses, decay half-lives, and -delayed neutron emission) for each of the isotopes in this mass region relevant for -process nucleosynthesis (e.g., Baruah et al. 2008; Hosmer et al. 2010). Observers must provide a suitable set of observational constraints for -process models that make use of these data. The Solar System -process residuals implicitly include contributions from all processes except for the -process, yet Farouqi et al. (2010) and others have pointed out that the -process residuals in the 90 mass regime are challenging to interpret because several nucleosynthetic processes contribute to them. Alternate template -process patterns for this mass regime are desirable. The abundance pattern for elements with 32 48 in HD 108317 (catalog HD 108317) may present an alternative. The low metallicity of this star indicates that its metals derive from relatively few enrichment events. This star has received no or minimal -process contributions. The detection of Se, an element at the 1st -process peak, in this star is an essential step in the right direction.
9.5. The beginning of nucleosynthesis beyond the iron group
The Ge-As-Se trio of elements has been studied in three metal-poor stars: HD 108317 (catalog HD 108317), HD 128279 (catalog HD 128279), and HD 160617 (catalog HD 160617). Abundances of elements in the iron group have also been reported for these three stars by Roederer & Lawler (2012) and Roederer et al. (2014). These abundances are illustrated in Figure 10. The solar abundances are shown for comparison. Each pattern is normalized to Fe. The dashed lines in Figure 10 trace the abundances of the even-numbered elements in the iron group.
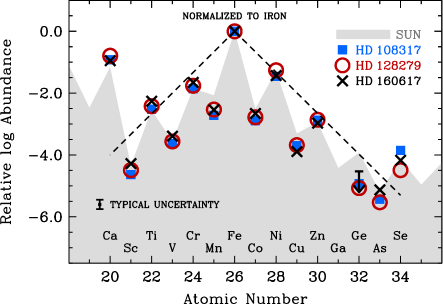
In massive stars, the iron-group elements are formed during explosive 28Si burning, and this produces the familiar shape of the iron peak. At the light end of the iron peak, Ca in the Sun and these three stars is 3 dex more abundant than the simple extrapolation of the even- iron peak abundances would predict for 20. This results from a different, more efficient mechanism of producing 40Ca, -capture on the products of 16O burning. At the heavy end of the iron peak, an extrapolation of the dashed line to elements heavier than Zn reveals that the stellar Ge abundances fall 1 dex lower than the extrapolation, and the stellar Se abundances fall 1 dex higher than the extrapolation These values disagree with the extrapolation by 2.5–3.5 times the abundance uncertainties. Using the Ca overabundance to guide our interpretation of Ge and Se, we speculate that the stellar deficiency of Ge and excess of Se indicate the mass regime (75 82) where a different nucleosynthetic mechanism dominates the quasi-equilibrium -rich freezeout of the iron peak.
In general, -process models predict that these elements are produced by charged-particle reactions, neutron-capture reactions, or both. Both reactions and -rich freezeout produce low-, neutron-deficient isotopes (Fröhlich et al., 2006; Pruet et al., 2006), while neutron-capture reactions produce high-, neutron-rich isotopes (Woosley & Hoffman, 1992; Woosley et al., 1994; Farouqi et al., 2010). The fact that the excess occurs at Se ( 80) may provide a clue to the dominant nucleosynthesis mechanism. Nuclei in this mass region could be the stable descendants of unstable nuclei at the neutron-magic 50 closed shell along the -process path, hinting at an -process origin. Isotopic abundances of Ge and Se would resolve the issue definitively, but measurements of isotopic ratios are not likely to be available in the foreseeable future. Ge and Se have small hfs and IS, making such measurements difficult if not impossible, and in any case the NUV spectroscopic observations that would be required are prohibitively long. Two practical approaches to better understand the astrophysical origins of these nuclei may be to derive elemental abundances from larger samples of stars with diverse heavy-element abundance patterns and to reduce the statistical uncertainties by acquiring higher-quality spectra when possible.
10. Summary
We have obtained new high-resolution, high-S/N NUV spectroscopic observations of the metal-poor giants HD 108317 (catalog HD 108317) and HD 128279 (catalog HD 128279). These observations extend the high-quality spectral coverage of HD 108317 (catalog HD 108317) and HD 128279 (catalog HD 128279) from 2000 Å to nearly 1 m. We have derived new abundances or upper limits from 27 lines of elements with 29 in these stars.
We have derived [Cu/Fe] from both neutral and ionized species, and [Cu ii/Cu i]0.56 0.23 in HD 108317 (catalog HD 108317) and HD 128279 (catalog HD 128279). These data hint that Cu i may not be formed in LTE in these stars. We are not aware of any non-LTE calculations for Cu in late-type stars. We echo the caution issued by Bonifacio et al. (2010) that Cu abundances derived from Cu i lines in metal-poor stars should be treated with caution until such calculations become available.
The [Zn/Fe], [Mo/Fe], [Cd/Fe], and [Os/Fe] ratios have been derived from both neutral and ionized species. In these cases the ratios from neutrals and ions agree within the uncertainties, which span 0.15 to 0.52 dex (see Table 5). These data also corroborate the Ge, Cd, Te, Os, and Pt abundances derived from other lines in HD 108317 (catalog HD 108317) and HD 128279 (catalog HD 128279) (Roederer et al., 2012a, b).
Comparison of the As and Se abundances with those of iron-group elements indicates that the mass region between Ge and Se (75 82) may identify the mass at which a different nucleosynthetic mechanism begins to dominate the quasi-equilibrium -rich freezeout of the iron peak.
The data hint that a portion ( 10%) of the Se could have originated in the main component of the -process. Reducing both the statistical and systematic uncertainties on Se and increasing the sample of stars with precise As and Se measurements should remain high priorities while HST is operational.
References
- Alonso et al. (1999) Alonso, A., Arribas, S., & Martínez-Roger, C. 1999, A&AS, 140, 261
- Aoki et al. (2005) Aoki, W., Honda, S., Beers, T. C., et al. 2005, ApJ, 632, 611
- Barbuy et al. (2011) Barbuy, B., Spite, M., Hill, V., et al. 2011, A&A, 534, A60
- Baruah et al. (2008) Baruah, S., Audi, G., Blaum, K., et al. 2008, Physical Review Letters, 101, 262501
- Bergeson & Lawler (1993) Bergeson, S. D., & Lawler, J. E. 1993, ApJ, 408, 382
- Bisterzo et al. (2011) Bisterzo, S., Gallino, R., Straniero, O., Cristallo, S., & Käppeler, F. 2011, MNRAS, 418, 284
- Bonifacio et al. (2010) Bonifacio, P., Caffau, E., & Ludwig, H.-G. 2010, A&A, 524, A96
- Castelli & Kurucz (2004) Castelli, F., & Kurucz, R. L. 2004, in IAU Symp. 210, Modelling of Stellar Atmospheres, ed. N. Piskunov et al. (Cambridge: Cambridge Univ. Press), A20
- Cowan et al. (1996) Cowan, J. J., Sneden, C., Truran, J. W., & Burris, D. L. 1996, ApJ, 460, L115
- Cowan et al. (2002) Cowan, J. J., Sneden, C., Burles, S., et al. 2002, ApJ, 572, 861
- Cowan et al. (2005) Cowan, J. J., Sneden, C., Beers, T. C., et al. 2005, ApJ, 627, 238
- Den Hartog et al. (2005) Den Hartog, E. A., Herd, M. T., Lawler, J. E., et al. 2005, ApJ, 619, 639
- Farouqi et al. (2010) Farouqi, K., Kratz, K.-L., Pfeiffer, B., et al. 2010, ApJ, 712, 1359
- Fröhlich et al. (2006) Fröhlich, C., Martínez-Pinedo, G., Liebendörfer, M., et al. 2006, Physical Review Letters, 96, 142502
- Hansen et al. (2012) Hansen, C. J., Primas, F., Hartman, H., et al. 2012, A&A, 545, A31
- Hill et al. (2002) Hill, V., Plez, B., Cayrel, R., et al. 2002, A&A, 387, 560
- Hosmer et al. (2010) Hosmer, P., Schatz, H., Aprahamian, A., et al. 2010, Phys. Rev. C, 82, 025806
- Ito et al. (2013) Ito, H., Aoki, W., Beers, T. C., et al. 2013, ApJ, 773, 33
- Ivans et al. (2006) Ivans, I. I., Simmerer, J., Sneden, C., et al. 2006, ApJ, 645, 613
- Ivarsson et al. (2004) Ivarsson, S., Wahlgren, G. M., Dai, Z., Lundberg, H., & Leckrone, D. S. 2004, A&A, 425, 353
- Johnson & Bolte (2002) Johnson, J. A., & Bolte, M. 2002, ApJ, 579, 616
- Kimble et al. (1998) Kimble, R. A., Woodgate, B. E., Bowers, C. W., et al. 1998, ApJ, 492, L83
- Kramida et al. (2013) Kramida, A., Ralchenko, Yu., Reader, J., et al. 2013, NIST Atomic Spectral Database (ver. 4.0–5.1) [online], available: http://physics.nist.gov/asd, National Institute of Standards and Technology, Gaithersburg, MD
- Lawler et al. (2013) Lawler, J. E., Guzman, A., Wood, M. P., Sneden, C., & Cowan, J. J. 2013, ApJS, 205, 11
- Luck & Bond (1985) Luck, R. E., & Bond, H. E. 1985, ApJ, 292, 559
- Mashonkina et al. (2012) Mashonkina, L., Ryabtsev, A., & Frebel, A. 2012, A&A, 540, A98
- McWilliam (1998) McWilliam, A. 1998, AJ, 115, 1640
- Migdałek (1983) Migdałek, J. 1983, J. Quant. Spec. Radiat. Transf., 30, 169
- Montes et al. (2007) Montes, F., Beers, T. C., Cowan, J., et al. 2007, ApJ, 671, 1685
- Morton (2000) Morton, D. C. 2000, ApJS, 130, 403
- Nilsson et al. (2008) Nilsson, H., Engström, L., Lundberg, H., et al. 2008, Europ. Phys. J. D, 49, 13
- Peterson (2011) Peterson, R. C. 2011, ApJ, 742, 21
- Pignatari et al. (2010) Pignatari, M., Gallino, R., Heil, M., et al. 2010, ApJ, 710, 1557
- Placco et al. (2014) Placco, V. M., Beers, T. C., Roederer, I. U., et al. 2014, ApJ, in press (arXiv:1406.0538)
- Pruet et al. (2006) Pruet, J., Hoffman, R. D., Woosley, S. E., Janka, H.-T., & Buras, R. 2006, ApJ, 644, 1028
- Qian & Wasserburg (2008) Qian, Y.-Z., & Wasserburg, G. J. 2008, ApJ, 687, 272
- Quinet et al. (2006) Quinet, P., Palmeri, P., Biémont, É., et al. 2006, A&A, 448, 1207
- Roederer et al. (2009) Roederer, I. U., Kratz, K.-L., Frebel, A., et al. 2009, ApJ, 698, 1963
- Roederer et al. (2010a) Roederer, I. U., Cowan, J. J., Karakas, A. I., et al. 2010a, ApJ, 724, 975
- Roederer et al. (2010b) Roederer, I. U., Sneden, C., Lawler, J. E., & Cowan, J. J. 2010b, ApJ, 714, L123
- Roederer (2012) Roederer, I. U. 2012, ApJ, 756, 36
- Roederer & Lawler (2012) Roederer, I. U., & Lawler, J. E. 2012, ApJ, 750, 76
- Roederer et al. (2012a) Roederer, I. U., Lawler, J. E., Cowan, J. J., et al. 2012a, ApJ, 747, L8
- Roederer et al. (2012b) Roederer, I. U., Lawler, J. E., Sobeck, J. S., et al. 2012b, ApJS, 203, 27
- Roederer et al. (2014) Roederer, I. U., Preston, G. W., Thompson, I. B., et al. 2014, AJ, 147, 136
- Sikström et al. (2001) Sikström, C. M., Pihlemark, H., Nilsson, H., et al. 2001, Journal of Physics B Atomic Molecular Physics, 34, 477
- Siqueira Mello et al. (2013) Siqueira Mello, C., Spite, M., Barbuy, B., et al. 2013, A&A, 550, A122
- Sneden (1973) Sneden, C. A. 1973, Ph.D. Thesis, Univ. of Texas at Austin
- Sneden et al. (1998) Sneden, C., Cowan, J. J., Burris, D. L., & Truran, J. W. 1998, ApJ, 496, 235
- Sneden et al. (2003) Sneden, C., Cowan, J. J., Lawler, J. E., et al. 2003, ApJ, 591, 936
- Sneden et al. (2008) Sneden, C., Cowan, J. J., & Gallino, R. 2008, ARA&A, 46, 241
- Sneden et al. (2009) Sneden, C., Lawler, J. E., Cowan, J. J., Ivans, I. I., & Den Hartog, E. A. 2009, ApJS, 182, 80
- Sobeck et al. (2011) Sobeck, J. S., Kraft, R. P., Sneden, C., et al. 2011, AJ, 141, 175
- Travaglio et al. (2004) Travaglio, C., Gallino, R., Arnone, E., et al. 2004, ApJ, 601, 864
- Tull et al. (1995) Tull, R. G., MacQueen, P. J., Sneden, C., & Lambert, D. L. 1995, PASP, 107, 251
- Wood et al. (2013) Wood, M. P., Lawler, J. E., Sneden, C., & Cowan, J. J. 2013, ApJS, 208, 27
- Wood et al. (2014) Wood, M. P., Lawler, J. E., Sneden, C., & Cowan, J. J. 2014, ApJS, 211, 20
- Woodgate et al. (1998) Woodgate, B. E., Kimble, R. A., Bowers, C. W., et al. 1998, PASP, 110, 1183
- Woosley & Hoffman (1992) Woosley, S. E., & Hoffman, R. D. 1992, ApJ, 395, 202
- Woosley et al. (1994) Woosley, S. E., Wilson, J. R., Mathews, G. J., Hoffman, R. D., & Meyer, B. S. 1994, ApJ, 433, 229