Near-infrared spectroscopy of 20 new Chandra sources in the Norma Arm
We report on CTIO/NEWFIRM and CTIO/OSIRIS photometric and spectroscopic observations of 20 new X-ray (0.5–10 keV) emitters discovered in the Norma Arm Region Chandra Survey (NARCS). NEWFIRM photometry was obtained to pinpoint the near-infrared counterparts of NARCS sources, while OSIRIS spectroscopy was used to help identify 20 sources with possible high mass X-ray binary properties. We find that (1) two sources are WN8 Wolf-Rayet stars, maybe in colliding wind binaries, part of the massive star cluster Mercer 81; (2) two are emission-line stars, possibly in X-ray binaries, that exhibit near- and mid-infrared excesses either due to free-free emission from the decretion discs of Be stars or warm dust in the stellar winds of peculiar massive stars such as B[e] supergiants or luminous blue variables; (3) one is a B8-A3 IV-V star that could be in a quiescent high mass X-ray binary system; (4) two are cataclysmic variables including one intermediate polar; (5) three may be neutron star symbiotic binaries; (6) five are most likely white dwarf symbiotic binaries; and (7) five exhibit properties more consistent with isolated giant/dwarf stars. The possible detection of one to three high mass X-ray binaries is in good agreement with our predictions. However, our study illustrates the difficulty of clearly differentiating quiescent or intermediate X-ray luminosity systems from isolated massive stars, which may lead to an underestimation of the number of known high mass X-ray binaries.
Key Words.:
X-rays: binaries Infrared: stars stars: massive stars: low-mass techniques: spectroscopic surveys1 Introduction
The arms of spiral galaxies have long been known to be regions of intense stellar formation, a consequence of the formation of the galaxies themselves. For instance, Lin & Shu (1964) and Lin et al. (1969) proposed, in the framework of the density wave theory, that spiral arms are formed through the propagation of linear discontinuities of the average Galactic gravitational field, which enhances their local density. When fast-rotating clouds of gas and dust encounter a slower density wave, their intrinsic density may therefore increase such that they meet the Jeans criterion and collapse, triggering star formation. Even though this explanation is still controversial, it is at least observationally clear that giant molecular clouds (GMCs) and HII regions are preferentially located in the arms of the Milky Way (Caswell & Haynes, 1987; Dame et al., 2001), where the number of short-lived O/B massive stars is consequently very high. Interestingly, Sana et al. (2012) showed that at least 70% of massive stars interact with a nearby massive companion or, in other words, that most O/B stars are found in binary systems. Even if the authors argue that a third of them will end up in binary mergers, a significant population of high mass X-ray binaries (HMXBs), consisting of a neutron star (NS) or a black hole (BH) accreting from a massive O/B star, must therefore be distributed in the spiral arms of the Milky Way, a statement supported by two recent studies reported in Bodaghee et al. (2012) and Coleiro & Chaty (2013).
The last decade has seen a renewed scientific interest in HMXBs, following the launch of the INTErnational Gamma-Ray Astrophysics Laboratory (INTEGRAL, Winkler et al., 2003) in October 2002. Indeed, INTEGRAL performed a 20-100 keV survey of the Galactic plane which led to the detection of more than 700 hard X-ray sources (Bird et al., 2010), including about 400 new or previously poorly studied INTEGRAL Gamma-Ray (IGR) sources. The subsequent multiwavelength follow-ups (see e.g. Tomsick et al., 2008; Chaty et al., 2008; Rahoui et al., 2008; Rahoui & Chaty, 2008; Tomsick et al., 2012; Coleiro et al., 2013) showed that a significant fraction of these new sources were actually HMXBs in which a NS fed on the stellar winds of a blue supergiant through Bondi-Hoyle processes, known as NS-supergiant X-ray binaries (NS-SGXBs). Not only did these results increase the fraction of NS-SGXBs from 10% of all known HMXBs to about 40% today, but these new NS-SGXBs also appear to exhibit extreme behaviours that were not predicted. Indeed, some are very obscured persistent sources suffering from a huge intrinsic extinction, with as high as atoms cm-2 (such as IGR J163184848, Matt & Guainazzi, 2003), and others are transient sources, completely undetectable in quiescence but randomly exhibiting X-ray flares that can be as bright as the Crab nebula for time periods as short as a few hours; these are the so-called supergiant fast X-ray transients (SFXTs; Negueruela et al., 2006).
Although the origins of such properties are still a matter of debate (accretion from clumps of material in the stellar wind or magnetic barrier, see e.g. Walter & Zurita Heras, 2007; Bozzo et al., 2008), these NS-SGXBs have opened up a new window on HMXB evolution and, as progenitors of NS-NS and NS-BH binaries, the formation of short gamma-ray bursts. Discovering and studying as many of them as possible is therefore crucial and the Norma arm, as the most active star-forming region in the Milky Way, is the best candidate for this purpose. In 2011, we therefore performed a Chandra ACIS survey of a 08 area of the Norma arm to detect new keV sources with hard X-ray spectra, in particular low luminosity HMXBs fainter than the erg s-1 minimum level usually encountered (see Reig, 2011, for a recent review). The results of the NARCS survey are comprehensively presented in Fornasini et al. (2014) and we refer to that work for more details. In this paper, we report on the near-infrared (near-IR) photometric and spectroscopic observations which were carried out to pinpoint the near-IR counterparts of the newly discovered hard X-ray sources and identify those we believed to be HMXB candidates. Section 2 describes the data and the reduction process. The results are presented in Section 3. We discuss them and conclude in Section 4.
 |
 |
 |
 |
 |
 |
 |
 |
 |
 |
 |
 |
 |
 |
 |
 |
 |
 |
 |
 |
2 Observations
To optimize the detection of new HMXBs, our Chandra survey of the Norma arm was complemented with a near-IR photometric mapping of the same region, followed by near-IR spectroscopy of the most promising counterparts. The latter were selected and ranked on the basis of their fulfillment of six criteria: (1) X-ray brightness high enough to place good constraints on the source’s X-ray spectral parameters; (2) a high column density ( atoms cm-2) to exclude foreground sources; (3) a hard X-ray spectrum with a photon index , which is typical for HMXBs; (4) X-ray variability, which is often seen in HMXBs; (5) a counterpart with J-K colour , indicating that it is also subject to significant absorption; and (6) the reliability of the near-IR counterpart.
Allocating 0, 0.5, or 1 when a criterium was not met, partially met, or fully met, respectively, the number of criteria fulfilled ranged from 1.5 to 6 for the selected sources. The column density and X-ray photon index of the sources were measured through X-ray spectral fitting of the Chandra spectra (averaged when a source was present in several pointings) with XSPEC (Arnaud, 1996). We principally made use of the absorbed power-law model tbabspegpwlw although, when a spectrum was found to be very soft (), a thermal plasma model tbabsvapec was also used to obtain a reliable estimate of the flux. Furthermore, to investigate the presence of an intrinsic component of absorption, we also measured the total Galactic column density along the line of sight (LOS) of each source using the relation =(ISM)+2(ISM). We assessed the neutral hydrogen column density (ISM) from the Leiden/Argentine/Bonn Survey (Kalberla et al., 2005). In addition, the molecular hydrogen column density (ISM) was estimated from the MWA CO survey (Bronfman et al., 1989) using the factor derived in Dame et al. (2001).
Finally, the reliabilities of the near-IR counterparts of the Chandra sources were estimated following the analytic treatment introduced in Sutherland & Saunders (1992), which is based on the positional uncertainties of the X-ray and near-IR positions, the distances between the X-ray and near-IR counterparts, and the density of near-IR sources in the vicinity of the X-ray positions. In this framework, is the probability for a near-IR source of being the real counterpart of an X-ray source. Summing up all the values, we therefore expect about 0.4 spurious X-ray/near-IR associations in our sample.
2.1 Near-infrared photometry
| No. | IAU name | Quantile group | RA (J2000) | DEC (J2000) | (ISM) | (X-ray) | ||||
|---|---|---|---|---|---|---|---|---|---|---|
| CXOU J | (hms) | (dms) | (cm-2) | ( cm-2) | keV | ( cgs) | ||||
| 38 | 163329.5-473332 | D | 16 33 29.58 | -47 33 32.8 | 5.9 | – | 3.05 | 0.994 | ||
| 78 | 163355.1-473804 | D | 16 33 55.11 | -47 38 04.9 | 7.0 | – | 10.0 | 0.994 | ||
| 158 | 163443.0-472603 | C/D | 16 34 43.05 | -47 26 03.3 | 7.0 | – | 0.71 | 0.990 | ||
| 239 | 163515.1-472304 | D | 16 35 15.19 | -47 23 04.0 | 8.9 | – | 0.78 | 0.989 | ||
| 396 | 163553.5-470037 | D/E | 16 35 53.52 | -47 00 37.1 | 4.9 | – | 1.26 | 0.898 | ||
| 437 | 163607.0-471434 | C | 16 36 07.03 | -47 14 34.8 | 8.4 | – | 0.58 | 0.984 | ||
| 694 | 163734.1-464630 | A/B | 16 37 34.11 | -46 46 30.1 | 7.7 | – | 0.50 | 0.983 | ||
| 750 | 163750.8-465545 | B | 16 37 50.82 | -46 55 45.3 | 9.4 | – | 10.3 | 0.989 | ||
| 881 | 163832.2-470339 | C | 16 38 32.20 | -47 03 39.2 | 8.5 | – | 2.19 | 0.883 | ||
| 1059 | 163925.7-465303 | A | 16 39 25.73 | -46 53 03.6 | 8.0 | – | 0.88 | 0.989 | ||
| 1128 | 163944.3-465614 | C | 16 39 44.39 | -46 56 14.9 | 6.4 | – | 3.82 | 0.994 | ||
| 1168 | 163955.2-463145 | B | 16 39 55.25 | -46 31 45.8 | 6.2 | – | 1.19 | 0.986 | ||
| 1203 | 164002.4-463200 | B | 16 40 02.43 | -46 32 00.6 | 6.2 | – | 1.51 | 0.981 | ||
| 1278 | 164029.4-462328 | D/E | 16 40 28.97 | -46 23 27.6 | 7.8 | – | 1.18 | 0.986 | ||
| 1279 | 164029.5-462329 | D/E | 16 40 29.68 | -46 23 29.2 | 7.8 | – | 2.89 | 0.986 | ||
| 1326 | 164045.5-464607 | D | 16 40 45.54 | -46 46 07.1 | 7.3 | – | 0.79 | 0.991 | ||
| 1358 | 164105.5-465108 | A/B | 16 41 05.54 | -46 51 08.4 | 6.0 | – | 1.28 | 0.993 | ||
| 1374 | 164122.8-464529 | A/B | 16 41 22.87 | -46 45 29.4 | 6.8 | – | 2.45 | 0.991 | ||
| 1379 | 164130.8-463048 | A/B | 16 41 30.88 | -46 30 48.8 | 7.0 | – | 4.10 | 0.982 | ||
| 1408 | 164204.5-464341 | D/E | 16 42 04.59 | -46 43 41.3 | 6.3 | – | 1.71 | 0.983 |
| NEWFIRM | VVV | |||||||||
|---|---|---|---|---|---|---|---|---|---|---|
| No. | VVV ID. | Dist. | ||||||||
| (mag) | (mag) | (mag) | (″) | (mag) | (mag) | (mag) | (mag) | (mag) | ||
| 38 | 15.290.07 | 11.920.10 | 10.130.06 | 515727245968 | 0.12 | – | 19.330.15 | 15.210.01 | 11.990.01 | Sat. |
| 78 | 16.430.07 | 15.450.10 | 14.990.09 | 515726911773 | 0.06 | 17.020.01 | 16.740.02 | 16.460.01 | 15.770.04 | 15.380.02 |
| 158 | 12.960.03 | 11.390.05 | 10.580.05 | 515727009565 | 0.06 | 16.440.01 | 14.880.01 | 12.960.01 | 11.300.01 | 10.580.01 |
| 239 | 15.740.07 | 13.600.08 | 12.120.06 | 515720865399 | 0.13 | – | 18.420.08 | 15.650.01 | 13.480.01 | 12.160.01 |
| 396 | 15.480.05 | 13.180.10 | 11.990.07 | 515720906266 | 0.96 | – | 18.160.06 | 15.490.01 | 13.190.01 | 12.190.01 |
| 437 | 14.510.04 | 12.850.06 | 12.010.08 | 515720093751 | 0.42 | 17.530.02 | 15.970.01 | 14.310.01 | 12.820.01 | 12.000.01 |
| 694 | 12.530.05 | 11.750.07 | 10.260.06 | 515720390344 | 0.44 | 13.560.01 | 13.170.01 | 13.290.01 | 12.700.01 | 12.260.01 |
| 750 | No Cov. | No Cov. | No Cov. | 515720338856 | 0.22 | 15.080.01 | 15.060.01 | 14.910.01 | 14.640.01 | 14.270.01 |
| 881 | No Cov. | No Cov. | No Cov. | 515725172945 | 0.66 | Sat. | Sat. | Sat. | Sat. | Sat. |
| 1059 | No Cov. | No Cov. | No Cov. | 515725290815 | 0.30 | Sat. | Sat. | Sat. | Sat. | Sat. |
| 1128 | No Cov. | No Cov. | No Cov. | 515725286315 | 0.08 | 14.710.01 | 13.630.01 | 12.530.01 | 11.480.01 | 10.760.01 |
| 1168 | No Cov. | No Cov. | No Cov. | 515720689720 | 0.26 | 12.750.01 | 12.630.01 | 12.230.01 | 12.140.01 | 11.830.01 |
| 1203 | No Cov. | No Cov. | No Cov. | 515720696577 | 0.38 | Sat. | Sat. | Sat. | Sat. | Sat. |
| 1278 | No Cov. | No Cov. | No Cov. | 515721533405 | 0.18 | – | – | 17.720.06 | 13.610.01 | 11.260.01 |
| 1279 | No Cov. | No Cov. | No Cov. | 515721039612 | 0.30 | – | – | 16.020.01 | 12.190.04 | Sat. |
| 1326 | No Cov. | No Cov. | No Cov. | 515725424702 | 0.20 | 17.590.02 | 16.280.01 | 14.560.01 | 12.710.01 | 11.480.01 |
| 1358 | No Cov. | No Cov. | No Cov. | 515725732674 | 0.13 | Sat. | 11.450.01 | 10.960.01 | 10.460.01 | 10.180.01 |
| 1374 | No Cov. | No Cov. | No Cov. | 515725467960 | 0.17 | 14.270.01 | 13.840.01 | 13.360.01 | 12.560.01 | 12.380.01 |
| 1379 | No Cov. | No Cov. | No Cov. | 515725581165 | 0.38 | Sat. | Sat. | Sat. | Sat. | Sat. |
| 1408 | No Cov. | No Cov. | No Cov. | 515725521664 | 0.41 | Sat. | Sat. | Sat. | Sat. | Sat. |
| 2MASS | DENIS | |||||||||
| No. | IAU name | Dist. | IAU name | Dist. | ||||||
| 2MASS J | (″) | (mag) | (mag) | (mag) | DENIS J | (″) | (mag) | (mag) | (mag) | |
| 38 | 16332956-4733327 | 0.14 | 15.260.04 | 11.750.03 | 9.990.022 | 163329.6-473332 | 0.29 | – | 15.300.15 | 10.010.05 |
| 78 | – | – | – | – | – | – | – | – | – | – |
| 158 | 16344306-4726033 | 0.17 | 12.630.03 | 11.260.02 | 10.540.02 | 163443.0-472603 | 0.31 | 17.380.18 | 12.970.07 | 10.540.06 |
| 239 | 16351519-4723042 | 0.25 | ¿15.97 | ¿13.77 | 12.270.04 | – | – | – | – | – |
| 396 | 16355350-4700381 | 1.02 | ¿15.69 | 13.300.03 | 12.200.03 | – | – | – | – | – |
| 437 | – | – | – | – | – | 163607.0-471434 | 0.45 | – | 14.540.11 | 12.040.10 |
| 694 | 16373414-4646299 | 0.40 | 12.960.04 | 12.150.03 | 11.890.04 | 163734.1-464630 | 0.16 | 14.020.11 | 12.590.12 | 11.500.12 |
| 750 | 16375079-4655452 | 0.26 | 14.690.03 | 14.570.06 | ¿15.19 | 163750.7-465545 | 0.54 | 14.660.11 | 14.300.15 | – |
| 881 | 16383217-4703397 | 0.68 | 6.890.02 | 5.440.04 | 4.720.02 | 163832.1-470339 | 0.50 | 11.070.03 | 6.380.09 | 3.870.16 |
| 1059 | 16392581-4653002 | 3.50 | 9.300.02 | 8.690.03 | 8.430.02 | 163925.7-465300 | 3.05 | 0.650.03 | 9.320.07 | 8.490.05 |
| 1128 | 16394439-4656149 | 0.09 | 12.420.02 | 11.260.02 | 10.860.02 | 163944.3-465614 | 0.13 | 15.400.05 | 12.410.07 | 10.770.07 |
| 1168 | 16395525-4631454 | 0.27 | 12.220.03 | 11.970.06 | 11.830.04 | 163955.2-463145 | 0.24 | 12.910.02 | 12.300.08 | 11.680.09 |
| 1203 | 16400244-4632002 | 0.40 | 9.600.02 | 8.840.02 | 8.510.02 | 164002.4-463200 | 0.38 | 11.190.02 | 9.590.06 | 8.46 0.05 |
| 1278 | 16402896-4623276 | 0.04 | ¿15.68 | 13.630.12 | 11.290.07 | 164029.0-462327 | 1.28 | 17.830.17 | – | 11.130.08 |
| 1279 | 16402966-4623295 | 0.36 | ¿15.16 | ¿11.48 | 9.840.05 | 164029.6-462329 | 0.75 | – | 15.810.23 | 9.690.06 |
| 1326 | 16404554-4646072 | 0.14 | 14.550.04 | 12.730.04 | 11.600.04 | 164045.5-464607 | 0.46 | – | 14.420.11 | 11.730.08 |
| 1358 | 16410554-4651085 | 0.15 | 11.040.03 | 10.390.02 | 10.160.02 | 164105.5-465108 | 0.18 | 12.220.02 | 11.070.07 | 10.130.06 |
| 1374 | 16412285-4645292 | 0.25 | 13.340.02 | 12.570.02 | 12.330.03 | 164122.8-464529 | 0.24 | 14.770.04 | 13.440.10 | 12.270.11 |
| 1379 | 16413093-4630488 | 0.48 | 9.760.02 | 9.300.02 | 9.130.02 | 164130.9-463048 | 0.33 | 10.550.03 | 9.830.06 | 9.140.05 |
| 1408 | 16420462-4643411 | 0.41 | 8.240.03 | 6.730.04 | 5.870.03 | 164204.6-464341 | 0.33 | 14.130.04 | 8.530.08 | 6.010.03 |
| GLIMPSE | WISE | |||||||||||
|---|---|---|---|---|---|---|---|---|---|---|---|---|
| No. | IAU Name | Dist. | IAU Name | Dist. | ||||||||
| (″) | (mJy) | (mJy) | (mJy) | (mJy) | WISE J | (″) | (mJy) | (mJy) | (mJy) | (mJy) | ||
| 38 | G336.7280+00.2037 | 0.28 | 85.795.25 | 53.952.36 | 54.592.46 | 26.232.19 | 163329.53-473331.8 | 1.09 | 80.442.07 | 64.351.48 | – | – |
| 78 | – | – | – | – | – | – | – | – | – | – | – | – |
| 158 | G336.9601+00.1363 | 0.18 | 27.931.17 | 17.880.98 | 12.760.71 | 7.800.42 | 163443.04-472603.7 | 0.43 | 29.560.92 | 16.750.86 | – | – |
| 239 | G337.0580+00.1032 | 0.14 | 13.020.58 | 11.950.62 | 10.510.50 | – | – | – | – | – | – | – |
| 396 | G337.4072+00.2754 | 0.15 | 8.210.20 | 5.250.30 | 4.860.22 | – | – | – | – | – | – | – |
| 437 | G337.2613+00.0906 | 0.30 | 6.470.49 | 4.540.46 | 2.560.38 | – | – | – | – | – | – | – |
| 694 | G337.7742+00.2214 | 0.10 | 7.200.27 | 4.590.26 | 3.080.25 | – | – | – | – | – | – | – |
| 750 | – | – | – | – | – | – | – | – | – | – | – | – |
| 881 | G337.6719-00.0926 | 0.21 | 4486378 | 2552114 | 242040 | 134823 | 163832.16-470339.7 | 0.11 | ||||
| 1059 | G337.9058-00.0881 | 1.31 | 163925.74-465303.2 | 3.11 | ||||||||
| 1128 | G338.2265+00.0846 | 0.15 | 18.680.08 | 11.150.04 | 8.100.03 | 5.200.03 | 163944.37-465615.0 | 0.22 | 12.910.02 | 7.310.41 | – | – |
| 1168 | G337.9008-00.1634 | 0.20 | 5.920.37 | 4.110.34 | 2.230.27 | – | – | – | – | – | – | – |
| 1203 | G338.2371+00.0665 | 0.20 | 164002.45-463159.9 | 0.31 | – | |||||||
| 1278 | G338.3941+00.1040 | 0.21 | 36.242.68 | 47.313.37 | 36.512.28 | 2.031.43 | – | – | – | – | – | – |
| 1279 | G338.3951+00.1022 | 0.46 | – | – | – | – | – | – | ||||
| 1326 | G338.1427-00.1817 | 0.15 | 16.190.69 | 15.670.56 | 13.860.70 | 6.760.36 | – | – | – | – | – | – |
| 1358 | G338.1178-00.2799 | 0.21 | 26.302.28 | 17.620.64 | 12.130.70 | 6.570.17 | 164105.56-465108.5 | 0.13 | 28.490.76 | 15.150.44 | – | – |
| 1374 | G338.2212-00.2546 | 0.33 | 4.250.28 | 2.260.31 | – | 2.510.52 | – | – | – | – | – | – |
| 1379 | G338.4200-00.1104 | 0.23 | 60.682.85 | 37.251.75 | 27.721.13 | 16.730.64 | 164130.91-463048.9 | 0.27 | 72.891.81 | 39.821.02 | – | – |
| 1408 | G338.3224-00.3244 | 0.16 | 164204.62-464341.1 | 0.04 | ||||||||
We performed the observations on 2011 July 19 with the NOAO Extremely Wide Field Infrared Mosaic (NEWFIRM) mounted on the 4 m Blanco telescope at the Cerro Tololo Inter-America Observatory (CTIO). Each NEWFIRM image is divided into four extensions and covers a 28′28′ field of view with a 04 plate scale; this allowed us to observe about 60% of the 08 Norma region mapped with Chandra in the , , and bands. For each pointing, the exposure time in each filter was set to 150 s divided into ten dithered four-extension frames for median sky construction. Conditions were clear and the seeing was less than 12 during the whole night.
We reduced the data with the dedicated IRAF (Tody, 1993) package nfextern. It is composed of several routines that perform the common tasks for near-IR imaging, tailored for wide-field mosaics. The first-pass reduction consisted in bad pixel removal, dark subtraction, linearity correction, flatfielding, and median sky subtraction. The astrometry of each cleaned four-extension frame was calibrated to the World Coordinate System (WCS) by deriving the astrometric transformations through comparison with the 2 Micron All Sky Survey catalogue (2MASS, Skrutskie et al., 2006). The four extensions were then combined into a single image before median stacking. We finally flux-calibrated all the images by deriving the photometric solutions (zero-point magnitudes, atmospheric extinction, and colour terms) through relative photometry using the 2MASS catalogue as a reference. While not as robust as the use of photometric standard stars, we estimate that the measured magnitudes are accurate to about 0.1 mag in each filter, although statistical errors are lower.
As already mentioned, our NEWFIRM observations covered roughly 60% of the Chandra field. We completed and complemented the near-IR survey using the Vista Variables in the Via Lactae (VVV, Minniti et al., 2010), 2MASS (Skrutskie et al., 2006), and Deep Near Infrared Survey of the Southern Sky (DENIS, Epchtein et al., 1999) database555http://irsa.ipac.caltech.edu/applications/BabyGator/ (2MASS and DENIS) and http://horus.roe.ac.uk:8080/vdfs/Vregion_form.jsp (VVV) for the sources we could not observe or which were saturated.
| Source 239 | Source 750 | Source 1168 | Source 1278 | Source 1279 | Source 1326 | |||||||
| (Å) | (km s-1) | (Å) | (km s-1) | (Å) | (km s-1) | (Å) | (km s-1) | (Å) | (km s-1) | (Å) | (km s-1) | |
| H i 15087 Å | * | * | ||||||||||
| H i 15137 Å | -4.710.59 | 34876 | ||||||||||
| H i 15196 Å | * | * | * | * | -4.670.46 | 25973 | ||||||
| H i 15265 Å | * | * | -3.590.99 | 508216 | -3.820.51 | 277105 | ||||||
| H i 15346 Å | -6.210.61 | 36970 | * | * | -4.650.91 | 37091 | -6.650.57 | 32957 | ||||
| Fe ii 15403 Å | * | * | -4.290.53 | 355111 | * | * | ||||||
| H i 15443 Å | -10.610.99 | 58992 | * | * | -4.710.59 | 30484 | ||||||
| H i 15561 Å | -8.980.48 | 39538 | -2.601.15 | 374224 | 8.371.71 | 1073202 | 12.280.88 | 37149 | ||||
| H i 15705 Å | -5.310.51 | 25361 | * | * | -7.910.52 | 34446 | ||||||
| Fe ii 15778 Å | -1.690.62 | 258196 | -2.620.98 | 556298 | ||||||||
| Fe ii 15842 Å | -5.290.63 | 41686 | -3.570.35 | 52488 | ||||||||
| H i 15885 Å | -7.650.61 | 26845 | * | * | 2.620.42 | 720233 | -7.730.92 | 975142 | -3.340.66 | 841211 | -9.090.53 | 40945 |
| Fe ii 15954 Å | -1.410.77 | 32475 | -4.120.65 | 446111 | ||||||||
| He i 16008 Å | -4.770.85 | 604140 | ||||||||||
| H i 16114 Å | -8.150.54 | 37448 | -4.641.94 | 384224 | 4.530.96 | 1184311 | * | * | -3.980.94 | 680203 | -5.010.57 | 31379 |
| H i 16412 Å | -7.700.50 | 33233 | -2.290.60 | 259166 | 4.790.82 | 850168 | -1.880.77 | 500291 | -5.340.87 | 872169 | -9.230.71 | 42935 |
| H i 16811 Å | -11.10.79 | 50740 | -5.040.65 | 48995 | 4.310.70 | 762257 | * | * | -6.111.29 | 1077251 | -9.030.62 | 37936 |
| Fe ii 16878 Å | -6.000.65 | 54080 | -5.010.96 | 590170 | ||||||||
| He i 16919 Å | * | * | * | * | ||||||||
| He i+Fe ii 17007 Å | -1.710.35 | 18364 | -3.320.52 | 29787 | -11.01.12 | 1458217 | -1.941.19 | 504362 | ||||
| Fe ii 17110 Å | * | * | * | * | ||||||||
| H i 17367 Å | -7.560.52 | 43256 | -9.260.89 | 79992 | 6.891.00 | 1233201 | -5.721.31 | 726189 | -12.01.11 | 1209135 | -8.220.75 | 54060 |
| Fe ii 17455 Å | * | * | ||||||||||
| Fe ii 20456 Å | * | * | ||||||||||
| He i 20586 Å | -6.500.93 | 514105 | -17.80.80 | 53237 | -10.11.57 | 1105171 | * | * | -7.680.69 | 30457 | ||
| He i 21127 Å | -7.710.91 | 59398 | -11.41.36 | 76186 | ||||||||
| Mg ii 21376 Å | 2.970.53 | 410188 | ||||||||||
| H i 21661 Å | -10.10.65 | 15953 | -42.61.14 | 75019 | 12.41.19 | 1199130 | -29.41.33 | 117552 | -45.11.34 | 131856 | -10.90.72 | 22041 |
| He ii 21891 Å | -6.901.27 | 570113 | -8.571.01 | 53373 | ||||||||
| Na i 22090 Å | * | * | * | * | ||||||||
$a$$a$footnotetext: Equivalent width (Å)
$b$$b$footnotetext: Full-width at half-maximum (km s-1).
2.2 Near-infrared spectroscopy
Based on the aforementioned criteria, we selected 45 sources and we observed most of them from 2012 June 1 to 4 with the Ohio State Infrared Imager/Spectrometer (OSIRIS) mounted on the 4m SOAR telescope at CTIO. We made use of the cross-dispersed mode with a slit of 1″ in width, which allowed us to obtain simultaneous , , and -band spectra with an R spectral resolution using the standard ABBA nodding technique for background subtraction. Each night, standard stars were observed in similar conditions for telluric absorption lines removal. We reduced the data with the IRAF routines of the echelle package. The basic steps consisted in bad pixel correction, dark subtraction, linearity correction, flatfielding, sky subtraction, and spectral extraction along the dispersion axis. The spectra were then wavelength-calibrated through comparison with those of an Argon lamp taken before and after each exposure.
 |
 |
 |
 |
 |
 |
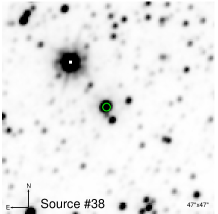
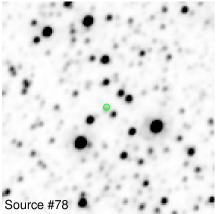
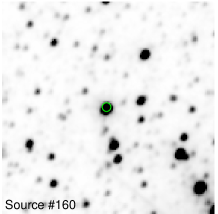
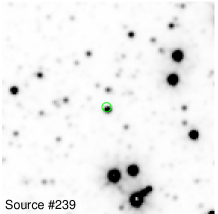
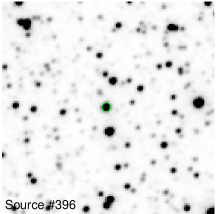
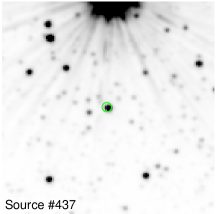
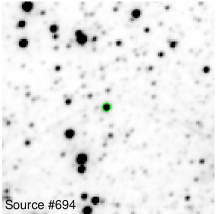
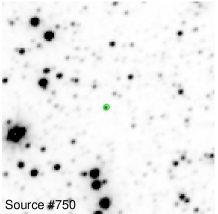
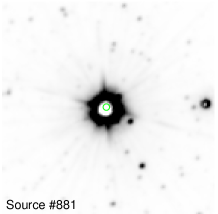
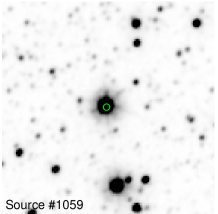
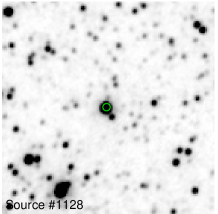
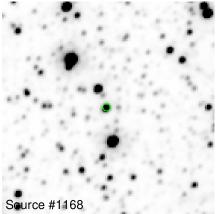
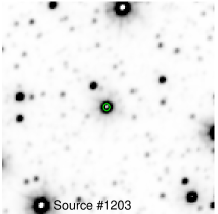
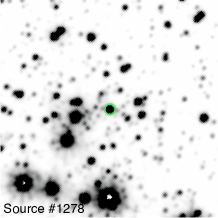
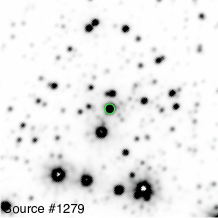
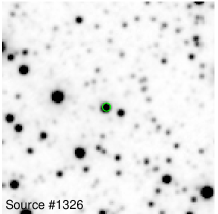
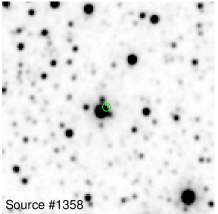
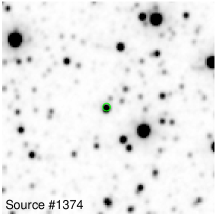
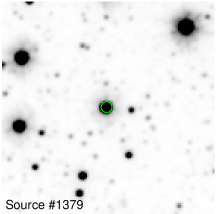
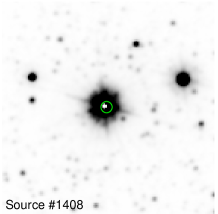
Weather and atmospheric conditions were unfortunately not optimal, with thin clouds most of the nights and a seeing higher than 13. Thus, the S/N of all the spectra are lower than we expected. Consequently, the -band spectra we obtained are too noisy, and we do not use them in this study. Furthermore, the faintest sources in our sample were hard to observe in the and bands. This is the reason why we only report on 20 sources (see Figure 1 for their -band counterparts); near-IR spectroscopy of the rest of our sample is on-going and will be presented in another paper.
3 Results and analysis
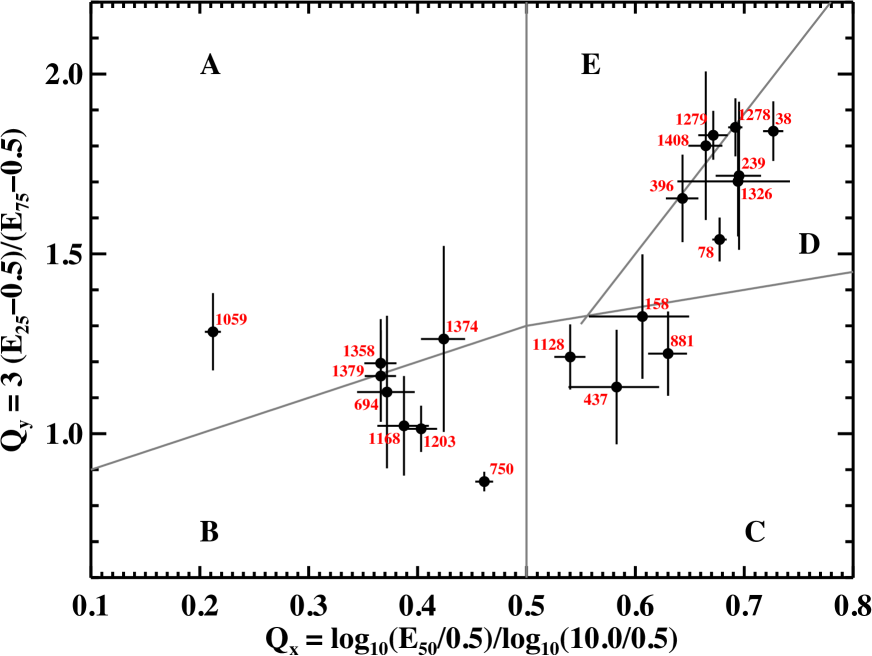
To strengthen the identification of the X-ray emitters, we made use of the quantile analysis techniques developed in Hong et al. (2004), and we refer to Fornasini et al. (2014) for a complete description. Roughly, it allows the derivation of two energy-binning independent quantities (which measures the hardness of a spectrum) and (which depends on how broad or narrow a spectrum is). By placing a source in a vs. diagram, it is therefore possible to get a rough measurement of its X-ray spectral characteristics. The quantile diagram for the 20 sources in our sample is displayed in Figure 2. We divided it into five groups labelled from A to E. Again, comprehensive information can be found in Fornasini et al. (2014), but we can summarize their characteristics as follows:
group A: low column density sources, most likely X-ray active low mass stars and interacting binaries.
group B: similar to group A with a significant population of cataclysmic variables (CVs). Owing to their low column densities, sources in groups A and B are likely foreground objects and their unabsorbed luminosities will thus be estimated for a typical 1 kpc distance, when unknown.
group C: intermediate column density consistent with a 3-5 kpc distance. Likely populated with CVs, LMXBs, and HMXBs. A 5 kpc distance is used for unabsorbed luminosity calculation.
group D: high column density sources, probably located in the Norma arm or beyond. Hard spectra typical of intermediate polars (IPs) or HMXBs. However, some of the sources without near-IR counterparts may be Type II active galactic nuclei (AGN).
group E: highly absorbed sources with softer spectra
than group D, likely containing a significant number of isolated
high mass stars and colliding wind binaries (CWBs). Sources without
near-IR counterparts are likely Type I AGN. The unabsorbed
luminosities of sources in Groups D and E are assessed for a 10 kpc
distance, typical of the far Norma arm.
 |
 |
 |
 |
Table 1 lists the X-ray characteristics of the 20 sources (X-ray coordinates, quantile groups, X-ray and total ISM column densities and , photon indices or plasma temperatures , unabsorbed 0.5-10 keV luminosities) as well as the reliability of the near-IR counterparts. The NEWFIRM and VVV near-IR counterparts are listed in Table 2 and those from 2MASS and DENIS are listed in Table 3. We note that all the magnitudes are given in their original photometric systems. Finally, we also retrieved the GLIMPSE (Benjamin et al., 2003; Churchwell et al., 2009) and WISE (Wright et al., 2010) mid-infrared (mid-IR) counterparts of most of the 20 sources (see Table 4).
We identified the companion stars of the Chandra sources from the near-IR spectra, relying on several near-IR spectroscopic atlases to isolate important emission and/or absorption features. We specifically made use of Wallace & Hinkle (1996, 1997), Meyer et al. (1998), Förster Schreiber (2000), Ivanov et al. (2004), and Rayner et al. (2009) for cool stars, as well as Hanson et al. (1996, 1998, 2005), Morris et al. (1996), Blum et al. (1997), Clark & Steele (2000), Steele & Clark (2001), and Repolust et al. (2005) for hot stars.
The 20 sources in our sample are divided into two near-IR spectral groups, six with spectra dominated by hydrogen-like species, in emission for all but one (spectra are displayed in Figures 3, 5, 7, and 9 and features are listed in Table 5), and 14 with spectra typical of cool stars (spectra are displayed in Figures 10, 11, 12, 13, and 14 and the important features are listed Table 6).
3.1 Sources with near-IR spectra dominated by hydrogen-like species
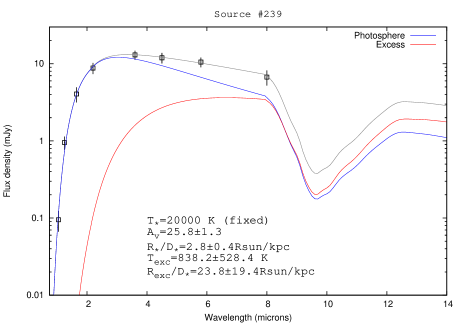
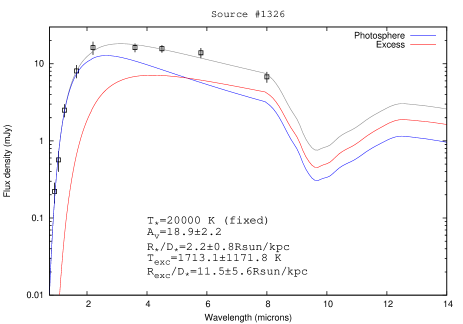
3.1.1 Sources 239 and 1326
Sources 239 and 1326 were detected as relatively bright X-ray point sources with Chandra. They both suffer from a high column density atoms cm-2, possibly slightly in excess of the total galactic column density along their LOS atoms cm-2, but uncertainties are high. Furthermore, both are located at almost the same spot in the quantile diagram (Group D, Figure 2), a hint that they belong to the same subclass of X-ray emitters. Nonetheless, source 239 is likely constant (30% probability) and source 1326 is likely not (0.02% probability of being constant), while source 1326 may also be harder with compared to for source 239.
In the near-IR domain, both sources are constant. Alternative , , and magnitudes are , , and for source 239 (from VVV), and , , and for source 1326 (from 2MASS). Their near-IR spectra are also almost identical (see Figure 3); we detect strong and narrow emission lines (roughly 300-500 km s-1 wide) from the whole Brackett series, He i Å, Fe ii Å, as well as very faint emission of Na i Å. Overall, these spectra are consistent with those of early Be III/V stars presented in Clark & Steele (2000) and Steele & Clark (2001). However, we also detect, in both spectra, several emission lines centred at 15842 Å, 15964 Å, 17110 Å, 17455 Å, and 20456 Å that could be identified with Fe ii. As stressed in Morris et al. (1996) and Lamers et al. (1998), the presence of such features would be more consistent with narrow-emission-line massive stars with strongly irradiated outflows, such as B[e] supergiants (sgB[e]) or luminous blue variables (although, by definition, we expect LBVs to be strongly variable). These stars are known to exhibit a mid-IR excess due to a complex circumstellar environment in which warm dust is produced. To investigate the presence of such an excess, we built the spectral energy distributions (SEDs) of sources 239 and 1326 using their near-IR magnitudes (completed with those in and bands from VVV) as well as their Spitzer/IRAC fluxes at 3.6, 4.5, 5.8, and 8.0 m. We then fitted these SEDs first with a single absorbed 20000 K black body mimicking the stellar emission of a blue star, then adding a complementary black body to take into account a possible excess, using Galactic extinction laws from Fitzpatrick (1999) in the optical/near-IR and Chiar & Tielens (2006) in the mid-IR. For both sources, the best fits were obtained with two black bodies, the reduced being half the value of the single black body case (see Figure 4 for plots and best-fit parameters). We stress that the fits were also performed with stellar temperatures as free parameters, and it is then possible to describe the SEDs with single black bodies; however, their best-fit temperatures reach the minimum allowed value of 3000 K, which is not realistic. We also fitted the SEDs fixing the stellar temperatures to lower and higher values (10000 K, 15000 K, 25000 K, 30000 K, and 35000 K) and the mid-IR excess is still present. Thus, despite the simplistic use of spherical black bodies (see e.g. Chaty & Rahoui, 2012), we believe that sources 239 and 1326 do exhibit near- and mid-IR excesses. Whether the latter are due to warm dust in sgB[e]/LBV stellar winds or free-free emission from the decretion disc of Be stars is a matter of debate. We note that the derived values are consistent with a minimum 10 kpc distance for the two sources (using the three-dimensional extinction law from Marshall et al., 2006). If the stars do reside at this distance, they must have radii larger than 20 – whatever the stellar temperature we consider in the fits – which are more consistent with early-B supergiants than giant or main-sequence stars (Vacca et al., 1996; Searle et al., 2008). Furthermore, the unabsorbed 0.5-10 keV luminosities at 10 kpc are about erg s-1 for the two sources, which is possible for isolated O/B supergiants but at least 1 or 2 orders of magnitude larger than what is expected from isolated Be III/V stars (see e.g. Berghöfer et al., 1996; Cohen, 2000). It is therefore reasonable to speculate that if sources 239 and 1326 are Be stars, they must belong to HMXBs. Alternatively, they may be isolated sgB[e] or LBV stars, even though their X-ray photon indices and luminosities may favour the quiescent X-ray binary hypothesis.
3.1.2 Sources 1278 and 1279
In the X-ray domain, sources 1278 and 1279 are very similar. They are located very close to each other in the quantile diagram and both are very absorbed and relatively bright, with atoms cm-2 and unabsorbed 0.5-10 keV luminosities of approximatively erg s-1 and erg s-1 at 10 kpc, respectively. Despite large uncertainties in the assessment of their column densities, they very likely exhibit an excess absorption with respect to the total galactic extinction along their LOS atoms cm-2; while this is consistent with wind accretion in HMXBs, their X-ray spectra are better fitted with an thermal plasma model ( keV and keV, respectively), which is more typical of isolated massive stars.
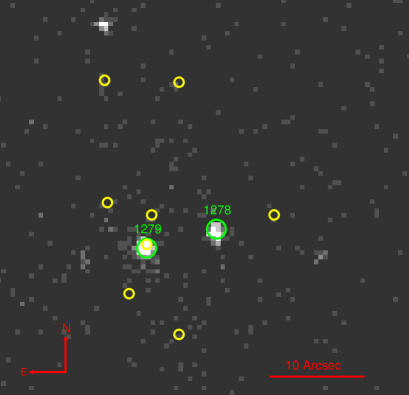
The similarity of their X-ray properties concurs with the fact that sources 1278 and 1279 belong to the same young massive star cluster Mercer 81 (Mercer et al., 2005), discovered during the GLIMPSE survey of the Galactic plane with Spitzer. Mercer 81 was recently studied through near-IR photometry with HST and near-IR spectroscopy with ESO/ISAAC and the results of these observations are reported in Davies et al. (2012) and de la Fuente et al. (2013). The authors derived a kpc distance and showed that Mercer 81 was mainly populated with nitrogen-rich Wolf-Rayet and blue supergiant stars; in particular, sources 1278 and 1279 (labelled 8 and 2 in these papers, see Figure 2 in Davies et al., 2012) were identified as late WN Wolf-Rayet stars (see Figure 3 in de la Fuente et al., 2013). We concur with these results. Our OSIRIS spectra, displayed in Figure 5, are similar to theirs, and our derived He ii Å/H i Å ratios – i.e. about 0.23 and 0.19 for sources 1278 and 1279, respectively – are consistent with a WN8 classification (expected values between 0.1 and 0.4, see Table 5 in Crowther et al., 2006). Moreover, Figure 6 displays a 0.5-10 keV Chandra image of Mercer 81 on which we superimposed the near-IR positions of sources 1278 and 1279 (green circles) as well as those of the remaining eight sources identified as Wolf-Rayet or supergiant stars (yellow circles). It is clear that only sources 1278 and 1279 are detected with Chandra, although all sources suffer from the same extinction; this indicates that sources 1278 and 1279 are more effective X-ray emitters than other Wolf-Rayet stars in Mercer 81. To check this hypothesis, we can follow Mauerhan et al. (2010) to estimate the X-ray to bolometric luminosity ratios for the two sources and compare them to the expected value for isolated Wolf-Rayet stars. Using the observed and colours, the intrinsic and colours for WN8 stars given in Crowther et al. (2006), i.e. 0.13 and 0.11, respectively, as well as the relations and from Nishiyama et al. (2006), we derive an average -band extinction for each source. For a 10 kpc distance, this results in the absolute -band magnitudes and for source 1278 and 1279, respectively. Using the -band bolometric correction for WN8 stars given in Crowther et al. (2006), i.e. , we thus find that the total bolometric luminosities are erg s-1 and erg s-1, for sources 1278 and 1279, respectively. This yields ratios of about and for sources 1278 and 1279, respectively. These values are slightly in excess of the canonical , and this may indicate that the two sources are CWBs, producing X-rays in the shocks of their colliding winds. Another explanation is that both sources are HMXBs in which the compact object accretes material from the strong stellar winds of Wolf-Rayet stars, but as already mentioned, the fact that their X-ray spectra are better described by thermal plasma models disfavours this possibility.
3.1.3 Source 1168
 |
 |
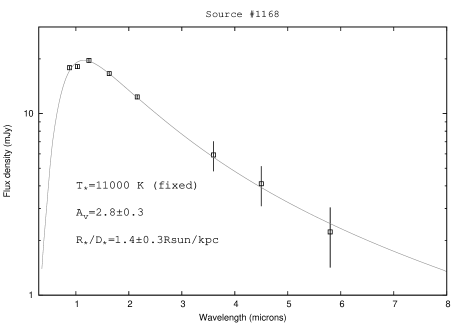
We detected source 1168 with Chandra as a bright and variable hard X-ray point source () with a column density much lower than that of ISM along its entire LOS ( atoms cm-2 vs. atoms cm-2). The near-IR spectrum displayed in Figure 7 is typical of massive stars. In the H band, we clearly detect absorption features of the Brackett series centred at 15561 Å, 15885 Å, 16114 Å, 16412 Å, 16811 Å, and 17367 Å. The absence of Brackett lines below 15500 Å is also consistent with a IV/V luminosity class (Meyer et al., 1998), while the strength of the detected H i lines and the lack of He i are characteristic of late-B/early-A stars (Blum et al., 1997). In the K band, Br and Mg ii 21376 Å, signatures of stellar winds, are present but the strength of Br and the absence of He i features point towards a IV/V class with a spectral type later than B8 (Hanson et al., 1996); we therefore conclude that source 1168 is a nearby B8-A3IV/V star. Figure 8 displays its optical to mid-IR SED built using archival fluxes from the VVV and GLIMPSE surveys and fitted with a 11000 K temperature black body. Using the derived value and the three-dimensional law of Marshall et al. (2006), we estimate its distance to be around 3.5 kpc, which results in a stellar radius , consistent with the typical radii of late-B/early-A subgiant stars listed in Pasinetti Fracassini et al. (2001). Moreover, such a distance gives a 0.5-10 keV unabsorbed luminosity of about erg s-1, i.e. at least one order of magnitude too high for an isolated B8-A3IV/V star (Berghöfer et al., 1996) and we tentatively classify source 1168 as a quiescent HMXB.
 |
 |
3.1.4 Source 750
Source 750 is one of the brightest X-ray sources that we detected with Chandra. It is variable and has a hard spectrum () with a atoms cm-2 column density; once corrected from absorption, its 0.5-10 keV luminosity at 1 kpc is about erg s-1. It is the hardest source of group B and its location in the quantile diagram is clearly separated from the other sources of the group, hinting at a distinct nature. More importantly, its X-ray light curve exhibits a 7150 s period (Fornasini et al., 2014) more likely related to the orbit or the spin period of a white dwarf (WD). Overall, the X-ray behaviour of source 750 is consistent with that of an intermediate polar (IP), in which a WD accretes from a main-sequence star via a truncated accretion disc (see Kuulkers et al., 2006, for a review).
| No. | Fe i | Si i | CO | Mg i | H i | Na i | Ca i | CO | CO | CO | CO |
|---|---|---|---|---|---|---|---|---|---|---|---|
| 15830 Å | 15890 Å | 16198 Å | 17115 Å | 21663 Å | 22075 Å | 22637 Å | 22957 Å | 23245 Å | 23464 Å | 23550 Å | |
| 38 | 2.880.51 | 1.280.40 | 7.350.77 | 1.730.45 | 2.430.95 | 1.570.55 | 5.251.00 | 43.451.50 | 10.880.55 | 12.060.40 | |
| 78 | 2.440.51 | 2.571.12 | 3.370.85 | 1.120.40 | 9.130.72 | 3.090.35 | 3.240.61 | ||||
| 158 | 1.560.73 | 1.740.48 | 5.191.94 | 1.310.75 | 4.720.61 | 3.170.66 | 10.510.75 | 4.050.50 | |||
| 396 | 2.710.46 | 3.280.63 | 3.430.86 | 1.810.85 | 1.830.76 | 8.410.70 | 5.490.73 | ||||
| 437 | 1.750.62 | 1.580.68 | 1.840.56 | 3.990.69 | 6.500.49 | 6.950.73 | |||||
| 694 | 1.710.48 | 3.201.04 | 2.010.57 | 4.110.75 | 6.101.01 | 3.480.81 | |||||
| 881 | 2.110.57 | 7.160.70 | 2.500.68 | 2.790.57 | 0.800.40 | 27.912.01 | 16.290.94 | 2.480.52 | 12.280.88 | ||
| 1059 | 0.960.40 | 4.260.82 | 5.791.07 | 4.950.75 | |||||||
| 1128 | 2.210.56 | 2.310.77 | 1.460.68 | 5.441.05 | 2.180.86 | 4.370.98 | 2.270.68 | ||||
| 1203 | 2.640.65 | 2.490.70 | 1.660.50 | 2.130.90 | 13.121.02 | 5.900.65 | |||||
| 1358 | 2.240.50 | 2.500.81 | 1.901.05 | 1.490.75 | 1.410.51 | 5.291.04 | 5.730.71 | ||||
| 1374 | 1.880.41 | 2.871.32 | 2.280.52 | 3.600.70 | 2.220.57 | 1.240.61 | 4.050.57 | 8.860.72 | |||
| 1379 | 1.510.57 | 1.620.50 | 4.960.72 | 3.410.97 | |||||||
| 1408 | 4.430.61 | 1.420.41 | 13.950.87 | 5.110.48 | 8.940.45 |
.
In the near-IR domain, the source is variable, with from VVV and from 2MASS, pointing towards a contribution from an accretion stream. Moreover, its near-IR spectrum, displayed in Figure 9, is clearly dominated by the whole Brackett series as well as He i Å, all in emission. The lines are particularly strong in K, with equivalent widths of about 18 Å and 43 Å for He i and Br , respectively. Again, this spectrum is consistent with an accretion stream and is actually very similar to those of IPs presented in Dhillon et al. (1997) and Harrison et al. (2007); we therefore believe that source 750 is very likely an IP.
3.2 Sources with typical near-IR spectra of cool stars
 |
 |
 |
 |
 |
 |
 |
 |
 |
 |
 |
 |
 |
 |
 |
 |
 |
 |
 |
 |
 |
 |
 |
 |
 |
 |
 |
 |
| No. | Relative strength | Spectral classification |
|---|---|---|
| 38 | Strong CO (6,3); No Br; Strong CO (2,0) | Early MIII |
| 78 | Weak CO (6,3); Weak Br; Strong CO (2,0) | Late G III |
| 158 | Weak CO (6,3); Strong Br; Strong CO (2,0) | Early/mid GI-III |
| 396 | Medium CO (6,3); No Br; Strong CO (2,0) | Mid/Late KI-III |
| 437 | Weak CO (6,3); Strong Br; Medium CO (2,0) | Early GI-III |
| 694 | Medium CO (6,3); Strong Br; Medium CO (2,0) | Early KI-III |
| 881 | Strong CO (6,3); Weak Br; Strong CO (2,0) | Late K/Early MI-III |
| 1059 | No CO (6,3); No Br; Medium CO (2,0) | Early MV |
| 1128 | No CO (6,3); Strong Br; Medium CO (2,0) | GV |
| 1203 | Medium CO (6,3); No Br; Strong CO (2,0) | Mid/Late KI-III |
| 1358 | Weak CO (6,3); Weak Br; Medium CO (2,0) | Early KV |
| 1374 | Weak CO (6,3); Medium Br; Weak CO (2,0) | Late G/Early KV |
| 1379 | No CO (6,3); Strong Br; Weak CO (2,0) | Mid GIII |
| 1408 | Strong CO (6,3); No Br; Strong CO (2,0) | KIII |
In the H and K bands, cool stars are characterized by the presence of many absorption lines of Fe i, Mg i, Si i, Ca i, and Na i, but the detection of the CO (2,0) and CO (3,1) overtones in absorption beyond 22900 Å is a clear indicator of their nature. The near-IR counterparts of the 14 sources presented in this section all exhibit at least one of these CO features and this is the reason why we classify them as cool stars. However, deriving a more accurate spectral classification is difficult because (1) the S/N ratio of our spectra are not high enough to perform a quantitative comparison with existing near-IR libraries and (2) a possible veiling by the near-IR continuum of the component responsible for the soft X-ray emission would likely alter the equivalent width measurements. We therefore list tentative spectral types in Table 7 obtained by comparing the relative strength of the CO features at 16190 Å and 22957 Å as well as that of Br, the last being weak or absent for K/M stars. We nevertheless stress that this classification should be taken with caution due to the aforementioned limitations.
Determining the possible origin of the soft X-ray emission and thus the nature of the X-ray emitters is also not straightforward. On the one hand, the X-ray emission could stem from accreting binaries such as LMXBs, CVs, IPs, or symbiotic binaries (SBs). On the other hand, it could also come from foreground isolated low mass stars (iLMS) or coronally active binaries (ABs). Although discriminating between all these possibilities is difficult, the presence of near-IR emission lines, in particular H i, and/or near-IR variability can be a strong indicator of the presence of an accretion stream. The ISM extinction along the LOS and the X-ray luminosity also provide valuable information; for example iLMS are likely foreground objects and their X-ray luminosity is expected to be lower than erg s-1 (see e.g. Güdel & Nazé, 2009). Finally, the positions of the sources in the vs. diagram hint at common X-ray spectral properties, and therefore the following sections present the sources grouped by similar location in this diagram.
3.2.1 Groups A/B: sources 694, 1059, 1203, 1358 1374, and 1379
The six sources are weakly extincted, with atoms cm-2, indicating that they are foreground objects. However, sources 694, 1203, 1358, 1374, and 1379 exhibit similar photon indices (, , , , and , respectively), while source 1059 is a much softer and better described by an absorbed thermal plasma model, with keV. Source 694 is the faintest, with a 0.5-10 keV luminosity at 1 kpc erg s-1 compared to erg s-1 for the other five sources.
These X-ray properties are consistent with those expected from all X-ray emitting low mass systems, including iLMSs and ABs, and do not specifically hint at the presence of accretion discs. However, we note that the near-IR spectrum of source 694 is the only one that convincingly exhibits emission lines. This source is also the only one with variable near-IR emission, with , , and magnitudes of , , and in NEWFIRM; , , and in VVV; and , , and in 2MASS. We therefore believe that source 694 is a quiescent accreting binary. The other five sources are likely isolated giant or main-sequence stars, although we stress that sources 1203 and 1379 may exhibit a variable emission at 3.5 m with GLIMPSE and WISE fluxes of about mJy vs. mJy and mJy vs. mJy, respectively. We also note that the optical/near-IR counterpart of source 1059 is classified as an M4V star in Lépine & Gaidos (2011), in agreement with our own classification as an early main-sequence M star.
3.2.2 Group C: sources 158, 437, 881, and 1128
The four sources are more extincted that the previous group of sources, with values clustered in the range atoms cm-2, lower than the total ISM extinction along their LOS; this extinction indicates that these sources are located in the near Norma arm. They also have harder spectra than the sources discussed in Sect. 3.2.1; sources 158, 437, and 1128 have a similar spectral index (, and , respectively) while the spectrum of source 881 is even flatter, with . Their 0.5-10 keV unabsorbed luminosities at 5 kpc ( erg s-1, erg s-1, erg s-1, and erg s-1, respectively) are inconsistent with iLMSs or ABs and thus the four sources are likely accreting binaries. However, the presence of emission lines in their near-IR spectra is scarce, maybe because the accretion stream is less active. Furthermore, source 881 – the brightest X-ray emitter of the four – is convincingly variable in the near-IR, with 2MASS magnitudes significantly fainter than the DENIS ones (: vs. ; : vs. ), as well as in the mid-IR, the GLIMPSE fluxes at 3.5 m and 4.5 m being lower that those from WISE at the same wavelengths (3.5 m: mJy vs. mJy; 4.5 m: mJy vs. mJy). The lack of significant near-IR variability for the remaining sources may indicate that if accretion is occurring, it is weak. However, we note that source 1128 likely has variable mid-IR emission, with higher GLIMPSE fluxes at 3.5 m and 4.5 m with respect to WISE (3.5 m: mJy vs. mJy; 4.5 m: mJy vs. mJy).
3.2.3 Groups D and E: sources 38, 78, 396, and 1408
Sources 38, 396, and 1408 suffer from an extinction likely higher than that along their LOS, having atoms cm-2. They exhibit a similar photon index (, , and , respectively) and are relatively bright X-ray emitters, with unabsorbed 0.5-10 keV luminosities assuming a 10 kpc distance of erg s-1, erg s-1, and erg s-1, respectively. The properties of source 78 are slightly different, as it exhibits a lower column density along its LOS of atoms cm-2 and is a lot harder, with and a 0.5-10 keV luminosity at 5 kpc of about erg s-1. That said, the X-ray properties of the four sources are inconsistent with those expected from iLMSs or ABs, and their X-ray emission likely stems from accretion.
The near-IR properties are in agreement with the latter hypothesis. The four sources exhibit emission lines in their spectra, hinting at an accretion stream presence. In addition, sources 78, 396, and 1408 are variable. Indeed, the near-IR magnitudes of source 78 decreased from VVV to NEWFIRM (: vs. ; : vs. ). Moreover, source 396 is undetected with DENIS and its 2MASS magnitudes are slightly higher than those of NEWFIRM and VVV (, , and vs. , , and ). Likewise, the 2MASS magnitude of source 1408 is lower than that measured in DENIS ( vs. ). Its GLIMPSE fluxes at 3.5 m is also significantly lower than that from WISE ( mJy vs. mJy). Based on their X-ray and infrared behaviours and properties, it is therefore reasonable to conclude that all four sources are accreting binaries hosting giant stars.
4 Discussion and conclusion
We have conducted near-IR photometric and spectroscopic observations of 20 soft X-ray sources discovered during a Chandra survey of a 08 region of the Norma arm. Our main goal was to detect new low-luminosity HMXBs, thought to be principally located in very active star-forming regions. We identify (1) two massive emission-line stars, possibly in HMXBs, exhibiting near- and mid-IR excesses consistent with either free-free emission from the decretion discs of Be stars or warm dust in the stellar winds of peculiar massive stars such as sgB[e] or LBVs; (2) two WN8 Wolf Rayets, maybe in CWBs and located in the Mercer 81 massive star cluster; (3) a foreground B8-A3 IV/V star, likely in an HMXB; (4) one IP, the near-IR spectrum of which is dominated by the accretion disc; and (5) a foreground isolated M4V dwarf. Among the 13 remaining sources, four are likely isolated late-type giant or main-sequence stars, and nine are low mass accreting binaries.
4.1 The nature of the low mass accreting systems
Even if the outcome of the ongoing near-IR spectroscopy of additional NARCS sources may increase the number of detected massive stars, it is clear that our sample is dominated by low mass accreting binaries. However, it is difficult to be more specific about the nature of the primaries (WDs, NSs, or BHs) or that of the systems themselves (LMXBs, CVs, or SBs). Based on the presence of many emission lines in their near-IR spectra, their relatively high 0.5-10 keV luminosity and the red giant nature of their companion stars, we can speculate that sources 38, 396, and 1408 are quiescent LMXBs in the outer Norma arm. It is, however, interesting that they all suffer from an intrinsic extinction in excess of the ISM along their LOS (especially source 38) and that they are located at a similar position in the quantile diagram as candidate HMXBs and CWBs. It is therefore possible that sources 38, 396, and 1408 actually are SBs in which the compact objects accrete material from the stellar winds of their late giant companion stars in an eccentric orbit. Whether the compact object is a WD or a NS is a matter of debate, but we stress that their X-ray and near-IR properties (in particular their relative X-ray hardness) could be consistent with the new and rare class of symbiotic X-ray binaries (SyXRBs), in which a magnetized NS accretes matter from the wind of a red giant (see Masetti et al., 2007; Corbet et al., 2008; DeWitt et al., 2013). Source 694 in groups A/B as well as sources 158, 437, 881, and 78 in groups C/D are also possible SBs but likely belong to two different classes. Indeed, source 694 has all the characteristics of a standard quiescent SB with a WD primary, i.e. a giant companion, weak extinction, and low 0.5-10 keV luminosity. In contrast, sources 78, 158, 437, and 881 exhibit X-ray luminosities of erg s-1, are relatively extincted, and have a hard spectrum. This behaviour may be more consistent with that expected from hard spectrum SBs, in which a WD accretes from a red giant through an accretion disc (dubbed as class ; see Luna et al., 2013). Finally, source 1128 has all the properties of a quiescent CV in the inner Norma arm, and likely hosts a WD accreting from a main-sequence companion.
4.2 The nature of the high mass systems
The low number of massive stars in our sample was expected because of their short lifetime. Nonetheless, the possible detection of up to three new HMXBs (sources 239, 1168, and 1326) in a region covering about one square degree is consistent with our prediction of three to four HMXBs per square degree with unabsorbed fluxes larger than erg cm-2 s-1(Fornasini et al., 2014). One could argue that none of these sources is an HMXB, in particular because their unabsorbed luminosities are at least one order of magnitude lower than expected. However, these X-ray luminosities also seem too high to be those of isolated stars. A possible way to reconcile these discrepancies is that sources 239, 1326, and 1168 are quiescent HMXBs. We stress that SFXTs, which are transient sources, exhibit luminosities as low as erg s-1 when in quiescence. Furthermore, such low luminosities have been observed in some Be X-ray binaries (see e.g. V0332+53, Campana et al., 2002) and some -Cas analogs which could be – although this explanation is still controversial – WD-Be binaries (Nebot Gómez-Morán et al., 2013); such systems may represent up to 70% of all compact object-Be star associations (Raguzova, 2001). More recently, Casares et al. (2014) also confirmed that the Be star MWC 656 was the companion of an X-ray quiescent BH, resulting in the first identification of a BH-BeXB. Population synthesis models point towards the extreme rarity of such systems, which are also thought to be very faint in the X-ray domain due to accretion disc truncation. This illustrates one of the major limitations of soft X-ray surveys in characterizing new low-luminosity HMXBs, as a significant fraction of them appear similar to CWBs or slightly more energetic isolated massive stars. It is therefore reasonable to believe that a significant population of quiescent HMXBs, some with BH primaries, exist in the Galaxy but remain undetected and/or misidentified. A possible way to address this issue is to observe candidate low-luminosity HMXBs through optical and near-IR high-resolution spectroscopy for radial velocity measurements. Alternatively, hard X-ray spectroscopy may allow us to characterize their emission in this spectral domain more accurately, which should be power-law-like and harder than that of isolated massive stars if even weak accretion occurs. In particular, hard X-ray observations of the five X-ray sources with massive stellar counterparts we identified in this study should enable us to verify their HMXB, CWB, or isolated massive star nature.
Acknowledgements.
We thank the anonymous referee for her/his comments that helped to improve this work. FMF acknowledges support from a National Science Foundation Graduate Research Fellowship. FEB acknowledges support from Basal-CATA PFB-06/2007, CONICYT-Chile FONDECYT 1141218, “EMBIGGEN” Anillo ACT1101, and Project IC120009 “Millennium Institute of Astrophysics (MAS)” funded by the Iniciativa Científica Milenio del Ministerio de Economía, Fomento y Turismo. We acknowledge the use of data products from observations made with ESO Telescopes at the La Silla or Paranal Observatories under ESO programme ID 179.B-2002. The VVV Survey is supported by ESO, by BASAL Center for Astrophysics and Associated Technologies PFB-06, by FONDAP Center for Astrophysics 15010003, and by the Iniciativa Científica Milenio del Ministerio de Economía, Fomento y Turismo through grant IC 12009, awarded to the “Millennium Institute of Astrophysics (MAS)”. This publication makes use of data products from the Two Micron All Sky Survey, which is a joint project of the University of Massachusetts and the Infrared Processing and Analysis Center/California Institute of Technology, funded by the National Aeronautics and Space Administration and the National Science Foundation.The DENIS project has been partly funded by the SCIENCE and the HCM plans of the European Commission under grants CT920791 and CT940627. It is supported by INSU, MEN and CNRS in France, by the State of Baden-Württemberg in Germany, by DGICYT in Spain, by CNR in Italy, by FFwFBWF in Austria, by FAPESP in Brazil, by OTKA grants F-4239 and F-013990 in Hungary, and by the ESO C&EE grant A-04-046. This work is partly based on observations made with the Spitzer Space Telescope, which is operated by the Jet Propulsion Laboratory, California Institute of Technology under a contract with the National Aeronautics and Space Administration. This publication makes use of data products from the Wide-field Infrared Survey Explorer, which is a joint project of the University of California, Los Angeles, and the Jet Propulsion Laboratory/California Institute of Technology, funded by the National Aeronautics and Space Administration.References
- Arnaud (1996) Arnaud, K. A. 1996, in Astronomical Society of the Pacific Conference Series, Vol. 101, Astronomical Data Analysis Software and Systems V, ed. G. H. Jacoby & J. Barnes, 17
- Benjamin et al. (2003) Benjamin, R. A., Churchwell, E., Babler, B. L., et al. 2003, PASP, 115, 953
- Berghöfer et al. (1996) Berghöfer, T. W., Schmitt, J. H. M. M., & Cassinelli, J. P. 1996, A&AS, 118, 481
- Bird et al. (2010) Bird, A. J., Bazzano, A., Bassani, L., et al. 2010, ApJS, 186, 1
- Blum et al. (1997) Blum, R. D., Ramond, T. M., Conti, P. S., Figer, D. F., & Sellgren, K. 1997, AJ, 113, 1855
- Bodaghee et al. (2012) Bodaghee, A., Tomsick, J. A., Rodriguez, J., & James, J. B. 2012, ApJ, 744, 108
- Bozzo et al. (2008) Bozzo, E., Falanga, M., & Stella, L. 2008, ApJ, 683, 1031
- Bronfman et al. (1989) Bronfman, L., Alvarez, H., Cohen, R. S., & Thaddeus, P. 1989, ApJS, 71, 481
- Campana et al. (2002) Campana, S., Stella, L., Israel, G. L., et al. 2002, ApJ, 580, 389
- Casares et al. (2014) Casares, J., Negueruela, I., Ribó, M., et al. 2014, Nature, 505, 378
- Caswell & Haynes (1987) Caswell, J. L. & Haynes, R. F. 1987, A&A, 171, 261
- Chaty & Rahoui (2012) Chaty, S. & Rahoui, F. 2012, ApJ, 751, 150
- Chaty et al. (2008) Chaty, S., Rahoui, F., Foellmi, C., et al. 2008, A&A, 484, 783
- Chiar & Tielens (2006) Chiar, J. E. & Tielens, A. G. G. M. 2006, ApJ, 637, 774
- Churchwell et al. (2009) Churchwell, E., Babler, B. L., Meade, M. R., et al. 2009, PASP, 121, 213
- Clark & Steele (2000) Clark, J. S. & Steele, I. A. 2000, A&AS, 141, 65
- Cohen (2000) Cohen, D. H. 2000, in Astronomical Society of the Pacific Conference Series, Vol. 214, IAU Colloq. 175: The Be Phenomenon in Early-Type Stars, ed. M. A. Smith, H. F. Henrichs, & J. Fabregat, 156
- Coleiro & Chaty (2013) Coleiro, A. & Chaty, S. 2013, ApJ, 764, 185
- Coleiro et al. (2013) Coleiro, A., Chaty, S., Zurita Heras, J. A., Rahoui, F., & Tomsick, J. A. 2013, A&A, 560, A108
- Corbet et al. (2008) Corbet, R. H. D., Sokoloski, J. L., Mukai, K., Markwardt, C. B., & Tueller, J. 2008, ApJ, 675, 1424
- Crowther et al. (2006) Crowther, P. A., Hadfield, L. J., Clark, J. S., Negueruela, I., & Vacca, W. D. 2006, MNRAS, 372, 1407
- Dame et al. (2001) Dame, T. M., Hartmann, D., & Thaddeus, P. 2001, ApJ, 547, 792
- Davies et al. (2012) Davies, B., de La Fuente, D., Najarro, F., et al. 2012, MNRAS, 419, 1860
- de la Fuente et al. (2013) de la Fuente, D., Najarro, F., Davies, B., & Figer, D. F. 2013, in Highlights of Spanish Astrophysics VII, 534–538
- DeWitt et al. (2013) DeWitt, C., Bandyopadhyay, R. M., Eikenberry, S. S., et al. 2013, AJ, 146, 109
- Dhillon et al. (1997) Dhillon, V. S., Marsh, T. R., Duck, S. R., & Rosen, S. R. 1997, MNRAS, 285, 95
- Epchtein et al. (1999) Epchtein, N., Deul, E., Derriere, S., et al. 1999, A&A, 349, 236
- Fitzpatrick (1999) Fitzpatrick, E. L. 1999, PASP, 111, 63
- Fornasini et al. (2014) Fornasini, F. M., Tomsick, J. A., Bodaghee, A., et al. 2014, Submitted to ApJ
- Förster Schreiber (2000) Förster Schreiber, N. M. 2000, AJ, 120, 2089
- Güdel & Nazé (2009) Güdel, M. & Nazé, Y. 2009, A&A Rev., 17, 309
- Hanson et al. (1996) Hanson, M. M., Conti, P. S., & Rieke, M. J. 1996, ApJS, 107, 281
- Hanson et al. (2005) Hanson, M. M., Kudritzki, R.-P., Kenworthy, M. A., Puls, J., & Tokunaga, A. T. 2005, ApJS, 161, 154
- Hanson et al. (1998) Hanson, M. M., Rieke, G. H., & Luhman, K. L. 1998, AJ, 116, 1915
- Harrison et al. (2007) Harrison, T. E., Campbell, R. K., Howell, S. B., Cordova, F. A., & Schwope, A. D. 2007, ApJ, 656, 444
- Hong et al. (2004) Hong, J., Schlegel, E. M., & Grindlay, J. E. 2004, ApJ, 614, 508
- Ivanov et al. (2004) Ivanov, V. D., Rieke, M. J., Engelbracht, C. W., et al. 2004, ApJS, 151, 387
- Kalberla et al. (2005) Kalberla, P. M. W., Burton, W. B., Hartmann, D., et al. 2005, A&A, 440, 775
- Kuulkers et al. (2006) Kuulkers, E., Norton, A., Schwope, A., & Warner, B. 2006, X-rays from cataclysmic variables (Compact stellar X-ray sources), 421–460
- Lamers et al. (1998) Lamers, H. J. G. L. M., Zickgraf, F.-J., de Winter, D., Houziaux, L., & Zorec, J. 1998, A&A, 340, 117
- Lépine & Gaidos (2011) Lépine, S. & Gaidos, E. 2011, AJ, 142, 138
- Lin & Shu (1964) Lin, C. C. & Shu, F. H. 1964, ApJ, 140, 646
- Lin et al. (1969) Lin, C. C., Yuan, C., & Shu, F. H. 1969, ApJ, 155, 721
- Luna et al. (2013) Luna, G. J. M., Sokoloski, J. L., Mukai, K., & Nelson, T. 2013, A&A, 559, A6
- Marshall et al. (2006) Marshall, D. J., Robin, A. C., Reylé, C., Schultheis, M., & Picaud, S. 2006, A&A, 453, 635
- Masetti et al. (2007) Masetti, N., Landi, R., Pretorius, M. L., et al. 2007, A&A, 470, 331
- Matt & Guainazzi (2003) Matt, G. & Guainazzi, M. 2003, MNRAS, 341, L13
- Mauerhan et al. (2010) Mauerhan, J. C., Muno, M. P., Morris, M. R., Stolovy, S. R., & Cotera, A. 2010, ApJ, 710, 706
- Mercer et al. (2005) Mercer, E. P., Clemens, D. P., Meade, M. R., et al. 2005, ApJ, 635, 560
- Meyer et al. (1998) Meyer, M. R., Edwards, S., Hinkle, K. H., & Strom, S. E. 1998, ApJ, 508, 397
- Minniti et al. (2010) Minniti, D., Lucas, P. W., Emerson, J. P., et al. 2010, NewA, 15, 433
- Morris et al. (1996) Morris, P. W., Eenens, P. R. J., Hanson, M. M., Conti, P. S., & Blum, R. D. 1996, ApJ, 470, 597
- Nebot Gómez-Morán et al. (2013) Nebot Gómez-Morán, A., Motch, C., Barcons, X., et al. 2013, A&A, 553, A12
- Negueruela et al. (2006) Negueruela, I., Smith, D. M., Reig, P., Chaty, S., & Torrejón, J. M. 2006, in ESA Special Publication, Vol. 604, The X-ray Universe 2005, ed. A. Wilson, 165–170
- Nishiyama et al. (2006) Nishiyama, S., Nagata, T., Kusakabe, N., et al. 2006, ApJ, 638, 839
- Pasinetti Fracassini et al. (2001) Pasinetti Fracassini, L. E., Pastori, L., Covino, S., & Pozzi, A. 2001, A&A, 367, 521
- Raguzova (2001) Raguzova, N. V. 2001, A&A, 367, 848
- Rahoui & Chaty (2008) Rahoui, F. & Chaty, S. 2008, A&A, 492, 163
- Rahoui et al. (2008) Rahoui, F., Chaty, S., Lagage, P.-O., & Pantin, E. 2008, A&A, 484, 801
- Rayner et al. (2009) Rayner, J. T., Cushing, M. C., & Vacca, W. D. 2009, ApJS, 185, 289
- Reig (2011) Reig, P. 2011, Ap&SS, 332, 1
- Repolust et al. (2005) Repolust, T., Puls, J., Hanson, M. M., Kudritzki, R.-P., & Mokiem, M. R. 2005, A&A, 440, 261
- Sana et al. (2012) Sana, H., de Mink, S. E., de Koter, A., et al. 2012, Science, 337, 444
- Searle et al. (2008) Searle, S. C., Prinja, R. K., Massa, D., & Ryans, R. 2008, A&A, 481, 777
- Skrutskie et al. (2006) Skrutskie, M. F., Cutri, R. M., Stiening, R., et al. 2006, AJ, 131, 1163
- Steele & Clark (2001) Steele, I. A. & Clark, J. S. 2001, A&A, 371, 643
- Sutherland & Saunders (1992) Sutherland, W. & Saunders, W. 1992, MNRAS, 259, 413
- Tody (1993) Tody, D. 1993, in Astronomical Society of the Pacific Conference Series, Vol. 52, Astronomical Data Analysis Software and Systems II, ed. R. J. Hanisch, R. J. V. Brissenden, & J. Barnes, 173
- Tomsick et al. (2012) Tomsick, J. A., Bodaghee, A., Chaty, S., et al. 2012, ApJ, 754, 145
- Tomsick et al. (2008) Tomsick, J. A., Chaty, S., Rodriguez, J., Walter, R., & Kaaret, P. 2008, ApJ, 685, 1143
- Vacca et al. (1996) Vacca, W. D., Garmany, C. D., & Shull, J. M. 1996, ApJ, 460, 914
- Wallace & Hinkle (1996) Wallace, L. & Hinkle, K. 1996, ApJS, 107, 312
- Wallace & Hinkle (1997) Wallace, L. & Hinkle, K. 1997, ApJS, 111, 445
- Walter & Zurita Heras (2007) Walter, R. & Zurita Heras, J. 2007, A&A, 476, 335
- Winkler et al. (2003) Winkler, C., Courvoisier, T. J.-L., Di Cocco, G., et al. 2003, A&A, 411, L1
- Wright et al. (2010) Wright, E. L., Eisenhardt, P. R. M., Mainzer, A. K., et al. 2010, AJ, 140, 1868