Broadband Measurement of Coating Thermal Noise in Rigid Fabry–Pérot Cavities
Abstract
We report on the relative length fluctuation of two fixed-spacer Fabry–Pérot cavities with mirrors fabricated from silica/tantala dielectric coatings on fused silica substrates. By locking a laser to each cavity and reading out the beat note of the transmitted beams, we find that, for frequencies from 10 Hz to 1 kHz, the amplitude spectral density of beat note fluctuation is . By careful budgeting of noise sources contributing to the beat note, we find that our measurement is consistent with the fluctuation in this band being dominated by the Brownian noise of the mirror coatings. Fitting for the coating loss angle , we find it equal to . We then use a Bayesian analysis to combine our measurement with previous observations, and thereby extract estimates for the individual loss angles of silica and tantala. The testbed described in this article can be used in the future to measure the length noise of cavities formed with novel mirror coating materials and geometries.
I Introduction
Thermal noise is an important fundamental noise source in precision experiments.
In the field of gravitational wave (GW) detection, thermal noise affects instruments such as Advanced LIGO, a large-scale Michelson interferometer with Fabry–Pérot arm cavities 4 km in length. Advanced LIGO will attempt to measure GW-induced spacetime fluctuations with a sensitivity of in the most sensitive band, around 200–500 Hz. It is predicted that this sensitivity will be limited in part by thermal noise in the high-reflectivity coating of the mirrors Harry and the LIGO Scientific Collaboration (2010).
Many groups have developed mathematical models to calculate coating thermal noise Nakagawa et al. (2002); Harry et al. (2002); Somiya and Yamamoto (2009); Hong et al. (2013). However, due to these coatings’ multilayer structure and uncertainties in the thin film material parameters (e.g., Young’s moduli, Poisson ratios, and mechanical loss angles), thermal noise in coatings has not yet been thoroughly understood. For this reason, an experiment which can measure coating thermal noise with high signal-to-noise ratio across a wide frequency band is necessary for a comprehensive verification of their performance.
Previously, direct measurements of thermal noise have been carried out with free-space cavities formed from large, suspended mirrors (e.g., Numata et al. Numata et al. (2003) and Black et al. Black et al. (2004)). The nature of these suspensions is such that thermal noise can be observed only above a few hundred hertz; seismic motion becomes a limiting noise source at frequencies below 100 Hz.
On the other hand, in the field of optical frequency metrology, a fixed spacer Fabry–Pérot cavity is typically used as a stable reference for laser frequency. By designing the shape of the spacer, and searching for vibration-insensitive support points, several groups have demonstrated that the total displacement noise of a rigid cavity can be very close to the thermal noise limit at frequencies around 0.01–1 Hz Ludlow et al. (2007); Alnis et al. (2008); Webster et al. (2008). However, none have reported Brownian thermal noise in the frequency band relevant to ground based GW detectors.
These motivations have led us to develop an experiment that uses fixed-spacer cavities to directly observe thermal noise in mirror coatings from 10 Hz to 1 kHz. We demonstrate a method that can be used to measure thermal noise in SiO2/Ta2O5 quarter-wavelength (QWL) coatings over two decades in frequency.
II Theory of Thermal Noise
In this section we describe the fluctuation-dissipation theorem and its use in calculating thermal noise.
II.1 Fluctuation-Dissipation Theorem
Analysis of thermal noise begins with the fluctuation-dissipation theorem (FDT) Callen and Greene (1952), which states that the more heavily damped a system is when driven by an external force, the noisier it is when sitting in its quiescent state. The single-sided PSD of the system’s generalized displacement is given by
| (1) |
where is the mechanical admittance. We define the system’s mechanical impedance as the complex frequency-domain response , where is the generalized force conjugate to Saulson (1990).
In considering the Brownian noise of a LIGO mirror, Saulson Saulson (1990) found an expression for by computing separately for each of the normal modes contributing to the strain of the mirror. However, this method is computationally expensive, and the result is not guaranteed to converge Levin (1998). Instead of using modal expansion, one can use the so-called “direct approach” to compute . This was introduced by González and Saulson Gonzales and Saulson (1994) for computing thermal noise in suspensions, and was later applied to a laser mirror by Levin Levin (1998). In this approach, one calculates the thermal noise by applying a cyclic force, which causes power dissipation in a lossy system. With the FDT, the dissipated power and the PSD are related by
| (2) |
where is the magnitude of the applied force used to calculate the dissipated power. In the case of a mirror whose position is interrogated by a laser beam, the cyclic “force” applied is a pressure with the same profile as the intensity of the beam.
II.2 Types of Thermal Noise
There are two known sources of thermal noise present in extended solid systems: mechanical loss and thermal dissipation. Mechanical loss is responsible for Brownian noise. Thermal dissipation leads to temperature fluctuation, which in an optical system is converted to position fluctuation via the optic’s coefficient of thermal expansion (CTE) and its thermorefractive coefficient . The noise of this position fluctuation is called thermo-optic noise.
II.2.1 Brownian noise
Mechanical loss arises from the microscopic structure of a material, such as impurities or dislocations. It is represented by introducing an imaginary part to the Young’s modulus of the material: . The quantity is referred to as the loss angle, and in general may have a frequency dependence. When a sinusoidal force is applied to a system with mechanical loss, the dissipated power due to the applied force is
| (3) |
where is the maximum energy of elastic deformation Levin (1998). If one is interested only in frequencies below the first mechanical resonance frequency of the system (as is the case with our reference cavities), it is sufficient to compute the stored energy in the presence of a static force. The problem of evaluating then reduces to a single elastostatics computation, which can be carried out using finite-element analysis (FEA) if necessary. Together with eq. 2, one can then calculate the Brownian contribution to the apparent position fluctuation of the mirror as sensed by a laser beam interrogating the mirror surface.
II.2.2 Thermo-optic noise
In contrast to Brownian noise, thermo-optic noise is related to thermal, rather than mechanical, dissipation; it arises from fluctuation in the temperature field throughout the mirror Zener (1938). To compute thermo-optic noise using the direct approach, one can apply either an imaginary force Liu and Thorne (2000); Somiya and Yamamoto (2009) or imaginary heat Levin (2008); Evans et al. (2008) to the mirror’s surface; the results will be the same if the stress inside the coating is uniform Somiya and Yamamoto (2009). The applied force will cause temperature gradients inside the mirror through the equation of static stress balance. Then, the temperature perturbation evolves according to the thermal diffusion equation (see, e.g., the treatment by Liu and Thorne Liu and Thorne (2000) or Cerdonio et al. Cerdonio et al. (2001)). Finally, the power dissipation due to the heat flow caused by the temperature gradient is given by the expression (Landau and Lifshitz, 1986, eq. 35.1)
| (4) |
Here is the unperturbed temperature of the system and is the temperature perturbation due to the applied force . The entropy of the system changes due to the heat flux , and denotes an average over the period of oscillation of the force. By substituting eq. 4 into eq. 2, we can obtain the temperature fluctuation on the mirror sensed by a Gaussian laser beam. This fluctuation couples into the electromagnetic response of the mirror via the CTE and .
In the literature, the term “thermoelastic noise” refers to the effect from the change in position of the mirror surface due to thermal expansion of a substate and coating Braginsky et al. (1999); Liu and Thorne (2000); Cerdonio et al. (2001); Fejer et al. (2004). On the other hand, “thermorefractive noise” refers to the phase fluctuation of the beam as it propagates through or reflects off the mirror, and it is a combined effect of both the CTE and .
For a Fabry–Pérot cavity with mirrors fabricated from multilayer dielectric coatings, thermorefractive noise in the substrate is much smaller than that in the coating Heinert et al. (2011): the beam passes through each substrate only once, but it reflects off the multilayer coating multiple times as it circulates inside the cavity. Thus, for our experiment, we take thermorefractive noise into account only in the coating. Since both thermoelastic and thermorefractive noises have a common origin, they are computed in a coherent fashion and the combined effect is called thermo-optic noise Evans et al. (2008). For substrates and spacers, only thermoelastic noise will be considered.
III Noise budget for fixed-spacer Fabry–Pérot cavities
| Symb. | Description | Initial cav. | Short cav. |
| Nominal spacer length | 20.3 cm | 3.68(3) cm111Machining specification was inches. | |
| Outer spacer radius | 25.4 mm222LIGO internal document D980670. | 19.0 mm | |
| Inner spacer radius | 6.4 mm2 | 5.1 mm | |
| Mirror substrate radius | 12.7 mm | ||
| Mirror ROC333Uncertainty taken as 0.5% of the nominal. | 500(3) mm | ||
| Laser wavelength | 1064 nm | ||
| Spot size on mirrors444Defined as the radius for which the intensity has fallen by relative to the maximum intensity. Computed as . | 290 m | 182.0(4) m | |
| Finesse | |||
| Power transmission (per mirror) | 300 ppm | ||
| Cavity temperature | 306(1) K | ||
| Substrate Young modulus555The quantities , , etc., for the spacer are taken to the identical to the quantities for the substrate. | 72(1) GPa | ||
| Substrate Poisson ratio | 0.170(5) | ||
| Substrate loss angle | |||
| Subst. therm. conduct. | 1.38 W/(m K) | ||
| Substrate heat capacity | J/(K m3) | ||
| Substrate CTE | K-1 | ||
| Young modulus of silica | 72(1) GPa | ||
| Young modulus of tantala666Nominal value and uncertainty from Crooks et al. (Crooks et al., 2006, tab. 6). | 144(42) GPa | ||
| Silica index of refraction777Values from Evans et al. (Evans et al., 2008, tab. II). | |||
| Tantala index of refraction7 | |||
| Number of coating layers888The first 27 layers are quarter-wavelength, and the top layer is a half-wavelength silica cap. | 28 | ||
| Coat. total thickness999Calculated as . | 4.53(7) m | ||
In this section we present the assumptions and formulas used to generate the thermal noise contributions to the noise budget. Numerical values of the relevant parameters and symbols are given in table 1.
III.1 Mirror substrate noise
III.1.1 Substrate Brownian noise
Levin (Levin, 1998, eq. 2) computed the Brownian noise for a mirror substrate in the limit that the spot size is much smaller than the radius of the mirror:
| (5) |
The spot size is defined as the falloff in intensity. , , and are, respectively, the Young modulus, Poisson ratio, and loss angle of the substrate. Later, Bondu et al. (Bondu et al., 1998, eq. 14) computed corrections to the above formula for the case when is not much smaller than , but we have found that these corrections are not necessary for our system.
III.1.2 Substrate thermoelastic noise
The thermoelastic noise for a mirror substrate was computed by Braginsky et al. Braginsky et al. (1999) for the case of a half-infinite substrate in the adiabatic limit , where is the thermal diffusion length at frequency , and and are, respectively, the thermal conductivity and the heat capacity per unit volume of the substrate. Non-adiabatic corrections for low frequencies and small beam sizes were computed by Cerdonio et al. (Cerdonio et al., 2001, eq. 20):
| (6) |
where , and is a non-elementary function whose asymptotes are for and for ; the full expression is
| (7) |
III.2 Noise in mirror coatings
III.2.1 Coating Brownian noise
The Brownian thermal noise contribution of a thin film on a half-infinite substrate can be expressed as Nakagawa et al. (2002)
| (8) |
where is the total thickness of the coating, and is the coating’s loss angle.
This equation assumes that the elastic properties of substrate and the thin coating are the same, and that all the coating properties are isotropic. Due to the multilayer structure of the amorphous materials, the coating loss and elastic properties may be anisotropic. For this reason, authors such as Harry et al. Harry et al. (2002) decompose coating loss and elastic deformation into parallel () and perpendicular () directions relative to the mirror normal. Then, in accordance with eq. 3, the total dissipated energy can be written as .
However, as argued by Hong et al. Hong et al. (2013), and are not a suitable choice to be consistently used as the loss angles of a material, since the corresponding energies and can sometimes be negative. Instead, should be decomposed into bulk (“B”) and shear (“S”) contributions: .
For SiO2/Ta2O5 coatings, the individual loss angles (either and , or and ) are not well known, and knowledge of the individual material properties is also limited. These uncertainties will propagate forward toward the estimate of the loss angle Hong et al. (2013).
In this work, we assume the equality of and , but we stress that there is no fundamental reason to assume this, nor indeed is there reason to assume equality of the elastic parameters of the substrate and the coating. Nevertheless, if we assume that the coating is described by a single loss angle , and that the elastic properties of the coating and substrate are similar, then the results of Harry et al. Harry et al. (2002) and Hong et al. Hong et al. (2013) reduce to eq. 8. The “coating loss angle” as defined in equation 8 should be viewed not as a physical parameter, but as a figure of merit which is related to the various loss angles and material parameters of each coating material.
III.2.2 Coating thermo-optic noise
An expression for thermo-optic noise in coatings is given by Evans et al. (Evans et al., 2008, eq. 4):
| (9) |
Here is the temperature fluctuation of a bare substrate as sensed by an interrogating beam. In the adiabatic regime, it is given by Levin (2008)
| (10) |
is a correction for in the presence of a coating layer. The term in brackets in eq. 9 determines how temperature flucutation is converted into displacement fluctuation . , , and are the effective thermal expansion coefficient, effective thermorefractive coefficient, and heat capacity per unit volume of the coating. The quantities and are the thermal expansion coefficient and heat capacity per unit volume of the substrate. The complete formalism for computing the various thermal expansion and thermorefractive coefficients is summarized by Evans et al. (Evans et al., 2008, appx. A and B).
Similar to substrate thermoelastic noise, the temperature fluctuation in eq. 10 can be corrected for small beam size and low frequencies by extending the calculation by Braginsky et al. Braginsky et al. (2000). The result is given by Martin (Martin, 2013, §3.3.2):
| (11) |
is a non-elementary function whose asymptotes are for and for . The full expression is
| (12) |
Note that in Evans et al. Evans et al. (2008) is calculated assuming that . For SiO2/Ta2O5 QWL coatings, , as calculated using the material parameters of silica and tantala, along with the formalism described by Evans et al. Evans et al. (2008). For a beam with spot size , this correction factor should still be valid above 25 Hz. However, a thorough calculation has yet to be done.
III.3 Noise in spacer
III.3.1 Spacer Brownian noise
The length fluctuation due to Brownian noise in a cylindrically symmetric spacer of outer radius and inner radius was worked out by Kessler et al. Kessler et al. (2012a), building on earlier work by Numata et al. Numata et al. (2004):
| (13) |
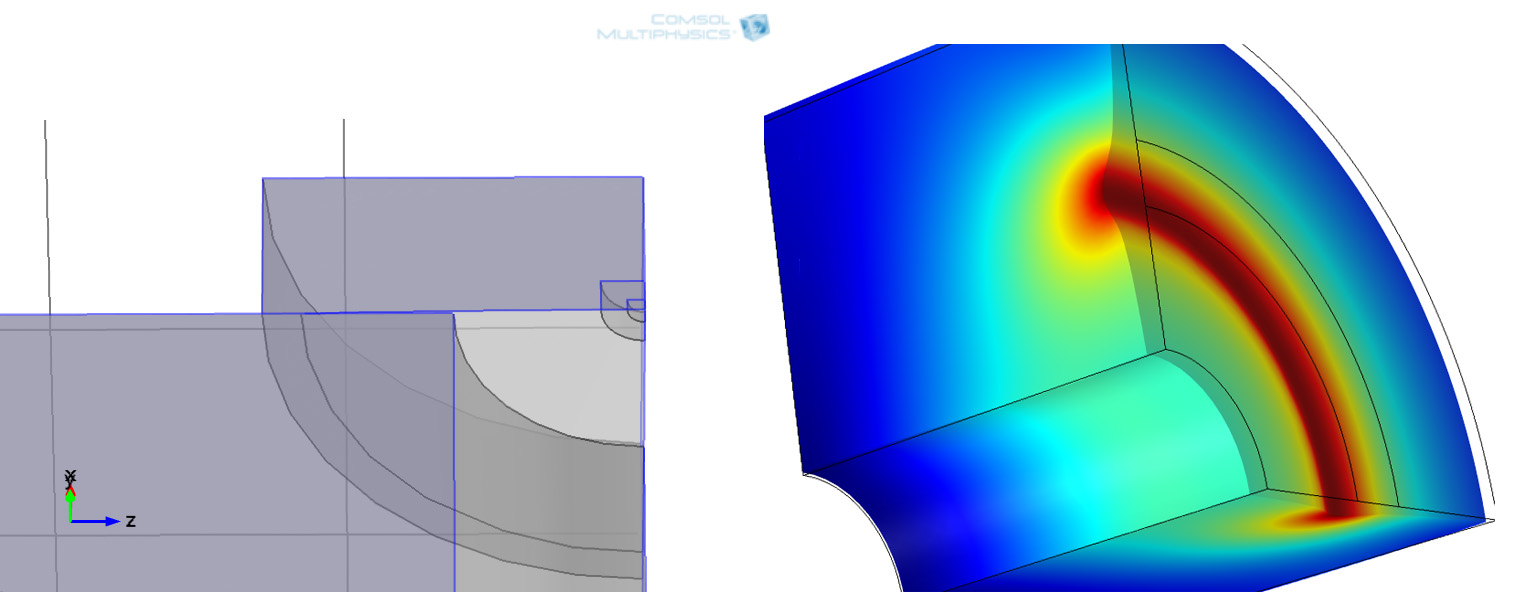
However, this formula assumes that the outer radii of the mirror and the spacer are the same, and are fully contacted. In general, the outer radius of the spacer is larger than the mirror radius, and only a thin annulus on the outer edge of the mirror is optically contacted to the spacer. To estimate the Brownian noise more accurately, an FEA simulation along with the direct approach is used to calculate the stored elastic energy (see fig. 1). Then, using eq. 2, we obtain the displacement noise. The power spectral density of the displacement noise computed from the FEA is about a factor of 2 larger than that of eq. 13.
III.3.2 Spacer thermoelastic noise
To estimate the level of thermoelastic noise in the spacer, we follow the method outlined by Liu and Thorne (Liu and Thorne, 2000, eq. 13):
| (14) |
where is the displacement field of the spacer in response to a static pressure from a force applied to the mirror faces. To evaluate the integral in eq. 14, we use the same FEA model as described above for computing the spacer Brownian noise. The calculation is performed under the adiabatic approximation, since the diffusion length is much smaller than the width of the contact area between the spacer and the mirror. For an annulus with a thickness of 2 mm, the assumption should be valid down to a few millihertz. At very low frequencies, where the assumption on is not satisfied, the expected thermoelastic noise is smaller than the adiabatic prediction Cerdonio et al. (2001).
III.4 Photothermal Noise
Fluctuation in laser power, either from shot noise or from classical intensity noise, induces a local temperature change in both coating and substrate. Because of the thermal expansion and thermorefractive coefficients of the mirror substrate and the coating, the temperature gradient caused by the absorbed laser power couples into the cavity’s displacement noise. This is called photothermal noise. As with thermo-optic noise, the effect in the substrate is mostly thermoelastic. This noise source was first considered in a restricted regime by Braginsky et al. Braginsky et al. (1999). The full expression for photothermal noise in a mirror substrate, valid for small beam size and low frequencies, is Cerdonio et al. (2001)
| (15) |
where
| (16) |
and
| (17) |
is the input power fluctuation, is the absorption coefficient of the mirror, and is the cavity pole frequency.
The effects from the coating (both thermoelastic and thermorefractive) were later included in the work of Farsi et al. (Farsi et al., 2012, appendix), who treat all the contributions from substrate and coating coherently. We do not reproduce their formulas here. The effect can be measured directly by modulating the power of the laser and observing the corresponding length change of the cavity.
Generally, relative intensity noise (RIN) in a laser is much higher than its shot noise limit and causes excessive photothermal noise. This will be discussed in section IV.3.
Here, is the RIN-induced photothermal noise for a single mirror of a cavity. The noise on the two mirrors is coherent, and so the total effect on the cavity is . We do not consider photothermal effects in the cavity spacer, since these effects only occur at frequencies below our measurement band.
III.5 Total thermal noise in cavities
Finally, we note that the length noise of a Fabry–Pérot cavity involves the sum of the contributions from two mirrors and a single spacer:
| (18) |
In the subsequent sections, we consider a number of technical and environmental noise sources which must be added to in order to arrive at the experimentally measured noise spectrum.
IV Description of experiment
In this section we describe the testbed we have developed to measure the beat note fluctuation of our cavities.
IV.1 Cavity as a frequency reference
Figure 2 shows a block diagram of a laser that is frequency-locked to a reference cavity using Pound–Drever–Hall (PDH) locking Drever et al. (1983).
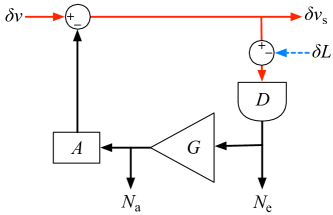
The laser has free-running noise . The frequency discriminator , electronic servo gain , and actuator response combine to produce the open-loop gain . When the loop is engaged, the suppressed frequency noise of the laser becomes
| (19a) | ||||
| (19b) | ||||
Within the loop bandwidth, where the magnitude of the open-loop gain is large, the displacement noise of the cavity is impressed onto the frequency noise of the laser: . The power spectral density of the frequency noise is given by .
To measure the frequency noise of the laser when locked to the cavity, we compare the transmitted beam with another transmitted beam from a similar cavity with an independent, frequency-stabilized laser. Because of the slightly different lengths of the two cavities, the two beams have different frequencies, and . When directed onto an RF photodiode, the combined beam results in a beat note with frequency . The frequency noise of this beat note has a PSD . As described below, we read out this beat note using a phase-locked loop (PLL).
IV.2 Setup
In this section, we describe two experimental setups used for observing coating thermal noise. The first setup measures the noise from two 20.3 cm reference cavities. The second setup, which is conceptually similar to the first one, measures coating thermal noise from two 3.68 cm reference cavities.
IV.2.1 One-laser setup
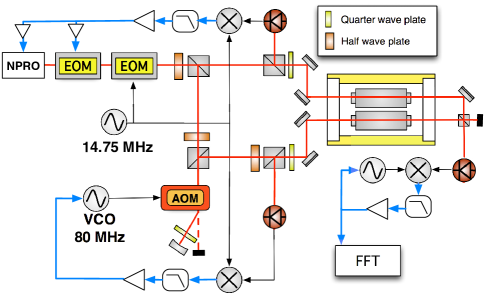
A diagram of the one-laser setup is shown in Figure 3. In this setup, both interrogation beams were provided by a single Nd:YAG non-planar ring oscillator (NPRO) laser with a vacuum wavelength of nm. Approximately 1 mW of light was incident on each cavity, with visibility of more than 0.95. The main beam was frequency-locked to one of the cavities by actuating on the NPRO crystal with a piezo-electric transducer (PZT), as well as actuating on a broadband electro-optic modulator (EOM) placed in the optical path. For the second cavity, part of the laser beam was sent through a double-pass acousto-optic modulator (AOM) in order to frequency-shift the light before entering the cavity. Frequency locking to the second cavity was achieved by actuating on the AOM. Laser light was injected through the vacuum chamber windows and into the cavities, where it was kept resonant via the PDH locking technique. The photodiodes and electronics used to implement the frequency stabilization were designed to achieve a loop with unity-gain frequency (UGF) of nearly 1 MHz, and to have a noise floor below the frequency noise of the cavities. The transmitted beams were recombined and directed onto an RF photodiode, producing an RF beat note measured with a PLL and a spectrum analyzer.
IV.2.2 Test cavities
The reference cavities are formed by optically contacting laser mirrors to cylindrical fused-silica spacers. The mirror substrates are commercially available fused silica with a 25.4 mm diameter and 6.4 mm thickness, and with a 0.5 m radius of curvature (ROC). The coatings were fabricated by Research Electro-Optics via ion-beam sputtering. They consist of 28 alternating layers of silica (SiO2) and tantala (Ta2O5). The first 27 layers are each deposited to a thickness of , where is the refractive index of the layer material. The final layer is silica, and in order to give the appropriate interference condition it is deposited to a thickness of . The transmission of each mirror is approximately 300 ppm. Using these mirrors, we initially constructed two symmetric cavities using fused-silica spacers with length cm. Both substrates and spacers are made of fused silica because of its low mechanical loss and small thermal expansion coefficients.
Each cavity is fitted with a pair of O-rings close to the cavity’s Airy points. Each cavity sits on a pair of teflon blocks with a semicircular cut, and each block has a transverse V-shaped groove to keep an O-ring in place. The cavities are placed side by side on a double-stack seismic isolation platform. The resonances of this platform all lie below 10 Hz. The cavities and the platform are housed inside a temperature-stabilized vacuum chamber with the pressure below torr. The use of a single platform and chamber endows the beat measurement with some amount of common-mode rejection of seismic and ambient temperature noise. The optical table for the setup sits on pneumatic legs which have a resonant frequency around 1 Hz.
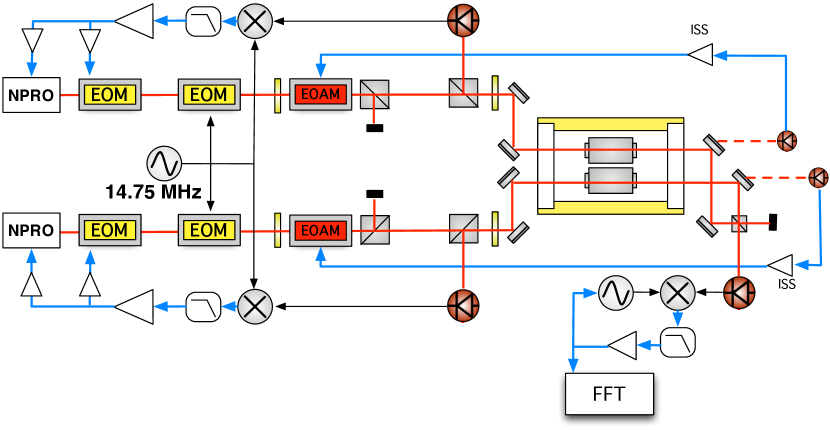
IV.2.3 Two-laser setup
We found that the one-laser setup discussed above produced a measurement with a low signal-to-noise ratio. Therefore, we subsequently constructed two shorter cavities using similar mirrors from the same coating run and developed a two-laser setup shown in Figure 4. The use of shorter cavities increases the observed frequency noise, since for small cavity length fluctuations. There were several considerations that placed a lower limit for the allowable length of the new cavities. First, it should be possible to use a heater to tune each cavity length by half of a free spectral range, so that the beat note can be brought within the bandwidth of the readout photodiode. A cavity that is too short would require excessive heating in order to achieve this. Additionally, the cavity must form a stable optical resonator. Finally, the length must be chosen so that no low-order transverse laser modes resonate simultaneously with the TEM00 mode. With these considerations in mind, we chose a cavity length of 3.68 cm.
In addition, compared to the previous, longer cavities, these cavities have a smaller spot size. The combined effects of shorter length and smaller spot size mean that the observed coating Brownian noise should increase by a factor of 9, in accordance with eq. 8.
This setup is symmetric; the PDH error signal from each cavity is used to actuate on an independent NPRO and on a broadband EOM. The use of two lasers also allows larger possible range for the beat frequency; in the previous setup, this was constrained by the operational range of the AOM.
For each path, 1 mW of light is incident on each cavity. The visibilities of both cavities exceed 0.9, indicating that the incident beams have a nearly Gaussian spatial mode and that the cavities are close to critically coupled.
In this setup, the relative intensity noise (RIN) in both cavities becomes uncorrelated, and so an intensity stabilizion system (ISS) is required. In each path, an electro-optic amplitude modulator (EOAM) is used to suppress the laser’s RIN, and thereby decrease the photothermal noise to below the estimated thermal noise of the coatings.
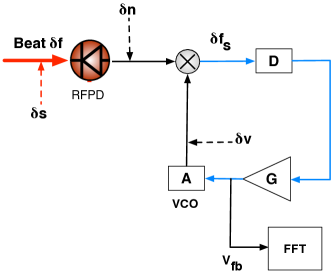
IV.2.4 Beat note frequency readout
To read out the beat note frequency, we use a phase-locked loop (PLL). A block diagram for the PLL is shown in fig. 5.
The two transmitted beams are directed onto a single RF photodiode, where they beat against each other to produce an RF signal at approximately 100 MHz. This signal is mixed with a voltage-controlled oscillator (VCO) of similar frequency and then low-passed at several megahertz, producing a baseband signal. We then amplify this signal (labeled in the diagram) and use it as a control signal to actuate on the VCO, thereby forming a phase-locked loop. This control signal gives a linear readout of the frequency noise of the beat note, which is the incoherent sum of the displacement noise from the two cavities. The calibration to convert the voltage to frequency fluctuation is measured by observing the output frequency of the VCO while varying the input voltage. The open loop gain of our PLL has a UGF of 50 kHz.
IV.3 Technical and environmental noise sources
Both setups discussed in the previous section have similar technical and environmental noise sources.
IV.3.1 Seismic and vibrational noise
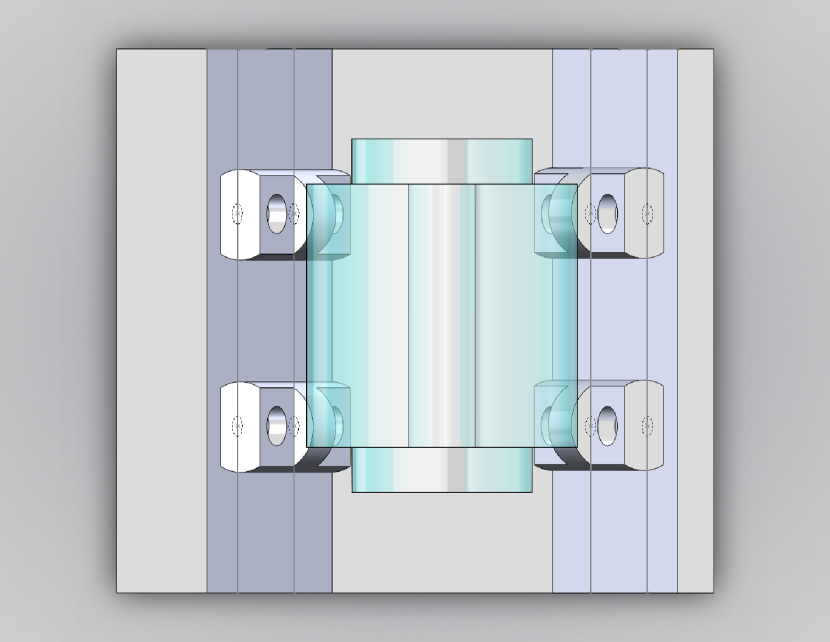
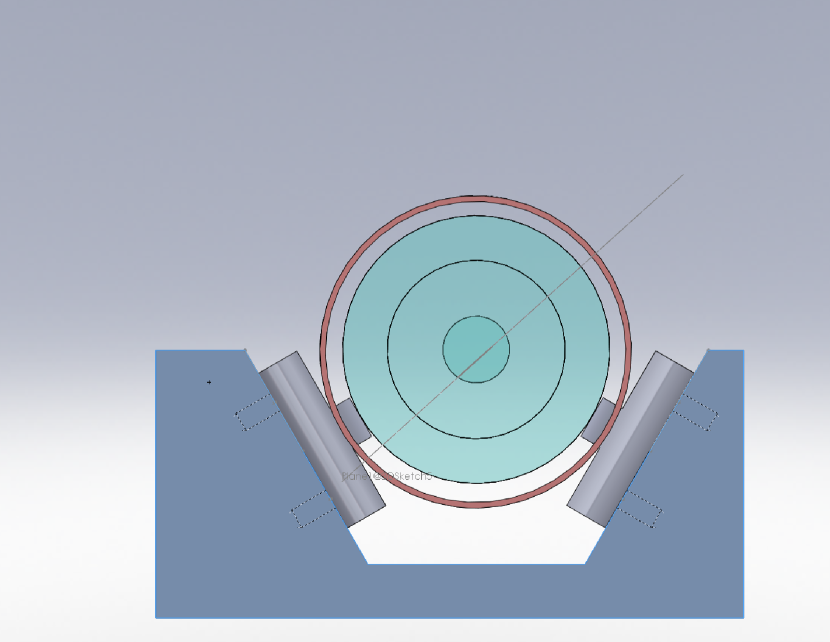
Cavity bending due to vibration is known to cause significant displacement noise in a reference cavity. To minimize this effect, some groups have explored different methods for supporting laser reference cavities—for example, by cutting or drilling support points into the spacer, or by holding the cavity vertically Nazarova et al. (2006); Webster et al. (2007); Millo et al. (2009). Based on our previous experience and FEA of the seismic coupling, we determined that the direct seismic coupling could be kept small enough with horizontal cavities with nodal supports.
In the two-laser setup, each cavity is mounted on four supports cut from cylindrical rods and placed orthogonally to the spacer to achieve approximately a point contact. The support geometry is shown in Fig. 6. The rods are made from polyether ether ketone (PEEK) because of its compatibility with high vacuum. The support positions were chosen based on ease of machining and on FEA of the susceptibility of the cavity to seismic noise. At the chosen spot, if we take mounting errors ( mm) and common mode rejection into account, the coupling from acceleration into cavity strain is estimated to be .
IV.3.2 PDH shot noise
For each cavity, the ultimate lower limit to the laser’s frequency noise suppression is set by the shot noise of the light falling on the RF photodiode when the cavity is on resonance. The PSD of this lower limit is Fritschel et al. (1998); Adhikari (2004)
| (20) |
where is the Planck constant, is the phase modulation index ( rad for our system), is the visibility, and and are the zeroth and first Bessel functions of the first kind, respectively.
IV.3.3 Residual (RF) Amplitude Modulation
The EOM used to perform the PDH modulation was temperature-stabilized with insulation and a heater, and then the polarization of the beam was adjusted to minimize any residual amplitude modulation (RAM), which can add a false offset to the PDH error signal (see, e.g., the discussion by Ishibashi et al. Ishibashi et al. (2002))
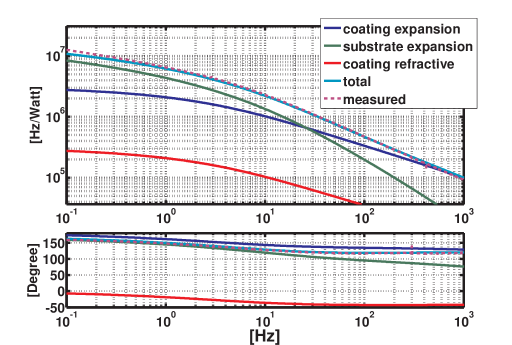
IV.3.4 Photothermal Noise
As discussed in section III, fluctuation in laser power changes the effective cavity length via the thermoelastic and thermorefractive coefficients. In the case of a beam whose intensity fluctuation is shot-noise limited, the photothermal noise is negligible compared to Brownian thermal noise and thermoelastic noise Braginsky et al. (1999). However, for a laser with significant intensity noise above the shot-noise limit, the photothermal noise can be much higher. In the case of the one-laser setup, this excess photothermal effect appears in both cavities as a common-mode noise. However, this is not the case for the two-laser setup, and so the photothermal effect has to be carefully characterized and factored into the noise budget. By using the EOAM in each path to modulate the input power (see Fig. 4), we can observe the corresonding modulation in the beat note frequency using the PLL readout. As shown in Figure 7, the results are comparable with the calculations given in Farsi, et al. Farsi et al. (2012) with the assumption of 5 ppm absorption on each mirror. Together with the measured RIN in the transmitted cavity beams, the estimated frequency noise due to RIN-induced photothermal noise can be added to the noise budget.
IV.3.5 PLL noise
Noise sources add into the PLL at several points in the loop, as shown in Figure 5. In the photodiode, there is shot noise from the photocurrent () and electronic noise from the internal amplifier (). Additionally, there is frequency noise from the VCO (). We have measured these noises and included them in the noise budget.
V Results
The measured PSD of the beat note frequency fluctuation is given by the sum of the cavity length noise from both cavities, as well as the technical frequency noises:
| (21) |
where contains the contributions from the residual frequency noise, PLL readout noise, and seismic noise.

The beat note fluctuation of the 20.3 cm cavities using the one-laser setup is shown in Figure 8. In the band from 90 – 300 Hz, the beat frequency noise has an amplitude spectral density that is approximately , although it is heavily contaminated by peaks. Conversion into single-cavity length noise via gives .
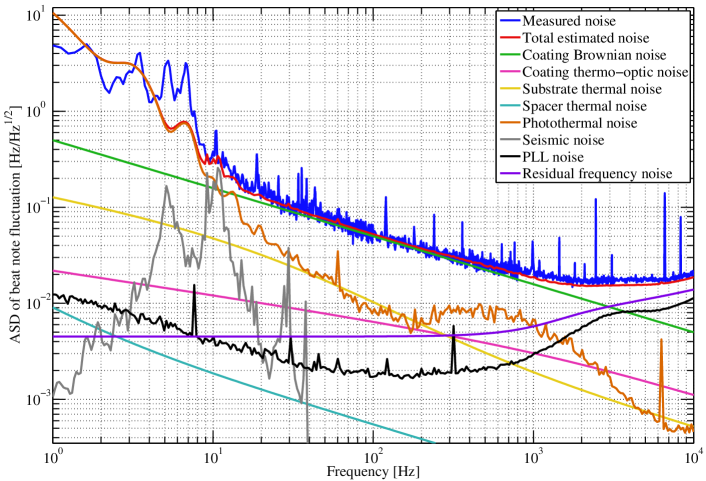
The beat note fluctuation of the 3.7 cm cavities using the two-laser setup is shown in Figure 9, along with all the expected noise terms. In the region from 10 – 1000 Hz, the beat fluctuation has an ASD of approximately , which is equvalent to .
V.0.1 Estimate of
We perform a fit for (defined in equation 8) in the region from 50 – 500 Hz, where the measured ASD appears to be dominated by coating thermal noise. We exclude bins near 60 Hz and its harmonics. We write the total estimated noise as , where is determined from eq. 8. Then we perform a least squares fit of to the functional form , for constant and . We find and . Then from eq. 8, we find .
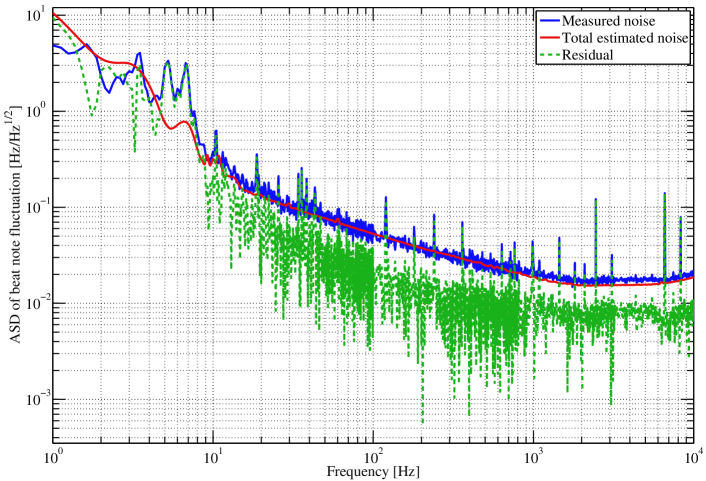
In Figure 10, we plot the measured length noise, the total noise predicted from the noise budget, and the residual, found by performing the quadrature subtraction .
With the fitted loss angle, we calculate the coating thermal noise in the 20.3 cm cavity, and plot it on the noise budget. This is shown in Figure 8. The measurement and the estimate total noise are in good agreement. This is strong evidence that both measurements are dominated by coating thermal noise, since the amplitude of the PSD scales correctly with the spot size. Additionally, our fitted loss angle is in good agreement with the results of Numata et al. Numata et al. (2003), who found . Finally, the shape of the beat note ASD for our two-cavity measurement is close to , as predicted by Eq. 8.
V.0.2 Estimate of and
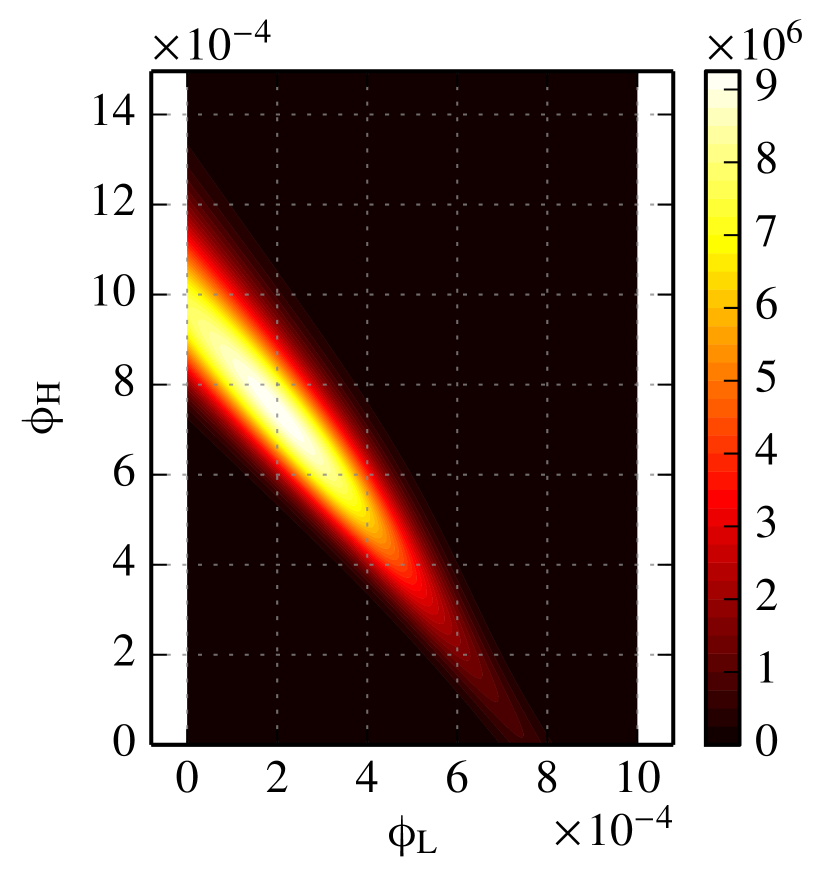
Given , a knowledge of the parameters of our coatings, and prior observations of coating loss angles, we can make a Bayesian estimate of and . To do this, we first write down a formula relating , and :
| (22) |
Here , , , , and . The coefficients and are found by combining Table 1, and Eqs. 94 and 96 from Hong et al. Hong et al. (2013), assuming zero light penetration into the coating 101010For silica/tanala QWL coatings, most of the light penetrates only into the first few doublets. These coefficients depend only on the coating parameters. Next we write down Bayes’s theorem von Toussaint (2011):
| (23) |
where is a normalization. As a prior, we use data from the ringdown measurements in Harry et al. Harry et al. (2002), since these measurements were performed on coatings from the same manufacturer as in our experiment, and were made during a similar time period. Since Harry et al. performed a ringdown measurement, their quoted quantity is distinct from , and is related to the material loss angles and via
| (24) |
We use as the value measured by Harry et al. 111111Harry originally determined using a coating thickness that was 5 times the actual value. Taking into account the correction given in Penn et al. Penn et al. (2003), we reanalyze Harry’s ringdown data to arrive at arrive at ..
We then construct the prior
| (25) |
where is a normalization, is related to and via eq. 24, and is found by propagating forward the uncertainties on the material parameters as given in our Table 1.
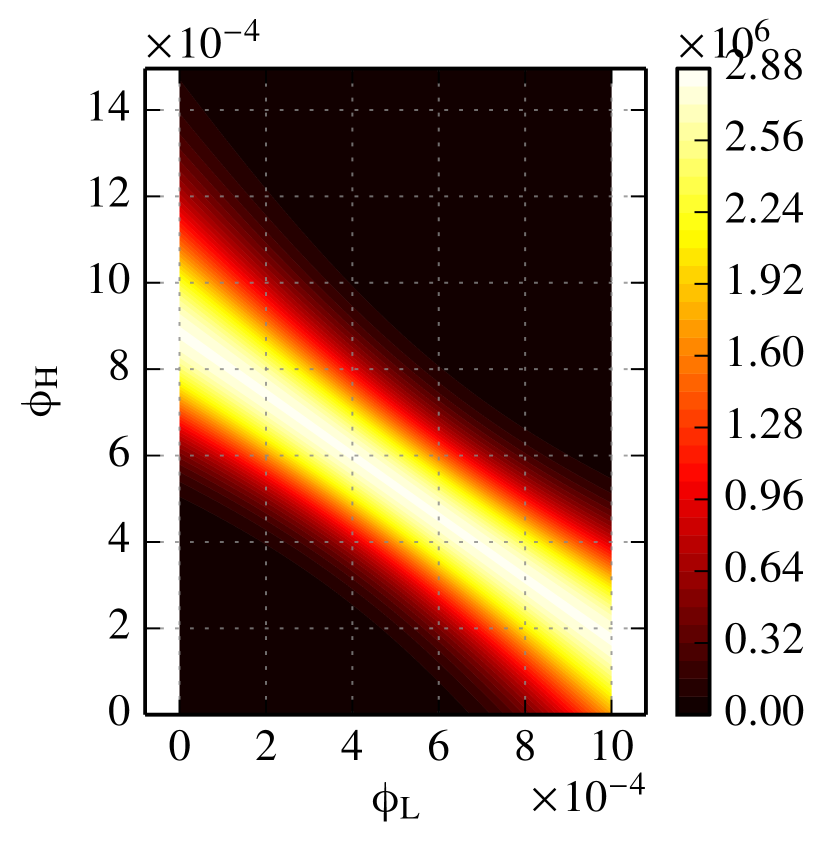
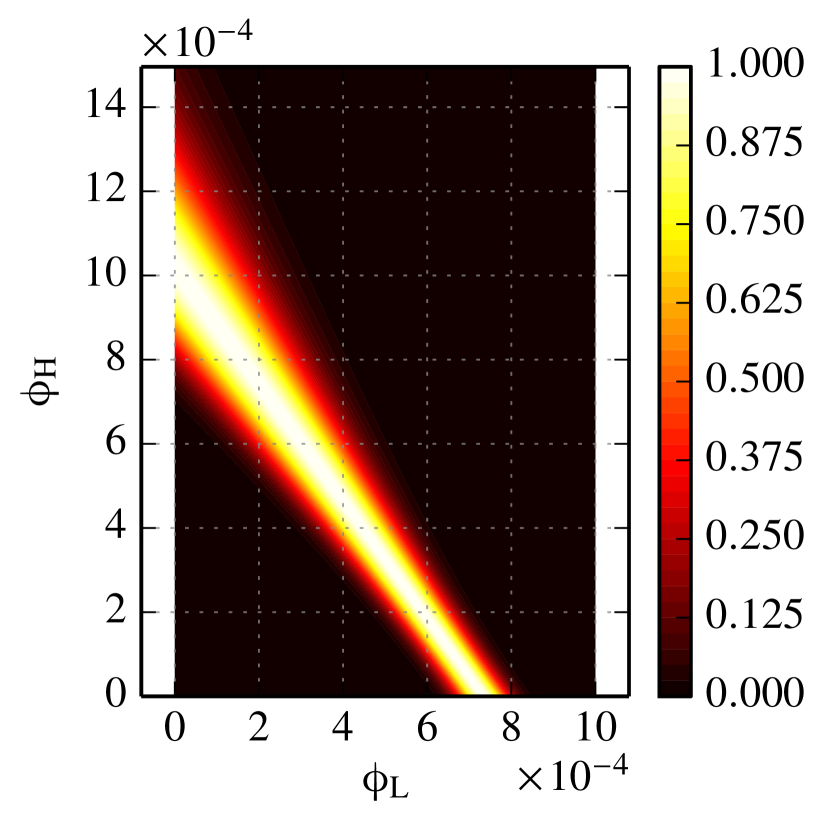
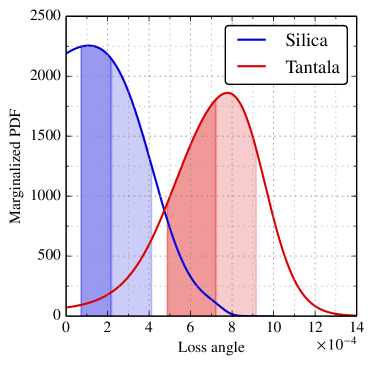
The prior, the likelihood, and the resulting posterior are shown in Figures 11(a)–11(c). In Figure 12, we show the marginalized posterior PDFs for each loss angle. For silica, we find the maximum a posteriori (MAP) estimate for the loss angle is , and the values for the 16th, 50th, and 84th percentiles are , , and , respectively. Likewise, for tantala, the MAP estimate for the loss angle is , and the 16th, 50th, and 84th percentile values are , , and , respectively. The median (50th percentile) estimates for and are in agreement with the values that result from treating eqs. 22 and 24 as a system of two equations in two unknowns and solving for and (and propagating uncertainties accordingly); the results are and , respectively.
VI Conclusions

In summary, we have demonstrated a high-sensitivity system for measuring thermal noise from high-reflectivity silica/tantala coatings. The cavity spacers, the isolation system, the laser stabilization system, and the beat readout have been designed to push down known technical and environmental noise sources to below the expected thermal noise level. Indeed, in the band from 10 Hz to 1 kHz, the measured beat spectrum produces length fluctuation consistent with Brownian noise from the mirror coatings, with a loss angle of .
The estimated loss angles and are high compared to other measurements given in the literature. For example, ringdown measurements by Penn et al. Penn et al. (2003), Crooks et al. Crooks et al. (2004, 2006), and Li et al. Li et al. (2014) found and . It is possible that these newer coatings were manufactured with better fabrication techniques, as manufacturers became more aware of coating thermal noise.
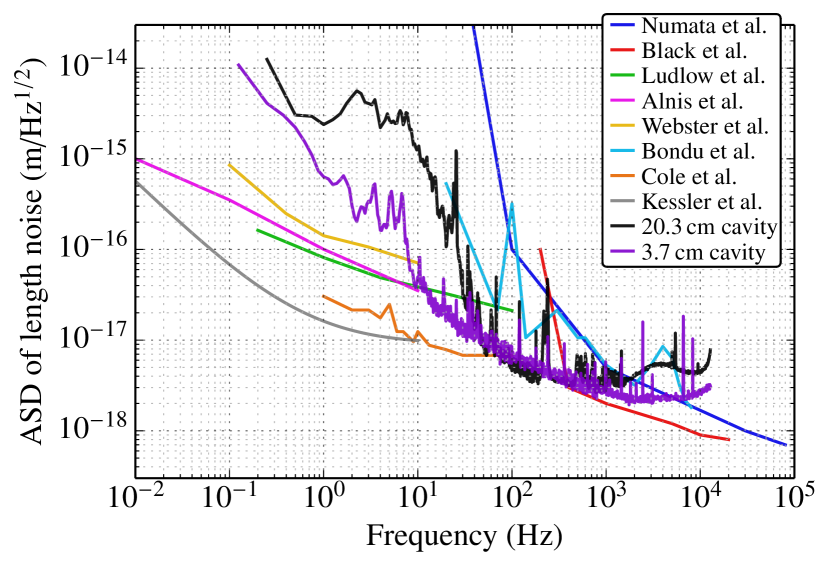
In Figure 13, we plot our measurements, along with measurements from other reference cavities, in both displacement and frequency noise. While other measurements have focused on attaining thermally limited noise performance at low frequencies (100 Hz down to less than 10 mHz) or high frequencies (100 Hz up to 100 kHz), the measurements presented in this paper are consistent with the thermal noise limit in an intermediate frequency band, from 10 Hz to 1 kHz, which is of direct interest to the current and future generations of gravitational wave detectors.
Brownian noise in optical coatings is a significant limit in precision optical measurements because of the high mechanical loss angle in the amorphous coatings. Recent efforts have now begun to focus on other coating materials, such as monocrystalline AlxGa1-xAs heterostructure (AlGaAs). Measurements by Cole et al. Cole et al. (2013) on AlGaAs coatings with quarter-wavelength structures indicate the potential for a smaller thermal noise by almost an order of magnitude compared to that of silica/tantala coatings. The current sensitivity of the testbed mentioned in this paper will need several improvements to be able to measure thermal noise in AlGaAs coating with better SNR. The RIN suppression servo will need to be upgraded to reduce RIN-induced photothermal noise from DC to 30 Hz. To overcome the readout noise from the PLL at frequencies above 1 kHz, another means of frequency noise detection (for example, a homodyne detection system Johannes Eichholz and Michael Hartman (2013); Hartman et al. (2014)) may need to be considered.
Since AlGaAs coatings may be used in third-generation gravitational-wave detectors Adhikari (2014), it is important to characterize all fundamental noises associated with the coatings to thoroughly estimate the detector’s sensitivity. There are still several issues regarding thermal noise calculation in AlGaAs coatings to be explored. First, the current theoretical calculations Hong et al. (2013) of coating Brownian noise may have to be revised to include tensorial components in the elasticity equations; the current calculations assume that coating properties are isotropic in the amorphous thin films. Second, thermo-optic noise in AlGaAs coatings is predicted to be significant due to its high thermo-refactive coefficient. Since GaAs and AlAs have a high thermal conductivity compared to silica/tantala coatings, the assumptions used by Evans et al. Evans et al. (2008) to compute thermo-optic noise will no longer be accurate: corrections for a small spot size and low frequencies will be required. In addition, it seems possible to minimize thermo-optic noise by adjusting the crystalline coating structure Tara Chalermsongsak (prep), so that the limiting noise floor of the coating can be further reduced.
Acknowledgements.
The authors wish to thank Rich Abbott, Daniel Sigg, David Yeaton-Massey, Larry Price, Peter King, Matt Abernathy, Megan Daily, Raphael Cervantes, Sarah Terry, and Nicolas Smith-Lefebvre for useful discussions and technical help. We thank Borja Sorazu for careful reading of the manuscript. LIGO was constructed by the California Institute of Technology and Massachusetts Institute of Technology with funding from the National Science Foundation and operates under cooperative agreement PHY-0757058. This paper has LIGO Document Number LIGO-P1400072.References
- Harry and the LIGO Scientific Collaboration (2010) G. M. Harry and the LIGO Scientific Collaboration, Classical and Quantum Gravity 27, 084006 (2010).
- Nakagawa et al. (2002) N. Nakagawa, A. M. Gretarsson, E. K. Gustafson, and M. M. Fejer, Phys. Rev. D 65, 102001 (2002).
- Harry et al. (2002) G. M. Harry, A. M. Gretarsson, P. R. Saulson, S. E. Kittelberger, S. D. Penn, W. J. Startin, S. Rowan, M. M. Fejer, D. R. M. Crooks, G. Cagnoli, J. Hough, and N. Nakagawa, Classical and Quantum Gravity 19, 897 (2002).
- Somiya and Yamamoto (2009) K. Somiya and K. Yamamoto, Phys. Rev. D 79, 102004 (2009).
- Hong et al. (2013) T. Hong, H. Yang, E. K. Gustafson, R. X. Adhikari, and Y. Chen, Phys. Rev. D 87, 082001 (2013).
- Numata et al. (2003) K. Numata, M. Ando, K. Yamamoto, S. Otsuka, and K. Tsubono, Phys. Rev. Lett. 91, 260602 (2003).
- Black et al. (2004) E. D. Black, A. Villar, K. Barbary, A. Bushmaker, J. Heefner, S. Kawamura, F. Kawazoe, L. Matone, S. Meidt, S. R. Rao, K. Schulz, M. Zhang, and K. G. Libbrecht, Physics Letters A 328, 1 (2004).
- Ludlow et al. (2007) A. D. Ludlow, X. Huang, M. Notcutt, T. Zanon-Willette, S. M. Foreman, M. M. Boyd, S. Blatt, and J. Ye, Opt. Lett. 32, 641 (2007).
- Alnis et al. (2008) J. Alnis, A. Matveev, N. Kolachevsky, T. Udem, and T. W. Hänsch, Phys. Rev. A 77, 053809 (2008).
- Webster et al. (2008) S. A. Webster, M. Oxborrow, S. Pugla, J. Millo, and P. Gill, Phys. Rev. A 77, 033847 (2008).
- Callen and Greene (1952) H. B. Callen and R. F. Greene, Physical Review 86 (1952).
- Saulson (1990) P. R. Saulson, Physical Review D 42 (1990).
- Levin (1998) Yu. Levin, Phys. Rev. D 57, 659 (1998).
- Gonzales and Saulson (1994) G. I. Gonzales and P. R. Saulson, J. Acoust. Soc. Am. 96 (1994).
- Zener (1938) C. Zener, Phys. Rev. 53, 90 (1938).
- Liu and Thorne (2000) Y. T. Liu and K. S. Thorne, Phys. Rev. D 62, 122002 (2000).
- Levin (2008) Y. Levin, Physics Letters A 372, 1941 (2008).
- Evans et al. (2008) M. Evans, S. Ballmer, M. Fejer, P. Fritschel, G. Harry, and G. Ogin, Phys. Rev. D 78, 102003 (2008).
- Cerdonio et al. (2001) M. Cerdonio, L. Conti, A. Heidmann, and M. Pinard, Phys. Rev. D 63, 082003 (2001).
- Landau and Lifshitz (1986) L. D. Landau and E. M. Lifshitz, Theory of Elasticity, 3rd ed. (Oxford, 1986).
- Braginsky et al. (1999) V. Braginsky, M. Gorodetsky, and S. Vyatchanin, Physics Letters A 264, 1 (1999).
- Fejer et al. (2004) M. M. Fejer, S. Rowan, G. Cagnoli, D. R. M. Crooks, A. Gretarsson, G. M. Harry, J. Hough, S. D. Penn, P. H. Sneddon, and S. P. Vyatchanin, Phys. Rev. D 70, 082003 (2004).
- Heinert et al. (2011) D. Heinert, A. G. Gurkovsky, R. Nawrodt, S. P. Vyatchanin, and K. Yamamoto, Phys. Rev. D 84, 062001 (2011).
- Crooks et al. (2006) D. R. M. Crooks, G. Cagnoli, M. M. Fejer, G. Harry, J. Hough, B. T. Khuri-Yakub, S. Penn, R. Route, S. Rowan, P. H. Sneddon, I. O. Wygant, and G. G. Yaralioglu, Classical and Quantum Gravity 23, 4953 (2006).
- Bondu et al. (1998) F. Bondu, P. Hello, and J.-Y. Vinet, Physics Letters A 246, 227 (1998).
- Braginsky et al. (2000) V. Braginsky, M. Gorodetsky, and S. Vyatchanin, Physics Letters A 271, 303 (2000).
- Martin (2013) M. J. Martin, Quantum Metrology and Many-Body Physics: Pushing the Frontier of the Optical Lattice Clock, Ph.D. thesis, University of Colorado (2013).
- Kessler et al. (2012a) T. Kessler, T. Legero, and U. Sterr, J. Opt. Soc. Am. B 29, 178 (2012a).
- Numata et al. (2004) K. Numata, A. Kemery, and J. Camp, Physical Review Letters 93 (2004).
- Farsi et al. (2012) A. Farsi, M. S. de Cumis, F. Marino, and F. Marin, Journal of Applied Physics 111, 043101 (2012).
- Drever et al. (1983) R. Drever, J. Hall, F. Kowalski, J. Hough, G. Ford, A. Munley, and H. Ward, Applied Physics B 31, 97 (1983).
- Nazarova et al. (2006) T. Nazarova, F. Riehle, and U. Sterr, Applied Physics B 83, 531 (2006).
- Webster et al. (2007) S. A. Webster, M. Oxborrow, and P. Gill, Phys. Rev. A 75, 011801 (2007).
- Millo et al. (2009) J. Millo, D. V. Magalhães, C. Mandache, Y. Le Coq, E. M. L. English, P. G. Westergaard, J. Lodewyck, S. Bize, P. Lemonde, and G. Santarelli, Phys. Rev. A 79, 053829 (2009).
- Fritschel et al. (1998) P. Fritschel, G. González, B. Lantz, P. Saha, and M. Zucker, Physical Review Letters 80, 3181 (1998).
- Adhikari (2004) R. Adhikari, Sensitivity and Noise Analysis of 4 km Laser Interferometric Gravitational Wave Antennae, Ph.D. thesis, Massachusetts Institute of Technology (2004).
- Ishibashi et al. (2002) C. Ishibashi, J. Ye, and J. Hall, in Quantum Electronics and Laser Science Conference, 2002. QELS ’02. Technical Digest. Summaries of Papers Presented at the (2002) pp. 91–92.
- Note (1) For silica/tanala QWL coatings, most of the light penetrates only into the first few doublets.
- von Toussaint (2011) U. von Toussaint, Rev. Mod. Phys. 83, 943 (2011).
- Note (2) Harry originally determined using a coating thickness that was 5 times the actual value. Taking into account the correction given in Penn et al. Penn et al. (2003), we reanalyze Harry’s ringdown data to arrive at arrive at .
- Cole et al. (2013) G. D. Cole, W. Zhang, M. J. Martin, J. Ye, and M. Aspelmeyer, Nature Photonics 7, 644 (2013).
- Kessler et al. (2012b) T. Kessler, C. Hagemann, C. Grebing, T. Legero, U. Sterr, F. Riehle, M. Martin, L. Chen, and J. Ye, Nature Photonics 6, 687 (2012b).
- Penn et al. (2003) S. D. Penn, P. H. Sneddon, H. Armandula, J. C. Betzwieser, G. Cagnoli, J. Camp, D. R. M. Crooks, M. M. Fejer, A. M. Gretarsson, G. M. Harry, J. Hough, S. E. Kittelberger, M. J. Mortonson, R. Route, S. Rowan, and C. C. Vassiliou, Classical and Quantum Gravity 20, 2917 (2003), arXiv:gr-qc/0302093 .
- Crooks et al. (2004) D. R. M. Crooks, G. Cagnoli, M. M. Fejer, A. Gretarsson, G. Harry, J. Hough, N. Nakagawa, S. Penn, R. Route, S. Rowan, and P. H. Sneddon, Classical and Quantum Gravity 21, S1059 (2004).
- Li et al. (2014) T. Li, F. A. Aguilar Sandoval, M. Geitner, G. Cagnoli, V. Dolique, J. Degallaix, R. Flaminio, D. Forest, M. Granata, C. Michel, N. Morgado, L. Pinard, and L. Bellon, ArXiv e-prints (2014), arXiv:1401.0184 .
- Johannes Eichholz and Michael Hartman (2013) Johannes Eichholz and Michael Hartman (LVC meeting, Hannover, Germany, 2013).
- Hartman et al. (2014) M. Hartman, J. Eichholz, P. Fulda, G. Ciani, D. B. Tanner, and G. Mueller, Bulletin of the American Physical Society 59 (2014).
- Adhikari (2014) R. X. Adhikari, Rev. Mod. Phys. 86, 121 (2014).
- Tara Chalermsongsak (prep) R. X. A. Tara Chalermsongsak, Garrett D. Cole, (in prep.).
- Bondu et al. (1996) F. Bondu, P. Fritschel, C. N. Man, and A. Brillet, Optics Letters 21, 582 (1996).