Linking Ly and Low-Ionization Transitions at Low Optical Depth 111Based on observations made with the NASA/ESA Hubble Space Telescope, obtained at the Space Telescope Science Institute, which is operated by the Association of Universities for Research in Astronomy, Inc., under NASA contract NAS 5-26555. These observations are associated with programs GO-13293 and GO-12928.
Abstract
We suggest that low optical depth in the Lyman continuum (LyC) may relate the Ly emission, C ii and Si ii absorption, and C ii* and Si ii* emission seen in high-redshift galaxies. We base this analysis on Hubble Space Telescope COS spectra of four Green Pea (GP) galaxies, which may be analogs of Ly emitters (LAEs). In the two GPs with the strongest Ly emission, the Ly line profiles show reduced signs of resonant scattering. Instead, the Ly profiles resemble the H line profiles of evolved star ejecta, suggesting that the Ly emission originates from a low column density and similar outflow geometry. The weak C ii absorption and presence of non-resonant C ii* emission in these GPs support this interpretation and imply a low LyC optical depth along the line of sight. In two additional GPs, weak Ly emission and strong C ii absorption suggest a higher optical depth. These two GPs differ in their Ly profile shapes and C ii* emission strengths, however, indicating different inclinations of the outflows to our line of sight. With these four GPs as examples, we explain the observed trends linking Ly, C ii, and C ii* in stacked LAE spectra, in the context of optical depth and geometric effects. Specifically, in some galaxies with strong Ly emission, a low LyC optical depth may allow Ly to escape with reduced scattering. Furthermore, C ii absorption, C ii* emission, and Ly profile shape can reveal the optical depth, constrain the orientation of neutral outflows in LAEs, and identify candidate LyC emitters.
Subject headings:
Galaxies: high-redshift — Galaxies: starburst — Intergalactic medium — Line: profiles — Radiative transfer — Ultraviolet: ISM1. Introduction
Lyman continuum (LyC) radiation from star-forming galaxies likely caused the reionization of the universe (e.g., Bouwens et al., 2012), but to date, studies have identified few galaxies that are LyC emitters (LCEs; e.g., Leitherer et al., 1995; Heckman et al., 2001; Leitet et al., 2013; Nestor et al., 2013). At low redshift, the Green Pea (GP) galaxies, starbursts characterized by intense [O iii] 5007 emission, have emerged as LCE candidates (Jaskot & Oey, 2013; Verhamme et al., 2014, hereafter V14). The high [O iii]/[O ii] ratios of the GPs imply an extreme ionization parameter. However, since optically thin nebulae should underproduce [O ii] (e.g., Giammanco et al., 2005; Pellegrini et al., 2012), these high ratios may also indicate a low LyC optical depth. Notably, the GPs share several properties with Ly emitters (LAEs) at , including high specific star formation rates, compact sizes, low extinction, and elevated [O iii]/[O ii] ratios (e.g., Hagen et al., 2014; Malhotra et al., 2012; Gawiser et al., 2007; Nakajima & Ouchi, 2013). Thus, the GPs may be outstanding analogs of both high-redshift LyC-emitting and Ly-emitting galaxies.
Some LAEs are known LCEs (e.g., Iwata et al. 2009; Nestor et al. 2013, but see Vanzella et al. 2010), and several studies have proposed a connection between Ly emission and a low LyC optical depth (e.g., Shapley et al. 2003; Nakajima & Ouchi 2013; V14). Due to the resonant nature of Ly, most galaxies have low Ly escape fractions (e.g., Hayes et al., 2011). The geometry and kinematics of the neutral interstellar medium (ISM) appear to control the Ly escape fraction (e.g., Giavalisco et al., 1996; Thuan & Izotov, 1997; Kunth et al., 1998), with low neutral gas covering fractions and strong outflows enabling Ly escape (e.g., Shapley et al., 2003; Kornei et al., 2010). While many numerical models have considered the effects of strong scattering through the ISM or outflows on Ly line profiles (e.g., Ahn et al., 2000; Zheng & Miralda-Escudé, 2002; Verhamme et al., 2006; Orsi et al., 2012), recent studies have focused on Ly radiative transfer through an optically thin medium (Behrens et al. 2014; V14). By driving outflows and ionizing the surrounding ISM and circumgalactic medium, feedback from the intense star formation in some galaxies, like the GPs, may create optically thin conditions that enable LyC and Ly escape.
In this Letter, we suggest that LyC optical depth and outflow geometry link the Ly profiles, C ii absorption, and C ii* emission observed in high-redshift galaxies. We demonstrate this connection using Hubble Space Telescope (HST) Cosmic Origins Spectrograph (COS) observations of four of the most extreme GPs, galaxies that closely resemble high-redshift LAEs. We report the detection of Ly emission in all four GPs. Three GPs show P-Cygni Ly line profiles; the profile shapes and equivalent widths (EWs) Å in two GPs imply a relatively low optical depth. We also suggest that the enigmatic non-resonant emission in C ii* and Si ii* that is observed to correlate with Ly emission from starbursts is consistent with the geometry, optical depth, and viewing orientation associated with the GPs’ galactic outflows. We will show that the Ly emission strengths, Ly profile shapes, and weak interstellar absorption lines in two GPs demonstrate that some starbursts with high [O iii]/[O ii] may be optically thin to the LyC.
2. Results
We present HST COS spectra of two GPs (J081552.00+215623.6 and J145735.13+223201.8) and analyze archival observations for two additional GPs (J121903.98+152608.5 and J030321.41-075923.2). Jaskot & Oey (2013) identify these four starbursts as LCE candidates due to their high [O iii]/[O ii] ratios. All four GPs have similar optical spectra, metallicities ( Z☉), extinctions (), and young ages (H EW Å), but differ markedly in their UV spectra (Figures 1 and 2; Table 1). We bin the COS spectra to Å per pixel, the resolution for emission at the GPs’ NUV half-light radii (Table 1), as measured from the COS acquisition images (e.g., James et al., in prep). Galactic Si ii 1526.71 absorption lines show that the wavelength scale is accurate to within one binned pixel. At the GPs’ redshifts, the COS aperture samples 6-8 kpc and fully encompasses the detected NUV emission. However, Ly emission may originate at larger radii (e.g., Hayes et al., 2013). Based on the GPs’ NUV Petrosian radii (Petrosian, 1976) at the surface brightness level and the average ratio of Ly radii to FUV radii in Hayes et al. (2013), we expect the COS aperture to capture all of the Ly emission. Even adopting the ratio for the most extended Ly halo in Hayes et al. (2013), the COS aperture should probe of the Ly Petrosian radius and recover most of the Ly flux. We use the redshifts given in the Sloan Digital Sky Survey (SDSS) Data Release 9 (Ahn et al. 2012), which are based on the GPs’ optical emission lines. We adopt a cosmology with km s Mpc-1, , and .
2.1. Ly Emission
In the conventional scenario for Ly emission, Ly scatters many times before escaping, which significantly alters and broadens the original line profile. However, the Ly profiles in the two GPs with the highest [O iii]/[O ii] ratios, J0816+22 and J1219+15, do not show the predicted effects of radiative transfer at high column density. The Ly profiles in these two GPs resemble a Gaussian with P Cygni-like absorption superimposed at the systemic velocity; both galaxies have a small separation (300 km s) of the Ly peaks, (Figure 1), as expected for a neutral column density cm-2 and optical depth at the Lyman edge (V14). Indeed, V14 note that a density-bounded scenario could explain the Ly profile of J1219+15.
In contrast, the Ly profiles in the other two GPs, J0303-08 and J1457+22, are consistent with higher Ly optical depths. J0303-08 exhibits a classic P-Cygni profile, with deeper, blue-shifted absorption, a weaker blue peak, and a greater separation of the emission peaks (Figure 1c) than J0816+22 and J1219+15, implying a higher optical depth. This GP appears slightly more extended than the others and consists of multiple UV-emitting knots; thus, the COS aperture may miss some of the scattered emission. J1457+22 appears to have the highest line-of-sight column density, as indicated by the 750 km s velocity separation of its emission peaks and the broad absorption trough extending to either side of the Ly emission (Figure 1d). The weak, double-peaked profile of J1457+22 resembles models of Ly emission from highly inclined galaxies (Verhamme et al., 2012).
The P-Cygni Ly profiles of J0816+22, J1219+15, and J0303-08 are strikingly similar to H emission line profiles observed from stellar sources, such as symbiotic binaries (e.g., Fig. 4 of Burmeister & Leedjärv 2009) and luminous blue variables (LBVs; e.g., Fig. 4 of Weis 2003). Double-peaked H emission lines with weakly blue-shifted absorption are particularly common in symbiotic binaries (e.g., Quiroga et al., 2002; Burmeister & Leedjärv, 2009), which consist of a hot compact star interacting with the wind of a red giant. The H emission forms in the gas ionized by the hot star, while self-absorption from neutral gas in the red giant’s wind may cause the central absorption dip (e.g., Ivison et al., 1994; Quiroga et al., 2002). Similar Balmer line profiles arise in LBVs (e.g., Nota et al., 1997; Weis, 2003) and proto-planetary nebulae (e.g., Balick, 1989; Sánchez Contreras et al., 2008). In each of these cases, photons from an expanding ionized region or bipolar outflow encounter cooler surrounding material, often ejected by the central object.
The narrow line profiles of J0816+22 and J1219+15 suggest a lower-than-average Ly optical depth and possible LyC escape. In addition, the Ly profiles’ resemblance to the Balmer line profiles of stellar sources indicates that they may originate from a similar geometry, with a thin layer of neutral hydrogen obscuring a compact ionizing source. As a resonant transition, Ly photons generally experience numerous scatterings. In contrast, the similarity of the GPs’ Ly to emission profiles from a non-resonant transition argues that Ly is escaping relatively unimpeded from these objects, with a reduced number of scatterings.
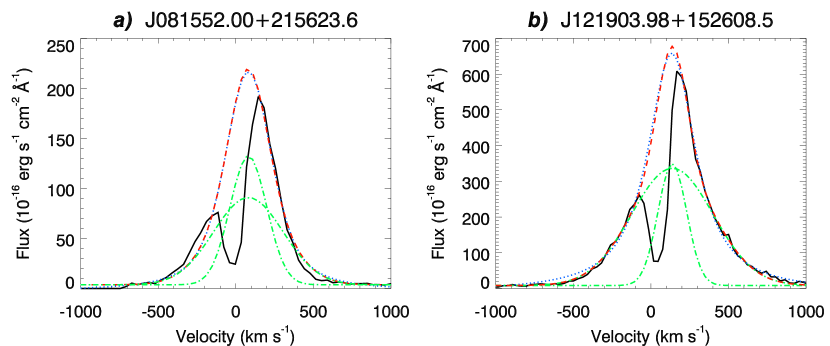
To illustrate this point, we estimate the intrinsic Ly profiles of J0816+22 and J1219+15 from their SDSS H profiles (Figure 3) scaled by the Case B Ly/H ratio of 8.7 (Brocklehurst, 1971). The Ly emission wings extend beyond the estimated intrinsic profiles, suggesting scattered emission. Similarly, scattering likely causes the broad H wings in symbiotic star spectra (e.g., Lee, 2000). The Ly profile still preserves the signature of the intrinsic emission, however, and the Ly peaks are located near or within the intrinsic profile. In Figure 4, we neglect the central absorption and fit the Ly emission of J0816+22 and J1219+15 with a two-component sum of Gaussian functions or with a Voigt profile. Based on the adjusted goodness-of-fit statistic, these models are preferable to a single Gaussian fit, although the improvement is marginal for J0816+22. The narrow components of the double-Gaussian fits have FWHM values of 280 km s for J0816+22 and 220 km s for J1219+15 and the Gaussian components of the Voigt fits have FWHM=230 km s and 100 km s respectively. These velocities are similar to the FWHM of the H profiles: 180 km s for J0816+22 and 150 km s for J1219+15 although these widths are upper limits given the 150 km s SDSS spectral resolution. The narrow peak separations and presence of narrow emission components suggest that Ly photons do not need to scatter to high velocities in order to escape. In addition, the strength of the blue peak indicates that this escape is due to a low column density rather than a high velocity outflow (V14).
A low line-of-sight optical depth is consistent with the high strength of the Ly emission in J0816+22 and J1219+15. These two GPs have rest-frame EWs of 70 Å and 150 Å and Ly escape fractions of 19% and 37%, with our assumed Ly/H ratio of 8.7. Such high EWs are rare at low redshift (e.g., Finkelstein et al., 2009; Cowie et al., 2010), but fall in the range for LAEs at (e.g., Ciardullo et al., 2012). J0303-08 has weaker Ly emission with an EW10 Å and Ly escape fraction of 2%, consistent with its higher optical depth. As expected, the Ly emission of J1457+22 is the weakest, with an escape fraction of .
2.2. Interstellar Absorption and Emission Lines
In stacked spectra of LAEs, the strength of non-resonant emission lines such as Si ii* and C ii* appears to correlate with Ly strength (e.g., Shapley et al., 2003; Berry et al., 2012). The origin of these lines is debated (e.g., Shapley et al., 2003; Erb et al., 2010; Berry et al., 2012), but here, we suggest that they probe the neutral ISM optical depth and geometry. In particular, for the GPs, the behavior of this emission supports the optical depths suggested by the Ly profiles.
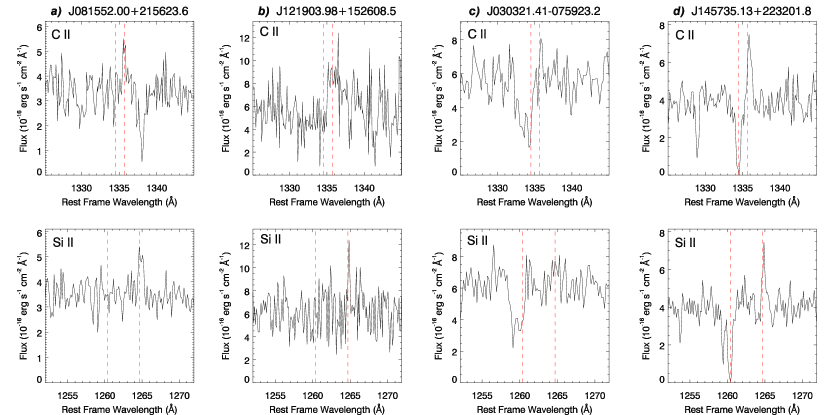
The non-resonant C ii* 1335.7 and Si ii* 1264.7 emission lines form when an excited electron decays to the first fine-structure level above the ground state. These lines share the same upper level as the C ii 1334.5 and Si ii 1260.4 resonant transitions, which appear in absorption in stacked LAE spectra (e.g., Shapley et al., 2003). Since these absorption lines arise in the neutral ISM, their optical depths are related to the LyC optical depth and the ISM metallicity (e.g., Heckman et al., 2001), and they offer an indirect diagnostic of the line-of-sight (LOS) optical depth.
J0816+22 and J1219+15 show no detectable C ii or Si ii absorption, consistent with a low optical depth (Figure 2). As seen in spectra of high-redshift LAEs, both GPs show C ii* and possible Si ii* emission. In contrast, J0303-08 and J1457+22 have clear absorption in C ii and Si ii. The absorption in J0303-08 is broad and blueshifted, implying the presence of an outflow, while the narrow emission and absorption in J1457+22 originate from a relatively static absorbing column. The width of the absorption lines in J0303-08 is not due to a lower spectral resolution, since the C ii and Si ii absorption lines are four times wider than the observed Milky Way Si ii absorption. J0303-08 also has the lowest metallicity of the four galaxies (Izotov et al., 2011), which implies that the relative absorption strengths in the GPs do not result solely from metallicity effects. J0303-08 and J1457+22 do differ in their C ii* emission, however. While J0303-08 does not have clear C ii* emission, J1457+22 exhibits the strongest C ii* emission of the four GPs. We summarize the spectral line strengths of the GPs in Table 1. In the following discussion, we refer to C ii, but the results are equally applicable to Si ii.
Models for Fe ii transitions developed by Prochaska et al. (2011) suggest an interpretation of the C ii* emission that is entirely consistent with the geometries and optical depths implied by the GPs’ Ly emission and ISM absorption lines. Like Fe ii 2586 and Fe ii* 2612, the non-resonant C ii* and Si ii* transitions have a slightly higher transition probability than the corresponding C ii and Si ii resonant transitions. In a cool gas outflow, each C ii absorption should be balanced by C ii or C ii* emission into a random direction. We will therefore observe the wind component along our LOS in C ii absorption, with weaker C ii* emission. However, neutral gas outside of the LOS to the central starburst will also absorb far-UV photons and emit some of the resulting C ii and C ii* photons into our LOS. This emission from other parts of the wind should partially fill in the C ii absorption and strengthen the C ii* emission. Therefore, the C ii absorption and fluorescent C ii* emission probe the outflow geometry and optical depth.
The lack of C ii absorption and the presence of C ii* emission in J0816+22 and J1219+15 resemble the Prochaska et al. (2011) model for an unobscured UV emission source. In this case, neutral gas located outside the LOS to the starburst absorbs UV radiation and emits C ii* photons into our LOS. C ii 1334.5 emission should be weaker than C ii* 1335.7 due to its lower transition probability and higher chance of absorption. As discussed previously, the Ly profiles of J0816+22 and J1219+15 also suggest minimal absorption along the LOS, as expected for a mostly unobscured source.
J0303-08 shows broad, blue-shifted C ii absorption, but no C ii* emission, similar to expectations for a collimated neutral outflow aligned with the LOS (Prochaska et al., 2011). Neutral, outflowing gas in front of the UV emission source will cause strong C ii absorption. This gas will also produce C ii* emission, but as the gas will emit isotropically, most of the emission will be directed away from our LOS. The weakness of the C ii* emission in J0303-08 would then imply a lack of neutral material outside of the outflow. A high dust optical depth could also suppress the C ii* emission (Prochaska et al., 2011), but the Balmer decrement implies a low extinction in J0303-08 (Jaskot & Oey, 2013). Alternatively, given the larger spatial extent of J0303-08, the C ii*-emitting material may be located at large radii. The COS aperture might not encompass this emission, or the lower resolution at large radii may weaken its detectability. Imaging observations may determine whether neutral gas exists outside our LOS. Regardless, the C ii absorption, deep, blue-shifted Ly absorption trough, and weak Ly emission in J0303-08 are consistent with an optically thick, neutral outflow along the LOS.
While the strongest LAEs (J0816+22 and J1219+15) show C ii* emission, the strongest non-resonant emission lines appear in the weakest LAE, J1457+22. This C ii* detection is unexpected, given the trends with C ii* and Ly strength in stacked spectra, and demonstrates that stacked spectra may not match the real spectra of individual objects. A dense ISM component along the LOS will produce strong C ii absorption and C ii* emission near the systemic velocity (Prochaska et al., 2011), as seen in J1457+22. This scenario fits with our earlier conjecture that J1457+22 is highly inclined to our LOS. The high column density of the absorbing material results in a high optical depth to C ii photons, suppressing their emission, while producing a large supply of C ii* photons that escape. This deep column of neutral gas naturally explains the broad Ly absorption, while the weak, superimposed Ly emission may escape from scattering in a bipolar outflow.
3. Discussion
The geometry of the neutral ISM and its line-of-sight optical depth lead to a close connection between Ly emission, C ii and Si ii absorption, and C ii* and Si ii* emission. Previous studies of stacked spectra of LAEs have found that higher Ly EWs correlate with weaker interstellar absorption lines and stronger Si ii* emission (e.g., Shapley et al., 2003; Berry et al., 2012). The weak absorption lines may indicate that stronger LAEs have lower LyC optical depths (Shapley et al., 2003). In our spectra of individual GPs, we likewise find that the two GPs with the strongest Ly emission may be optically thin to the LyC. Since most of their neutral gas is not located along the LOS to the central starburst, we observe fluorescent C ii* and Si ii* emission with no accompanying C ii and Si ii absorption. This geometry may account for the similar Si ii* emission observed in stacked LAE spectra. The two GPs with weaker Ly emission do appear to have significant neutral gas in front of the starburst, but they differ in their inclinations and geometry. As a result, while both galaxies have C ii and Si ii absorption, only the more inclined GP shows strong C ii* and Si ii* emission. J0303-08 either lacks neutral material to the side, has high extinction, or has neutral material only at large radii. A highly extended geometry would also reduce the Ly emission in J0303-08. If strong C ii absorption is ubiquitous in weak LAEs, but C ii* emission depends on geometry, dust extinction, and inclination, C ii absorption may appear in a stacked spectrum while the C ii* emission is weakened. On the other hand, the wavelength of C ii absorption depends on outflow velocity, whereas C ii* emission should occur near the systemic velocity.
The Ly emission and C ii absorption in the GPs supports the hypothesis that some galaxies with high [O iii]/[O ii] may be LCEs. Two of the four GPs have weak C ii absorption, strong Ly emission, and Ly profiles that resemble Balmer emission from circumstellar ejecta. These properties are consistent with a low LOS optical depth. The presence of fluorescent C ii* emission suggests that these GPs do have excited neutral gas outside the LOS. Therefore, LyC emission may escape anisotropically, and identifying optically thin galaxies will depend on viewing orientation (e.g., Zastrow et al., 2011; Nestor et al., 2011). J1457+22, which appears highly inclined and optically thick along the LOS, may be optically thin in other directions; emission-line imaging may determine its transverse optical depth (e.g., Zastrow et al., 2011).
Ly emission may be an effective diagnostic of LyC optical depth (e.g., V14). A low LyC optical depth should facilitate Ly escape, resulting in higher Ly EWs and Ly line profiles that are less affected by scattering. Five of the eight LAEs studied by Hashimoto et al. (2013) have peak velocities within 200 km s of the systemic velocity, similar to J0816+22 and J1219+15, and suggestive of a low column density. The strong Ly emission and indications of a relatively low optical depth in two GPs suggest that these galaxies are low-redshift analogs of high-redshift LAEs and LCEs.
Some high-redshift starbursts, particularly strong LAEs, may have low neutral column densities. As a result, these LAEs may show narrow Ly profiles, indicating a reduced optical depth. C ii absorption and C ii* emission can probe the orientation and optical depth of neutral outflows in LAEs and, along with Ly profile shape, can help identify candidate LCEs.


| ID | Binning | Ly EW | C ii EWd | C ii* EWd | Si ii EWd | Si ii* EWd | ||||
|---|---|---|---|---|---|---|---|---|---|---|
| (kpc) | (Å pix-1) | (Å) | (km s) | (Å) | (Å) | (Å) | (Å) | |||
| J081552.00 | 0.1410 | 13.7 | 0.4 | 0.17 | 260 | … | 0.2 | … | 0.5 | |
| +215623.6 | ||||||||||
| J121903.98 | 0.1956 | 12.4 | 0.5 | 0.15 | 270 | … | 1.4 | … | 0.3 | |
| +152608.5 | ||||||||||
| J030321.41 | 0.1648 | 9.4 | 0.8 | 0.23 | 440 | -1.3 | … | -1.0 | … | |
| -075923.2 | ||||||||||
| J145735.13 | 0.1487 | 9.8 | 0.5 | 0.18 | 750 | -0.9 | 0.7 | -0.9 | 0.3 | |
| +223201.8 |
a[O iii] 5007,4959/[O ii] 3727 from Jaskot & Oey (2013).
bNUV half-light radius.
cSeparation of Ly peaks.
dBased on Gaussian fits.
eThe surrounding absorption trough causes the negative EW.
References
- Ahn et al. (2012) Ahn, C. P., et al. 2012, ApJS, 203, 21
- Ahn et al. (2000) Ahn, S.-H., Lee, H.-W., & Lee, H. M. 2000, Journal of Korean Astronomical Society, 33, 29
- Balick (1989) Balick, B. 1989, AJ, 97, 476
- Behrens et al. (2014) Behrens, C., Dijkstra, M., & Niemeyer, J. C. 2014, A&A, 563, A77
- Berry et al. (2012) Berry, M., et al. 2012, ApJ, 749, 4
- Bouwens et al. (2012) Bouwens, R. J., et al. 2012, ApJ, 752, L5
- Brocklehurst (1971) Brocklehurst, M. 1971, MNRAS, 153, 471
- Burmeister & Leedjärv (2009) Burmeister, M., & Leedjärv, L. 2009, A&A, 504, 171
- Ciardullo et al. (2012) Ciardullo, R., et al. 2012, ApJ, 744, 110
- Cowie et al. (2010) Cowie, L. L., Barger, A. J., & Hu, E. M. 2010, ApJ, 711, 928
- Erb et al. (2010) Erb, D. K., Pettini, M., Shapley, A. E., Steidel, C. C., Law, D. R., & Reddy, N. A. 2010, ApJ, 719, 1168
- Finkelstein et al. (2009) Finkelstein, S. L., Cohen, S. H., Malhotra, S., & Rhoads, J. E. 2009, ApJ, 700, 276
- Gawiser et al. (2007) Gawiser, E., et al. 2007, ApJ, 671, 278
- Giammanco et al. (2005) Giammanco, C., Beckman, J. E., & Cedrés, B. 2005, A&A, 438, 599
- Giavalisco et al. (1996) Giavalisco, M., Koratkar, A., & Calzetti, D. 1996, ApJ, 466, 831
- Hagen et al. (2014) Hagen, A., et al. 2014, ApJ, 786, 59
- Hashimoto et al. (2013) Hashimoto, T., Ouchi, M., Shimasaku, K., Ono, Y., Nakajima, K., Rauch, M., Lee, J., & Okamura, S. 2013, ApJ, 765, 70
- Hayes et al. (2011) Hayes, M., Schaerer, D., Östlin, G., Mas-Hesse, J. M., Atek, H., & Kunth, D. 2011, ApJ, 730, 8
- Hayes et al. (2013) Hayes, M., et al. 2013, ApJ, 765, L27
- Heckman et al. (2001) Heckman, T. M., Sembach, K. R., Meurer, G. R., Leitherer, C., Calzetti, D., & Martin, C. L. 2001, ApJ, 558, 56
- Ivison et al. (1994) Ivison, R. J., Bode, M. F., & Meaburn, J. 1994, A&AS, 103, 201
- Iwata et al. (2009) Iwata, I., et al. 2009, ApJ, 692, 1287
- Izotov et al. (2011) Izotov, Y. I., Guseva, N. G., & Thuan, T. X. 2011, ApJ, 728, 161
- Jaskot & Oey (2013) Jaskot, A. E., & Oey, M. S. 2013, ApJ, 766, 91
- Kornei et al. (2010) Kornei, K. A., Shapley, A. E., Erb, D. K., Steidel, C. C., Reddy, N. A., Pettini, M., & Bogosavljević, M. 2010, ApJ, 711, 693
- Kunth et al. (1998) Kunth, D., Mas-Hesse, J. M., Terlevich, E., Terlevich, R., Lequeux, J., & Fall, S. M. 1998, A&A, 334, 11
- Lee (2000) Lee, H.-W. 2000, ApJ, 541, L25
- Leitet et al. (2013) Leitet, E., Bergvall, N., Hayes, M., Linné, S., & Zackrisson, E. 2013, A&A, 553, A106
- Leitherer et al. (1995) Leitherer, C., Ferguson, H. C., Heckman, T. M., & Lowenthal, J. D. 1995, ApJ, 454, L19
- Malhotra et al. (2012) Malhotra, S., Rhoads, J. E., Finkelstein, S. L., Hathi, N., Nilsson, K., McLinden, E., & Pirzkal, N. 2012, ApJ, 750, L36
- Nakajima & Ouchi (2013) Nakajima, K., & Ouchi, M. 2013, ArXiv e-prints
- Nestor et al. (2013) Nestor, D. B., Shapley, A. E., Kornei, K. A., Steidel, C. C., & Siana, B. 2013, ApJ, 765, 47
- Nestor et al. (2011) Nestor, D. B., Shapley, A. E., Steidel, C. C., & Siana, B. 2011, ApJ, 736, 18
- Nota et al. (1997) Nota, A., Smith, L., Pasquali, A., Clampin, M., & Stroud, M. 1997, ApJ, 486, 338
- Orsi et al. (2012) Orsi, A., Lacey, C. G., & Baugh, C. M. 2012, MNRAS, 425, 87
- Pellegrini et al. (2012) Pellegrini, E. W., Oey, M. S., Winkler, P. F., Points, S. D., Smith, R. C., Jaskot, A. E., & Zastrow, J. 2012, ApJ, 755, 40
- Petrosian (1976) Petrosian, V. 1976, ApJ, 209, L1
- Prochaska et al. (2011) Prochaska, J. X., Kasen, D., & Rubin, K. 2011, ApJ, 734, 24
- Quiroga et al. (2002) Quiroga, C., Mikołajewska, J., Brandi, E., Ferrer, O., & García, L. 2002, A&A, 387, 139
- Sánchez Contreras et al. (2008) Sánchez Contreras, C., Sahai, R., Gil de Paz, A., & Goodrich, R. 2008, ApJS, 179, 166
- Shapley et al. (2003) Shapley, A. E., Steidel, C. C., Pettini, M., & Adelberger, K. L. 2003, ApJ, 588, 65
- Thuan & Izotov (1997) Thuan, T. X., & Izotov, Y. I. 1997, ApJ, 489, 623
- Vanzella et al. (2010) Vanzella, E., Siana, B., Cristiani, S., & Nonino, M. 2010, MNRAS, 404, 1672
- Verhamme et al. (2012) Verhamme, A., Dubois, Y., Blaizot, J., Garel, T., Bacon, R., Devriendt, J., Guiderdoni, B., & Slyz, A. 2012, A&A, 546, A111
- Verhamme et al. (2014) Verhamme, A., Orlitova, I., Schaerer, D., & Hayes, M. 2014, ArXiv e-prints
- Verhamme et al. (2006) Verhamme, A., Schaerer, D., & Maselli, A. 2006, A&A, 460, 397
- Weis (2003) Weis, K. 2003, A&A, 408, 205
- Zastrow et al. (2011) Zastrow, J., Oey, M. S., Veilleux, S., McDonald, M., & Martin, C. L. 2011, ApJ, 741, L17
- Zheng & Miralda-Escudé (2002) Zheng, Z., & Miralda-Escudé, J. 2002, ApJ, 578, 33