Possible quantum liquid crystal phases of helium monolayers
Abstract
The second-layer phase diagrams of 4He and 3He adsorbed on graphite are investigated. Intrinsically rounded specific-heat anomalies are observed at 1.4 and 0.9 K, respectively, over extended density regions in between the liquid and incommensurate solid phases. They are identified to anomalies associated with the Kosterlitz-Thouless-Halperin-Nelson-Young type two-dimensional melting. The prospected low temperature phase (C2 phase) is a commensurate phase or a quantum hexatic phase with quasi-bond-orientational order, both containing zero-point defectons. In either case, this would be the first atomic realization of the quantum liquid crystal, a new state of matter. From the large enhancement of the melting temperature over 3He, we propose to assign the observed anomaly of 4He -C2 phase at 1.4 K to the hypothetical supersolid or superhexatic transition.
pacs:
67.80.bd, 67.80.K-, 67.80.dm, 67.80.deQuantum liquid crystal (QLC) is a novel state of matter in nature. It is a quantum phase with partially broken rotational and/or translational symmetries and fluidity (or superfluidity) even at 0. The electronic nematic phase, which is conceptually one of the QLCs, is recently being studied in a variety of materials Fradkin et al. (2010); Frey et al. (1994). Atomic or molecular QLCs are more intuitive and direct quantum counterparts of classical liquid crystal. In bosonic systems, superfluid QLC or supersolidity is also expected. Recently the latter possibility has intensively been explored in bulk solid 4He Andreev and Lifshitz (1969); Kim and Chan (2004); *Kim2012PRL; Balibar and Caupin (2008); *Vekhov2014PRL; *cSScomment, and the former is proposed in cold dipolar molecule gases in two dimensions (2D) Wu et al. (2016). The predicted stripe phase of superfluid 3He in slab geometry is a candidate for fermionic QLC Vorontsov and Sauls (2007); Levitin et al. (2013). However, all previous experimental attempts to detect atomic or molecular QLCs have not yet been successful or still are under debate.
Atomic monolayer of helium (He) adsorbed on a strongly attractive graphite surface provides a unique arena to investigate novel quantum phenomena of bosons (4He: spinless) and fermions (3He: nuclear spin ) in 2D. Particularly the prospected commensurate phase in the second layer of He (hereafter the C2 phase) is a hopeful candidate for atomic QLC because of a delicate balance among the kinetic (10 K), He-He interaction (10 K) and corrugated potential energies ( 3 K). The commensurability here is with respect to the triangular lattice of the compressed first He layer. The fermionic QLC might be a new perspective for the gapless quantum spin-liquid nature Ishida et al. (1997); *Fukuyama2000PhysicaB; *Fukuyama2008JPSJ and the anomalous thermodynamic behavior below 100 mK of the 3He -C2 phase Matsumoto et al. (2005); *Murakawa2006AIP alternative to the multiple spin exchange model Roger et al. (1998) or others Fuseya and Ogata (2009); *Watanabe2009JPSJ.
If the 4He -C2 phase is a QLC, the supersolid ground state can be expected. Eventually, two previous torsional oscillator experiments on this system observed a reentrant superfluid response as a function of density below 0.4 K Crowell and Reppy (1996); Shibayama et al. (2009). However, the identification of the phenomenon is left controversial, since the detected superfluid fractions are limited to 0.01–0.02, and the density regions where the superfluid responses are detected are not quantitatively consistent with each other. These are presumably due to the poor connectivity of microcrystallites (platelets) and the existence of heterogeneous surfaces (about 10% of the total Sato et al. (2012)), which results in ambiguity of density scale, in Grafoil substrate they used.
So far, the 4He -C2 phase has been believed to exist from the large specific-heat anomaly observed at K Greywall (1993) in a narrow density range between the liquid (L2) and incommensurate solid (IC2) phases. Although a similar anomaly has been found in 3He, too, at K at one density Van Sciver and Vilches (1978), other details are not known. Instead, the existence of the 3He -C2 phase has been accepted from the various nuclear magnetic properties at low mK Roger et al. (1998); Ishida et al. (1997); *Fukuyama2000PhysicaB; *Fukuyama2008JPSJ.
The previous belief on the 4He -C2 phase has recently been thrown into doubt by the path integral Monte Carlo (PIMC) calculation by Corboz Corboz et al. (2008). Unlike the previous PIMC calculations Abraham et al. (1990); *Manousakis1999PRB; *Takagi2009JPhys, they claimed the instability of the C2 phase against the L2 and IC2 phases, if zero-point (ZP) vibrations of the first layer atoms are explicitly taken into account. Their claim raised serious questions: Are the specific-heat peaks observed in 4He and 3He the same phenomenon related to 2D melting? Isn’t the observed C2 phase stabilized artificially by finite size effects due to the platelet structure of exfoliated graphite substrate?
In this paper, we report results of new high-precision heat-capacity measurements of the second layers of pure 4He and 3He films at temperatures from 0.1 to 1.9 K using a ZYX exfoliated graphite substrate. ZYX is known to have ten times larger platelet size (100–300 nm) Birgeneau et al. (1982); *Niimi2006PRB than Grafoil, a substrate used in all previous works. An average number of He atoms adsorbed on an atomically flat platelet in ZYX is , which is more than times larger than that in the simulation cell of Ref. 25. We obtained unambiguous thermodynamic evidence for the existence of a distinct phase (C2 phase) between the L2 and IC2 phases regardless of system size and for that the phase exists over an extended density range in both isotopes. Our data are consistent with the hypothesis that the C2 phase is an atomic QLC containing ZP defectons. We also discuss the possibility that the 4He -C2 anomaly is associated with a 2D melting transition of Kosterlitz-Thouless-Halperin-Nelson-Young (KTHNY) type Strandburg (1988) intertwined with superfluidity.
The experimental setup used here has been described in detail elsewhere Nakamura et al. (2012). The heat capacity was measured by the heat pulse method with variable constant heat flows. In the following we show only the heat capacity of adsorbed He films after subtracting the addendum (empty cell) and the desorption contribution (see below). The surface area of the ZYX substrate is m2. The vapor pressure of sample is monitored with an in situ capacitive strain gauge.
The much larger platelet size of ZYX than Grafoil is well demonstrated by a two times higher specific heat peak at the order-disorder transition ( K) for the commensurate phase (C1 phase) of 4He adsorbed directly on graphite (see Fig. 1 of Ref. 33; *dExperimentalComment) and for that of 3He as well Nakamura et al. . The commensurability of the C1 phase is with respect to the graphite honeycomb lattice. The critical region is also wider in ZYX being consistent with the finite size scaling. Despite the larger platelet size, ten times smaller specific surface area ( mg) of ZYX causes much larger desorption heat-capacity contribution. This prevents us from analyzing present experimental data with reasonable accuracies at temperatures higher than – and – K for 4He and 3He, respectively.
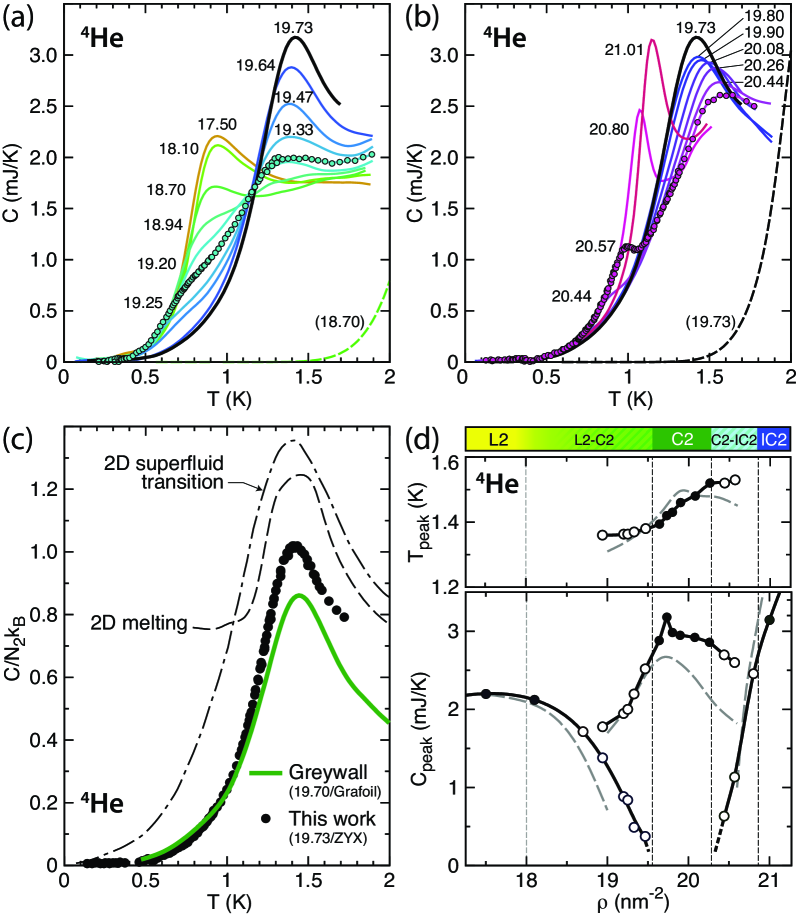
Let us first show dependencies of measured heat capacities () of 4He films. The data taken at densities of 17.50 19.73 nm-2 are shown in Fig. 1(a), and those at 19.73 21.01 nm-2 in Fig. 1(b). Here is the total areal density. Since the first layer has a much higher density or Debye temperature than the second layer, the contribution to is less than 3% in the -range we studied. At the lowest (17.50 nm-2) the system is a uniform 2D liquid. At high , this phase is characterized by a nearly constant slightly less than the value expected for an ideal 2D gas as well as a broad maximum near 0.9 K below which rapidly falls down Greywall (1993); Nakamura et al. . Here is the number of He atoms in the second layer which is calculated from the known first-layer density () vs relation obtained from the neutron scattering data Lauter et al. (1987); *Lauter1991PTSF using the second-layer promotion density of nm-2 Nakamura et al. (2013). For example, nm-2 at 19.73 nm-2.

As increases above nm-2, a new anomaly starts to develop near K, whereas the liquid component gradually decreases. The two features coexist until nm-2. Above nm-2 the liquid component completely disappears leaving only the rounded peak at K which corresponds to the C2 peak observed by Greywall Greywall (1993) using Grafoil substrate. As we further increase , the heat-capacity peak height () becomes largest at 19.73 nm-2 ( ) and then begins to decrease. In Fig. 1(c) the specific heat () data at obtained with ZYX and Grafoil are compared. They look similar except that the ZYX data give a slightly larger around the peak temperature by about . Above 20.44 nm-2 a new peak appears near K. With increasing , the peak grows rapidly in height and temperature up to K coexisting with the C2 anomaly which diminishes gradually keeping fixed. The two features apparently coexist at least until nm-2. This last peak is associated with the melting transition of the IC2 solid Greywall (1993); Nakamura et al. .
In Fig. 1(d) we plot density variations of and as well as those of Greywall Greywall (1993) (dashed lines) who used Grafoil substrate. The phase diagram determined in this work is also shown on the top. Unambiguously, there exists a distinct C2 phase over an extended density region from to nm-2 where we observed only the C2 anomaly (closed circles). The C2 phase is definitely not an experimental artifact caused by finite size effects of substrate since the anomaly is even enhanced slightly with increasing the platelet size by an order of magnitude. Within this C2 region, increases by . The C2 phase is well separated from the L2 and IC2 phases by L2-C2 (18 19.6 nm-2) and C2-IC2 (20.3 nm-2) coexistence regions where we observed the double anomaly feature (open circles). Although the feature is vaguely visible in Greywall’s data at 19.00 and 20.30 nm-2 (see Fig. 3 of Ref. 16), it is much clearer with great details here thanks to finer and grids and the better substrate quality. For example, when approaches from both directions, the L2 and IC2 anomalies destruct preferentially from higher- envelopes keeping common low- envelopes, while the C2 anomaly grows without changing its so much. This unusual behavior can never be expected from the conventional phase separation or domain wall structures.
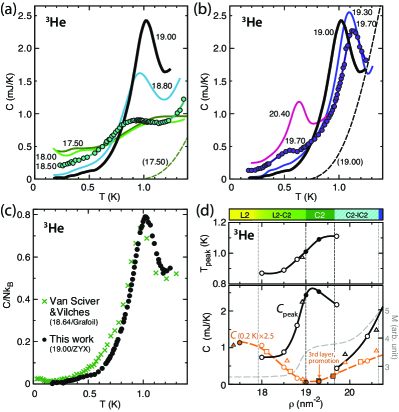
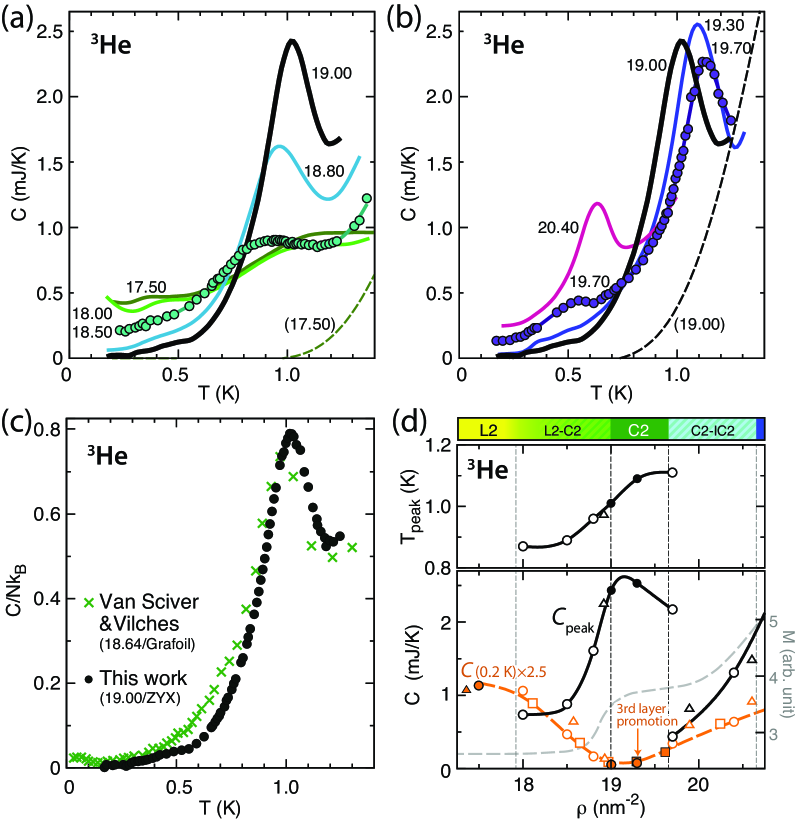
Next we show heat capacity data of the second layer of 3He films at densities of nm-2 in Fig. 2(a) and nm-2 in Fig. 2(b). The density evolution is qualitatively similar to that in 4He. We observed again a clear C2 peak which becomes maximum at nm-2 and – K. This peak is very similar to that observed by Van Sciver and Vilches using Grafoil substrate Van Sciver and Vilches (1978) as compared in Fig. 2(c), indicating almost no size effects. Here we estimated assuming nm-2. The value is evaluated from the second-layer promotion density (0.2 nm-2) Nakamura et al. and the subsequent first-layer compression by 4% Lauter et al. (1987); *Lauter1991PTSF.
In Fig. 2(d) we plot density variations of and for 3He as well as a proposed phase diagram at . The determination of each phase boundary is somewhat ambiguous compared to 4He, because the density grid of measurement is not fine enough here. The double anomaly feature in the coexistence regions is hardly visible due to weakly -dependent large contributions from Fermi liquids in the second and third layers. These contributions are represented by the heat capacity isotherm at K plotted in Fig. 2(d). Note that the third layer promotion in 3He occurs at a relatively low density ( nm-2) before the C2-IC2 coexistence starts Greywall (1990); *eGreywallComment; Nakamura et al. . This is in sharp contrast to the case of 4He where the third layer promotion occurs at much higher densities ( 21 nm-2) after the C2-IC2 coexistence completes Greywall (1993). Also plotted in this figure is the magnetization isotherm taken at 4.6 mK with Grafoil by Bäuerle et al. Bäuerle et al. (1996). The agreement with our phase diagram is remarkable in terms of the density width for the C2 phase and of the third-layer promotion density. The previous workers’ data with Grafoil are consistent with our phase diagram if their density scales are multiplied by (Refs. 24; 40), (Ref. 41; *eGreywallComment), and (Ref. 43).
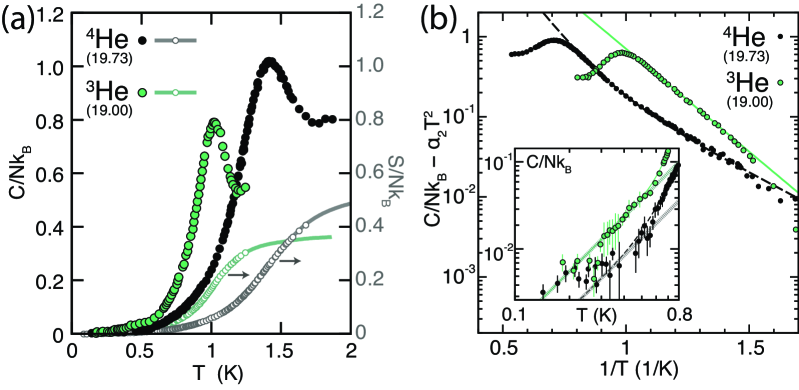
There are several reasons to believe that the broad specific-heat anomalies observed in 4He and 3He are due to continuous 2D melting transitions of the C2 phase which possesses some type of spatial order. For example, entropy changes associated with them, 0.4–0.5 , are large enough to convince one of the presence of phase transitions [see Fig. 3(a)]. The anomalies are substantially broad, and the broadness should be intrinsic since they are insensitive to the system size. Eventually, they are similar to the Monte Carlo simulation for melting of a 2D classical Lennard-Jones solid Wierschem and Manousakis (2011) as shown in Fig. 1(c). This simulation is consistent with the KTHNY theory Halperin and Nelson (1978); *NelsonHalperin1979PRB; *Young1979PRB. The theory predicts that, in general, 2D solid melts through two continuous transitions on warming, i.e., a transition from solid to hexatic at the melting temperature () and that from hexatic to uniform liquid at a slightly higher temperature (). The two transitions are due to unbinding of dislocation pairs and disclination ones, respectively. They are accompanied by intrinsically rounded specific-heat anomalies because of subsequent proliferation of the free topological defects. The two anomalies, however, can easily merge into a broader single peak because usually Wierschem and Manousakis (2011). In the same figure we also plot the PIMC simulation of the specific heat anomaly for the superfluid transition of 2D liquid 4He Ceperley and Pollock (1989) as a typical example of the Kosterlitz-Thouless type transition where a single step transition occurs due to unbinding of vortex pairs jKe . Importantly, these specific heat peaks are centered at 10%–30% higher temperatures than the true transition temperatures at which practically no anomalies are observed Wierschem and Manousakis (2011); Ceperley and Pollock (1989); Berker and Nelson (1979).
Let us discuss the nature of the C2 phase in more detail. If the periodic potential from the first layer plays an essential role, it would be a commensurate phase as was originally anticipated bDe . If so, we should assume the existence of a sizable amount of ZP defectons such as ZP vacancies, interstitials, and dislocation pairs. These pointlike defectons hop around quantum mechanically without breaking the translational quasi-long-range order. Otherwise, it is difficult to explain why the commensurate phase can be stabilized over a relatively wide density region of 0.08–0.09 where we observed only the C2 anomaly and the growth of with increasing . The neutron scattering data Lauter et al. (1987); *Lauter1991PTSF with ZYX substrate show a small but steep increase by 1.3%–1.5% of at densities near the L2-C2 coexistence and the C2 regions for both 4He and 3He. This suggests a simultaneous compression of the first and second layers supporting the commensurate phase picture. It should, however, be noted that the neutron experiments were unsuccessful to detect Bragg peaks directly from the C2 phase, though they may be masked with a large Debye-Waller factor due to strong quantum fluctuations. Another fundamental question of this picture is that, if the substrate potential corrugation is large enough to stabilize a commensurate phase, the transition nature should be modified so as to be size dependent acquiring Ising or first-order character, which is not consistent with our observation Halperin and Nelson (1978); *NelsonHalperin1979PRB; *Young1979PRB.
If the role of the periodic potential from underlayers is not important, the most plausible phase at least for the 4He -C2 phase is the quantum hexatic phase as was previously examined theoretically Mullen et al. (1994); Apaja and Saarela (2008); *fHexaticComment. This is a quantum version of the hexatic phase where bound disclination pairs are spontaneously created by quantum fluctuations even at 0, i.e., , destroying the translational order but keeping the quasi long-range sixfold bond-orientational order. This picture is consistent with the existing experimental and theoretical constraints, e.g., the lack of translational long-range order in the neutron experiments Lauter et al. (1987); *Lauter1991PTSF and the recent PIMC calculation Corboz et al. (2008). Also, the common low- envelopes observed in the L2-C2 and C2-IC2 coexistence regions of 4He can be interpreted by considering that the short-range C2 (or hexatic) correlation does not affect the excitation spectrum at low momenta but softens it at a high momentum just like the roton-type softening near solidification computed for 2D liquid 4He Halinen et al. (2000); *KrotscheckJLTP2015.
As far as we know, there are no other reasonable scenarios for the C2 phase other than the above-mentioned two. In any case, it would be a new state of matter never experimentally observed before. It is difficult to discriminate them only from the present thermodynamic measurements, although the quantum hexatic picture looks more feasible. New scattering experiments and first-principles calculations to measure the angular correlation function are highly desirable. One such attempt has recently been made by Ahn et al. Ahn et al. (2016) who showed that from a new PIMC calculation the 4/7 phase is stable or unstable as a result indeed of a delicate energy balance depending on whether the first layer is a commensurate or incommensurate solid. In the following, we focus on differences between the data of the two isotopes which obey different quantum statistics.
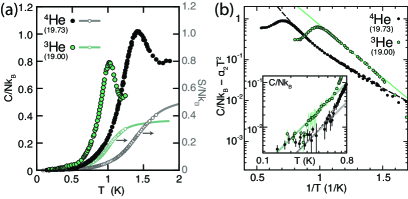
and are larger by 40% in 4He compared to 3He despite their nearly the same areal densities [Fig. 3(a)]. This is quite singular since, in other 2D and three dimensional (3D) He solids, heavier isotopes “always” have slightly lower (or ) than lighter ones with the same densities gSM . Clearly an extra degree of freedom stiffens the C2 order for the case of bosonic 4He, which is most likely superfluid order. If so, it would be a superhexatic state Mullen et al. (1994); Apaja and Saarela (2008); *fHexaticComment (or a supercrystal with the ZP defectons Crowell and Reppy (1996); Shibayama et al. (2009); Andreev (1982)) where the superfluidity and spatial orders coexist. The recent topological argument on 2D QLCs Gopalakrishnan et al. (2013) indeed indicates that, by intertwining the superfluid order with the orientational one, in triangular or hexagonal lattices can be enhanced by the same amount of the additional stiffness of order compared to untwined cases. Such an enhancement does not occur in stripes and square lattices, which is another reason why we chose the hexatic order among various other spatial orders gSM .
It is expected that the specific heat of the C2 phase is dominated by a term which comes from 2D phonons at low . Indeed, the 3He data follow the behavior as shown in the inset of Fig. 3(b). On the other hand, it is not clear if the low 4He data obey the law because of limited accuracies due to the small surface area of the ZYX substrate, Nevertheless, they are obviously much smaller (at least by a factor of 3) than 3He in a range between 0.3 and 0.6 K where we determined the coefficient of the term. This is again singular since, in other 2D and 3D solids of He, heavier 4He have slightly larger phonon terms than lighter 3He with the same densities gSM . The 4He -C2 phase seems to have much reduced spatial order than the 3He counterpart. Also, the two isotopes have qualitatively different dependencies at 0.2 0.85. The simple Arrhenius type function (solid lines) represents the 3He data very well, indicating one dominant topological defect, i.e., a disclination (dislocation) pair for the hexatic (triangular) order. However, it does not work for the 4He data [Fig. 3(b)] suggesting involvement of another defect, in other words, another order. These would provide useful information for future investigations of quantum fluctuations and thermal activations of the ZP defectons gSM . For example, the activation energy is considered as twice the defect core energy.
In summary, we determined detailed phase diagrams of the second layer of 4He and 3He showing the unambiguous existence of distinct phase (C2 phase) at densities of finite span between the liquid and incommensurate solid phases. Our data strongly suggest that the phase is either the commensurate phase or the quantum hexatic phase, which are both atomic QLCs containing the zero-point defectons. We also discussed the possibility of a superfluid QLC state in the 4He -C2 phase where both spatial and gauge symmetries are cooperatively broken at temperatures below 1.4 K.
Acknowledgements.
We thank Tony Leggett, Hans Lauter, Luciano Reatto, Naoki Kawashima, and Henri Godfrin for helpful discussions. This work was financially supported by Grant-in-Aid for Scientific Research on Priority Areas (Grant No. 17071002) from MEXT, Japan and Scientific Research (A) (Grant No. 22244042) and (B) (Grant No. 15H03684), and Challenging Exploratory Research (Grant No. 15K13398) from JSPS. S. N. acknowledges support from the Fuuju-kai Fellowship.References
- Fradkin et al. (2010) E. Fradkin, S. A. Kivelson, M. J. Lawler, J. P. Eisenstein, and A. P. Mackenzie, Annu. Rev. Condens. Matter Phys. 1, 153 (2010).
- Frey et al. (1994) E. Frey, D. R. Nelson, and D. S. Fisher, Phys. Rev. B 49, 9723 (1994).
- Andreev and Lifshitz (1969) A. F. Andreev and I. M. Lifshitz, Sov. Phys. JETP 29, 1107 (1969).
- Kim and Chan (2004) E. Kim and M. H. W. Chan, Nature (London) 427, 225 (2004).
- Kim and Chan (2012) D. Y. Kim and M. H. W. Chan, Phys. Rev. Lett. 109, 155301 (2012).
- Balibar and Caupin (2008) S. Balibar and F. Caupin, J. Phys.: Condens. Matter 20, 173201 (2008).
- Vekhov et al. (2014) Y. Vekhov, W. J. Mullin, and R. B. Hallock, Phys. Rev. Lett. 113, 035302 (2014).
- (8) these articles revealed important roles of superflow along macroscopic or microscopic defects rather than bulk flow in hcp solid 4He.
- Wu et al. (2016) Z. Wu, J. K. Block, and G. M. Bruun, Sci. Rep. 6, 19038 (2016).
- Vorontsov and Sauls (2007) A. B. Vorontsov and J. A. Sauls, Phys. Rev. Lett. 98, 045301 (2007).
- Levitin et al. (2013) L. V. Levitin, R. G. Bennett, A. Casey, B. Cowan, J. Saunders, D. Drung, T. Schurig, and J. M. Parpia, Science 340, 841 (2013).
- Ishida et al. (1997) K. Ishida, M. Morishita, K. Yawata, and H. Fukuyama, Phys. Rev. Lett. 79, 3451 (1997).
- Fukuyama and Morishita (2000) H. Fukuyama and M. Morishita, Physica B 280, 104 (2000).
- Fukuyama (2008) H. Fukuyama, J. Phys. Soc. Jpn. 77, 111013 (2008).
- Matsumoto et al. (2005) Y. Matsumoto, D. Tsuji, S. Murakawa, H. Akisato, H. Kambara, and H. Fukuyama, J. Low Temp. Phys. 138, 271 (2005).
- Murakawa et al. (2006) S. Murakawa, H. Akisato, Y. Matsumoto, D. Tsuji, K. Mukai, H. Kambara, and H. Fukuyama, in Low Temperature Physics: 24th International Conference on Low Temperature Physics, edited by Y. Takano, S. P. Hershfield, S. O. Hill, P. J. Hirschfeld, and A. M. Goldman, AIP Conf. Proc. No. 850 (AIP, Melville, NY, 2006), p. 311.
- Roger et al. (1998) M. Roger, C. Bäuerle, Y. M. Bunkov, A.-S. Chen, and H. Godfrin, Phys. Rev. Lett. 80, 1308 (1998).
- Fuseya and Ogata (2009) Y. Fuseya and M. Ogata, J. Phys. Soc. Jpn. 78, 013601 (2009).
- Watanabe and Imada (2009) S. Watanabe and M. Imada, J. Phys. Soc. Jpn. 78, 033603 (2009).
- Crowell and Reppy (1996) P. A. Crowell and J. D. Reppy, Phys. Rev. B 53, 2701 (1996).
- Shibayama et al. (2009) Y. Shibayama, H. Fukuyama, and K. Shirahama, J. Phys.: Conf. Ser. 150, 032096 (2009).
- Sato et al. (2012) D. Sato, K. Naruse, T. Matsui, and H. Fukuyama, Phys. Rev. Lett. 109, 235306 (2012).
- Greywall (1993) D. S. Greywall, Phys. Rev. B 47, 309 (1993).
- Van Sciver and Vilches (1978) S. W. Van Sciver and O. E. Vilches, Phys. Rev. B 18, 285 (1978).
- Corboz et al. (2008) P. Corboz, M. Boninsegni, L. Pollet, and M. Troyer, Phys. Rev. B 78, 245414 (2008).
- Abraham et al. (1990) F. F. Abraham, J. Q. Broughton, P. W. Leung, and V. Elser, Europhys. Lett. 12, 107 (1990).
- Pierce and Manousakis (1999) M. Pierce and E. Manousakis, Phys. Rev. B 59, 3802 (1999).
- Takagi (2009) T. Takagi, J. Phys.: Conf. Ser. 150, 032102 (2009).
- Birgeneau et al. (1982) R. J. Birgeneau, P. A. Heiney, and J. P. Pelz, Physica B+C 109–110, 1785 (1982).
- Niimi et al. (2006) Y. Niimi, T. Matsui, H. Kambara, K. Tagami, M. Tsukada, and H. Fukuyama, Phys. Rev. B 73, 085421 (2006).
- Strandburg (1988) K. J. Strandburg, Rev. Mod. Phys. 60, 161 (1988).
- Nakamura et al. (2012) S. Nakamura, K. Matsui, T. Matsui, and H. Fukuyama, J. Phys.: Conf. Ser. 400, 032061 (2012).
- Nakamura et al. (2013) S. Nakamura, K. Matsui, T. Matsui, and H. Fukuyama, J. Low Temp. Phys. 171, 711 (2013).
- (34) the -dependent correction applied to the raw heat-capacity data above 2.2 K in this reference is unnecessary in the present experiment.
- (35) S. Nakamura, K. Matsui, T. Matsui, and H. Fukuyama, (unpublished) .
- Lauter et al. (1987) H. J. Lauter, H. P. Schildberg, H. Godfrin, H. Wiechert, and R. Haensel, Can. J. Phys. 65, 1435 (1987).
-
Lauter et al. (1991)
H. J. Lauter, H. Godfrin,
V. L. P. Frank, and P. Leiderer, in Phase Transitions
in Surface Films 2, edited by H. Taub,
G. Torzo, H. J. Lauter, and J. S. C. Fain
(Plenum, New York, 1991), pp. 135–151. - Wierschem and Manousakis (2011) K. Wierschem and E. Manousakis, Phys. Rev. B 83, 214108 (2011).
- Ceperley and Pollock (1989) D. M. Ceperley and E. L. Pollock, Phys. Rev. B 39, 2084 (1989).
- Van Sciver (1978) S. W. Van Sciver, Phys. Rev. B 18, 277 (1978).
- Greywall (1990) D. S. Greywall, Phys. Rev. B 41, 1842 (1990).
- (42) note that the surface area in this reference has been corrected by %. See D. S. Greywall and P. A. Busch, Phys. Rev. Lett. 65, 2788 (1990).
- Bäuerle et al. (1996) C. Bäuerle, Y. M. Bunkov, S. N. Fisher, and H. Godfrin, Czech. J. Phys., Suppl. S1 46, 401 (1996).
- Halperin and Nelson (1978) B. I. Halperin and D. R. Nelson, Phys. Rev. Lett. 41, 121 (1978).
- Nelson and Halperin (1979) D. R. Nelson and B. I. Halperin, Phys. Rev. B 19, 2457 (1979).
- Young (1979) A. P. Young, Phys. Rev. B 19, 1855 (1979).
- (47) Rather sharp specific heat anomalies [half-width at half maximum (HWHM) on low- side ] are reported for the KT superfluid transition in thin 4He films adsorbed on porous media [L. M. Steele , C. J. Yeager, and D. Finotello, Phys. Rev. Lett. 71, 3673 (1993)], while it is much broader in the theoretical calculation () in Ref. 39. The transition nature could be sensitive to the film geometry and surface roughness. The HWHM of our 4He -C2 anomaly is .
- Berker and Nelson (1979) A. N. Berker and D. R. Nelson, Phys. Rev. B 19, 2488 (1979).
- (49) Density ratios between the first and second layers are (4He) and (3He) which are closer to or rather than . Hence our data are not consistent with the previous structural assignment of the 4/7 phase.
- Mullen et al. (1994) K. Mullen, H. T. C. Stoof, M. Wallin, and S. M. Girvin, Phys. Rev. Lett. 72, 4013 (1994).
- Apaja and Saarela (2008) V. Apaja and M. Saarela, Europhys. Lett. 84, 40003 (2008).
- (52) in this calculation for an ideal 2D 4He system, the sixfold angular correlation appears at densities above 6.5 nm-2, and the hexatic phase persists metastably up to 7.7 nm-2 although solid is a stable phase above 7.0 nm-2. In our experiment, the C2 correlation appears above 6.9 nm-2 and disappears above 8.5 nm-2 in 4He.
- Halinen et al. (2000) J. Halinen, V. Apaja, K. A. Gernoth, and M. Saarela, J. of Low Temp. Phys. 121, 531 (2000).
- Krotscheck and Lichtenegger (2015) E. Krotscheck and T. Lichtenegger, J. of Low Temp. Phys. 178, 61 (2015).
- Ahn et al. (2016) J. Ahn, H. Lee, and Y. Kwon, Phys. Rev. B 93, 064511 (2016).
- (56) See Supplemental Material which includes Refs. [16,26,28,33,41].
- Andreev (1982) A. F. Andreev, in Progress in Low Temp. Phys. edited by D. F. Brewer (North-Holland, Amsterdam, 1982), Vol. VIII, pp. 67–131.
- Gopalakrishnan et al. (2013) S. Gopalakrishnan, J. C. Y. Teo, and T. L. Hughes, Phys. Rev. Lett. 111, 025304 (2013).
Supplemental Material for
“Possible quantum liquid crystal phases of helium monolayers”
S. Nakamura1, K. Matsui2, T. Matsui2,
and Hiroshi Fukuyama1,2∗
1Cryogenic Research Center, The University of Tokyo,
2-11-16 Yayoi, Bunkyo-ku, Tokyo 113-0032, Japan
2Department of Physics, The University of Tokyo,
7-3-1 Hongo, Bunkyo-ku, Tokyo 113-0033, Japan
(Dated: November 4, 2016)
.1 Isotope effect on melting of quantum solids
The negative isotope effect on melting temperature (), i.e., lighter isotopes have higher () is one of the most peculiar and universal properties of quantum solids. Here is the atomic/molecular mass. The underlying mechanism is reduction of the quantum mechanical zero-point energy () by localization when the mean interparticle distance becomes comparable to the hardcore diameter upon compression. This has been explained qualitatively by Nagaoka Nagaoka (1980) for hardcore particles in three dimensions (3D) at 0, numerically by Ceperley . Ceperley et al. (1996) for hcp 4He at 0 and numerically by Hirashima Hirashima et al. (2003) for quantum particles with short-ranged repulsive interactions in 2D under a periodic external potential. Experimentally, the negative isotope effect is eventually hold in all previously known 2D and 3D solids of helium as shown in TABLE SI.
Therefore, the very large (40%) and “positive” isotope effect on in the C2-phase we found in this experiment is extremely anomalous. Statistics should play important roles on quantum melting at temperatures below about 2 K. In principle, superfluidity can substantially reduce in the C2 phase of bosonic 4He resulting in enhanced temperature. On the other hand, it cannot be expected for fermionic 3He at this temperature range because the superfluid transition should be of the order of millikelvin or less if it exists due to Cooper pairing. Otherwise, we do not have any reasonable explanations for this anomalous isotope effect on .
.2 Low temperature specific heat of the C2 phase
In order to extract information on excitations in the C2 phase, we tried to fit the low specific heat data below to the following four functions depending on the range:
| (S1) | |||||
| (S2) | |||||
| (S3) | |||||
| (S4) |
The terms are from 2D phonons. Note that the lowest of our measurement is 200 mK where the magnetic specific heat associated with the nuclear spin degrees of freedom in the 3He-C2 phase is negligibly small Van Sciver (1978). We first fitted the data at K (3He) and K (4He) to Eq. (S1) to determine the values. After substituting them into Eqs. (S2–S4), the data in a wider range of 0.2 0.85 were fitted with those three functions.
The 3He data at nm-2 are best fitted to Eq. (S2) with K-2, and K. Generally, the simple Arrhenius type behavior such as Eq. (S2) should be applicable to the low- specific heat of KTHNY transitions (or superfluid KT transitions) where unbound free topological defects are thermally excited Wierschem and Manousakis (2011); Berker and Nelson (1979). In the quantum hexatic scenario, is about twice the disclination core energy.
The situation for 4He is rather different. Equation (S3) gives apparently better fitting than Eq. (S2) indicating the existence of another type of defect with a lower binding energy than . This can clearly be seen in the main figure of Fig. 3(b) of the main text. The fitting parameters for nm-2 are K-2, , K, and K. It is intuitive to note that is fairly close to the measured enhancement of the peak temperature, (4He)/(3He) . This can naturally be understood within the theory by Gopalakrishnan, Teo and Hughes Gopalakrishnan et al. (2013) as a result of intertwining between the hexatic and superfluid orders in a QLC with a triangular lattice. According to their theory, is determined by unbinding of the disclination dipole. For spatial and phase configurations around this defect, see Fig. 4(e) of Ref. [7]. It is important to notice that both of 3He and of 4He are much larger than the potential corrugation ( 3 K) indicating that the activation energies are not determined by the corrugation.
We remark that Eq. (S4) also reproduces the 4He data as well as Eq. (S3). A fitted value averaged over densities within the pure 4He-C2 phase is 4.900.04 which is close to 5. It might be related to the anomalously large contribution to the specific heat measured in hcp 4He Gardner et al. (1973). This is because the anomaly is interpreted as a signature of the ZP defectons (ZPDs) Anderson et al. (2005) or anomalous phonon dispersion Maris and Balibar (2007), and the former theory predicts a large contribution in 2D. On the other hand, fitting of the 3He data to Eq. (S4) gives 0.2 which is far from the expected value ().
It is not clear if the low- specific heat of 4He obeys the law because of the too small heat capacity compared to the addendum. What we can safely claim is the fact that the 4He-C2 phase has significantly (a factor of 3) smaller specific heat than 3He at 0.3 0.6 K as tabulated in TABLE SI and shown in the inset of Fig.3(b) of the main text. Also, does not change appreciably throughout the density region for the pure C2-phase (19.6 20.3 nm-2). This is again an anomalous isotope effect if we notice that in other 2D and 3D solids of He Hering et al. (1976); Sample and Swenson (1967); Edwards and Pandorf (1965) heavier 4He have always larger or than lighter 3He with the same densities by 40%–60% (see TABLE SI). Here is the coefficient of the phonon term in the low- specific heat of 3D solid. It is likely that the number of phonon modes in the 4He-C2 phase is smaller than that of 3He being supportive of the QLC picture. Superfluidity would also reduce significantly as in the superfluid phase of liq. 4He in 3D due to coherent motion of bosonic particles.
| phase | isotope | or | reference | |||||
| (nm-2) | (K) | (K-2) | (cmmol) | (K) | (K-3) | |||
| C1 | 3He | 6.37 | 3.02(1) | —— | —— | —— | —— | Ref. [14] |
| C1 | 4He | 6.37 | 2.90(1) | —— | —— | —— | —— | Ref. [14] |
| IC1 | 3He | 7.8 | 1.26(1) | 0.10(2) | —— | —— | —— | Ref. [11] |
| IC1 | 4He | 7.8 | 1.22(2) | 0.14(0) | —— | —— | —— | Refs. [11; 15; 16] |
| C2 | 3He | 7.4 | 1.042(4) | 0.154(4) | —— | —— | —— | This work |
| C2 | 3He | 7.7 | 1.118(5) | 0.249(9) | —— | —— | —— | This work |
| C2 | 4He | 7.6–8.2 | 1.44–1.55 | 0.055(11)11footnotemark: 1 | —— | —— | —— | This work |
| IC2 | 3He | 8.522footnotemark: 2 | 1.01(1) | —— | —— | —— | —— | Ref. [4] |
| IC2 | 4He | 8.5 | 0.99(4) | —— | —— | —— | —— | This work |
| bcc | 3He | —— | —— | —— | 20.9 | 2.06(1) | —— | Ref. [17] |
| bcc | 4He | —— | —— | —— | 20.9 | 1.64(3) | —— | Ref. [17; 18] |
| hcp | 3He | —— | —— | —— | 19.2 | 2.98(1) | 0.0042(2) | Ref. [17; 12] |
| hcp | 4He | —— | —— | —— | 19.2 | 2.59(1) | 0.0066(2) | Ref. [17; 13] |
| A clear behavior was not seen in the 4He-C2 phase. | ||||||||
| for the 3He-IC2 phase was estimated from the vs. relation proposed in Ref.19. | ||||||||
References
- Nagaoka (1980) Y. Nagaoka, Prog. Theor. Phys. Suppl. 69, 335 (1980).
- Ceperley et al. (1996) D. M. Ceperley, R. O. Simmons, and R. C. Blasdell, Phys. Rev. Lett. 77, 115 (1996).
- Hirashima et al. (2003) D. S. Hirashima, T. Momoi, and T. Takagi, J. Phys. Soc. Jpn. 72, 1446 (2003).
- Van Sciver (1978) S. W. Van Sciver, Phys. Rev. B 18, 277 (1978).
- Wierschem and Manousakis (2011) K. Wierschem and E. Manousakis, Phys. Rev. B 83, 214108 (2011).
- Berker and Nelson (1979) A. N. Berker and D. R. Nelson, Phys. Rev. B 19, 2488 (1979).
- Gopalakrishnan et al. (2013) S. Gopalakrishnan, J. C. Y. Teo, and T. L. Hughes, Phys. Rev. Lett. 111, 025304 (2013).
- Gardner et al. (1973) W. R. Gardner, J. K. Hoffer, and N. E. Phillips, Phys. Rev. A 7, 1029 (1973).
- Anderson et al. (2005) P. W. Anderson, W. F. Brinkman, and D. A. Huse, Science 310, 1164 (2005).
- Maris and Balibar (2007) H. J. Maris and S. Balibar, J. Low Temp. Phys. 147, 539 (2007).
- Hering et al. (1976) S. V. Hering, S. W. Van Sciver, and O. E. Vilches, J. Low Temp. Phys. 25, 793 (1976).
- Sample and Swenson (1967) H. H. Sample and C. A. Swenson, Phys. Rev. 158, 188 (1967).
- Edwards and Pandorf (1965) D. O. Edwards and R. C. Pandorf, Phys. Rev. 140, A816 (1965).
- Bretz (1977) M. Bretz, Phys. Rev. Lett. 38, 501 (1977).
- Bretz et al. (1973) M. Bretz, J. G. Dash, D. C. Hickernell, E. O. McLean, and O. E. Vilches, Phys. Rev. A 8, 1589 (1973).
- Greywall (1993) D. S. Greywall, Phys. Rev. B 47, 309 (1993).
- Grilly and Mills (1959) E. R. Grilly and R. L. Mills, Ann. Phys. 8, 1 (1959).
- Grilly (1973) E. R. Grilly, J. Low Temp. Phys. 11, 33 (1973).
- Roger et al. (1998) M. Roger, C. Bäuerle, H. Godfrin, L. Pricoupenko, and J. Treiner, J. Low Temp. Phys. 112, 451 (1998).