Model for electron emission of high-Z radio-sensitizing nanoparticle irradiated by X-rays
Abstract
In this paper we develop a new model for the electron emission of high-Z nanoparticle irradiated by X-rays. This study is motivated by the recent advances about the nanoparticle enhancement of cancer treatment by radiotherapy. Our original approach combines a pure probabilistic analytical model for the photon trajectories inside the nanoparticle and subsequent electron cascade trajectories based here on a Monte-Carlo simulation provided by the Livermore model implemented in Geant4. To compare the nanoparticle and the plane surface electron emissions, we also develop our model for a plane surface. Our model highlights and explains the existence of a nanoparticle optimal radius corresponding to a maximum of nanoparticle electron emission. It allows us to study precisely the nanoparticle photon absorption and electron cascade production depth in the nanoparticle.
1 Introduction
Electron emission by X-ray irradiated nanoparticle is an important subject of interest in the context of radiotherapy cancer treatment enhanced by nanoparticles of high-Z material such as gold. It has been shown that nanoparticles can improve cancer radiotherapy enhancing significantly cancer cell destruction [7, 11] and cancer healing on mice [10], comparatively to classical radiotherapy treatments. Few theoretical approaches are available concerning this improvement, for example hyperthermia [12, 19] or radical production [5] have been studied. One of them explains this increase of cancerous cells death by the nanoparticles emission of electrons. These electrons, released by the interaction of X-rays with nanoparticles, are supposed to be more efficient in the destruction of cancerous cells than the electrons released in water (or tissue) by the interaction of the same X-rays [3, 17, 4].
But this electron emission is not well known and consequently nanoparticle critical parameters such as size or composition are often chosen following others criteria than electron emission: biocompatibility [20, 18], commercial availabilities, production methods.
To fill this gap many studies have been done using Monte-Carlo simulation methods [6, 8, 15, 14, 13, 9] with particle transport codes like Livermore-Geant4 or PENELOPE-Geant4
[1, 2, 16, 21]. These simulations are time consuming, strongly code and model dependent and do not allow the easy analysis of key parameters such size and composition. Therefore to complete these purely Monte-Carlo simulation studies, we propose a semi-analytical original approach for the electron emission of high-Z nanoparticles. This approach combines a pure analytical model for photon trajectories and an electron cascade model partly based here on Monte-Carlo Livermore-Geant4 simulations, but which can be obtained by other models.
In the first part of this paper, we develop the electron emission model for a nanoparticle and for an infinite plane surface. In a second part dedicated to discussion, we compare our model to Livermore-Geant4 results. We also compare nanoparticle and infinite plane surface electron emission and we analyse the place where electrons are produced inside nanoparticle and plane surface. Finally we analyse the influence of the nanoparticle radius on nanoparticle electron emission with our model.
2 Nanoparticle electron emission
We develop in this section the semi-analytical model for the electron emission of a spherical nanoparticle.
2.1 Photon trajectory probability
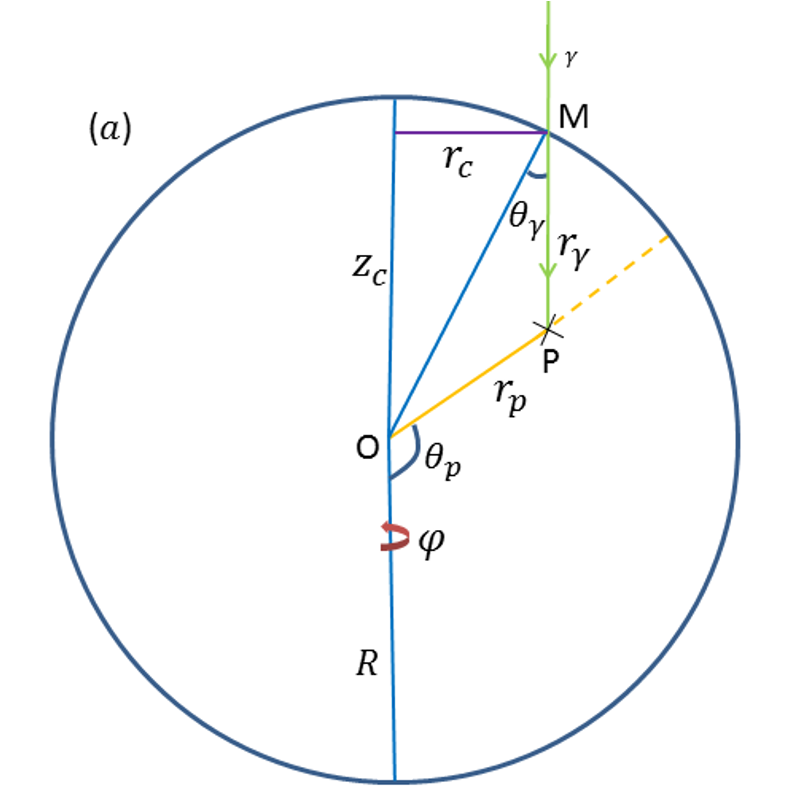
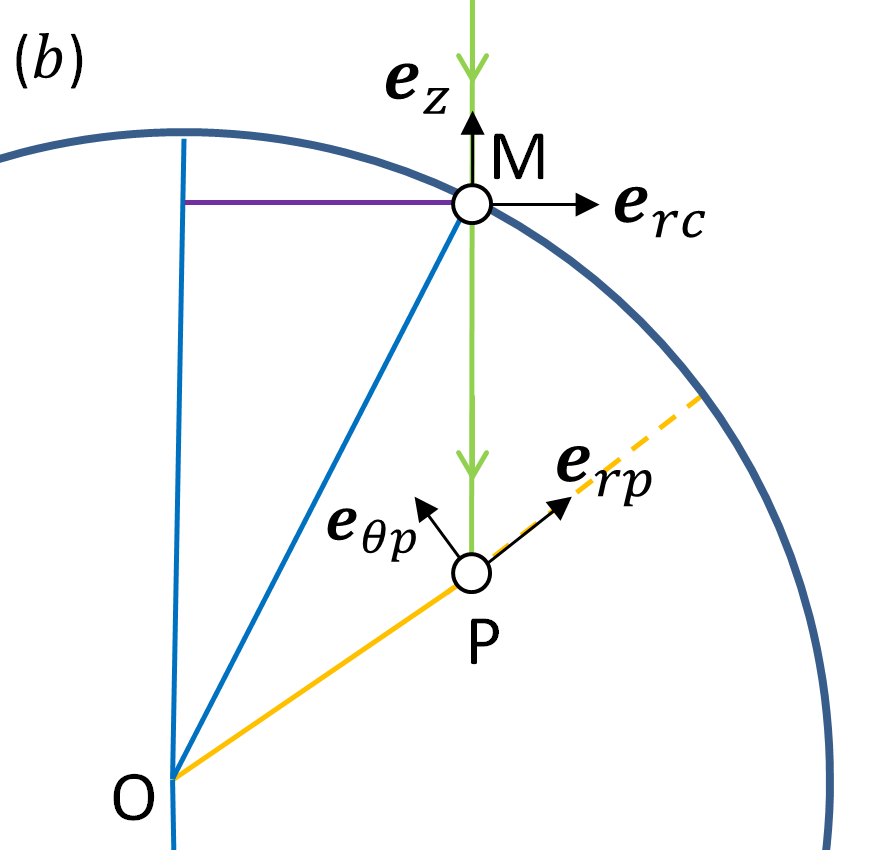
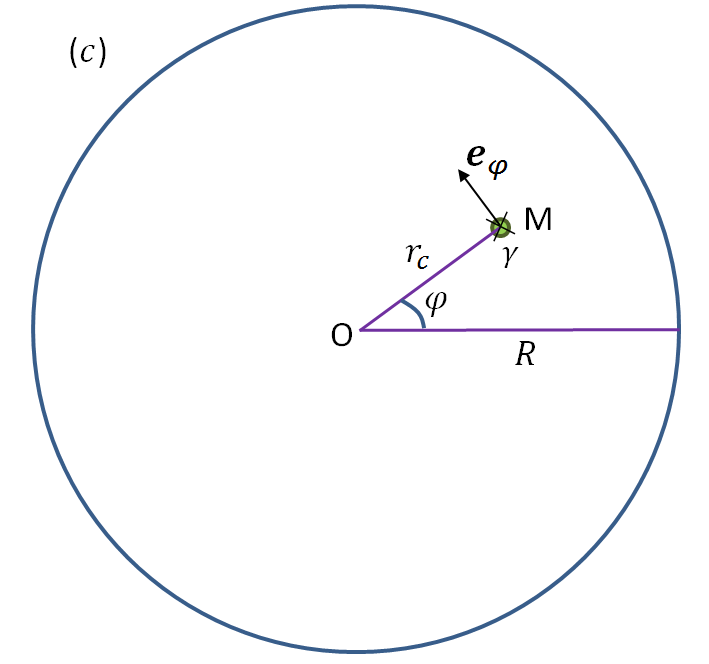
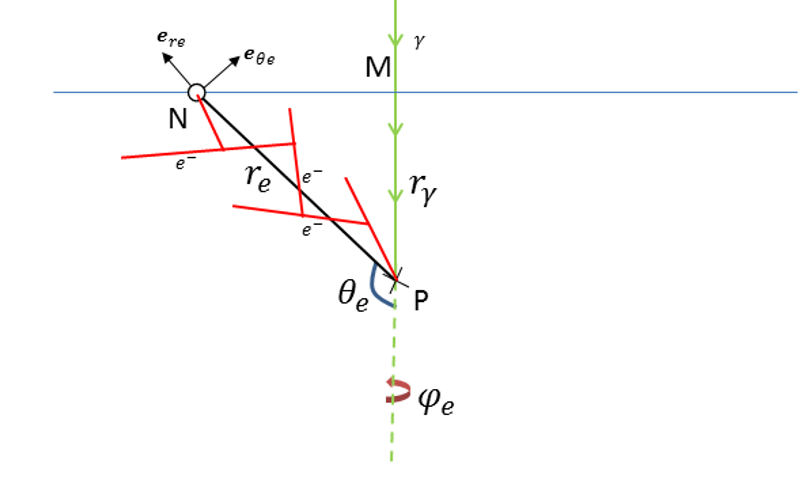
Our goal in this section is to determine the absorption probability density function (p.d.f.) of a photon in any point of the nanoparticle. We consider the trajectory of a photon of energy incident to the nanoparticle at an entry point called . The photon trajectory geometry is described on Fig.1. Subfigures and represent the plan where is the nanoparticle center, is the entry point specified by the cylindrical coordinates system of origin and local orthogonal unit vectors . is the absorption point specified by the coordinates in the cylindrical coordinates system or by the spherical coordinates system of origin and local orthogonal unit vectors . We have also represented on on Fig.1 the radius of the nanoparticle and its surface by a blue circle. The subfigure represents the nanoparticle seen in the irradiation direction i.e. direction. Considering that the irradiation source is far from the nanoparticle comparatively to its radius , a very good approximation is to consider parallel photon irradiation.
2.1.1 Incident and azimuthal angle probability density function (p.d.f.)
If the photon trajectories are parallel and if the photons are uniformly distributed, we can write the probability that a photon goes through an infinitesimal horizontal surface around a point as:
| (1) |
Writing as a function of : (see Fig.1) we then have:
| (2) |
which is the incident and azimuthal angle p.d.f..
2.1.2 Photon path length probability density function (p.d.f.)
In this section we determine the p.d.f. that a photon goes through the nanoparticle on a distance (see Fig.1) and is absorbed.
Considering the X-ray photon energy and the nanoparticle high-Z uniform composition, we choose to consider only the photo-electric interaction for photons. We assume that photons are not scattered and nor they loose their energies on their tracks except if they are completely absorbed and stopped by a photo-electric process, and emit electrons.
Following these approximations, we can write the expression of the probability that a photon goes through a distance inside the high-Z material composing the nanoparticle and reacts as:
| (3) |
where is the photon mean free path inside the nanoparticle material.
The probability that the photon goes through a path length is approximated by a classical Beer-Lambert law and the absorption probability is just . The photon mean free path is strongly photon energy and nanoparticle material dependent.
2.1.3 Absorption probability density function (p.d.f.)
We study the probability that a photon be absorbed in a volume around a point of the nanoparticle. Using (2) and (3) we can write the absorption p.d.f. in the cylindrical coordinates system:
| (4) |
We can also express the same absorption probability in the spherical coordinate system:
| (5) |
Finally by doing the change of variables , we can express the absorption probability, as a function of , in an infinitesimal volume around a point of the nanoparticle.:
| (6) |
To complete this equation, we need to write and as a function of and :
| (7) | |||
| (8) |
Leading to the corresponding Jacobian matrix determinant which is:
| (9) |
2.1.4 Application: Absorption probability density function (p.d.f.) as a function of
It is interesting to integrate the equation (6) over in order to draw the photon absorption p.d.f. as a function of the relative distance to the nanoparticle center. We performed this integration with a Monte Carlo numerical method, as an example, for , and (corresponding to gold material) and we draw the result on Fig.2.
To check our model results, we compare them with a Monte-Carlo particles transport simulation performed ten millions times with the Livermore Model implemented in Geant4 for the same , , parameters. The Livermore model (Salvat et al, 2011; Wright, 2012) includes among others photoelectric process, electrons scattering and electron impact ionization processes. In our case, this model is implemented in the transport toolkit Geant4 (Agostinelli et al, 2003; Allison et al, 2006) that we use in its 4.9.6 version.
The photon energy corresponds to the energy of a Al X-ray source used in a previous work [6] where we compared experimental gold nanoparticle and gold plane surface electron emission, with Monte-Carlo simulations.
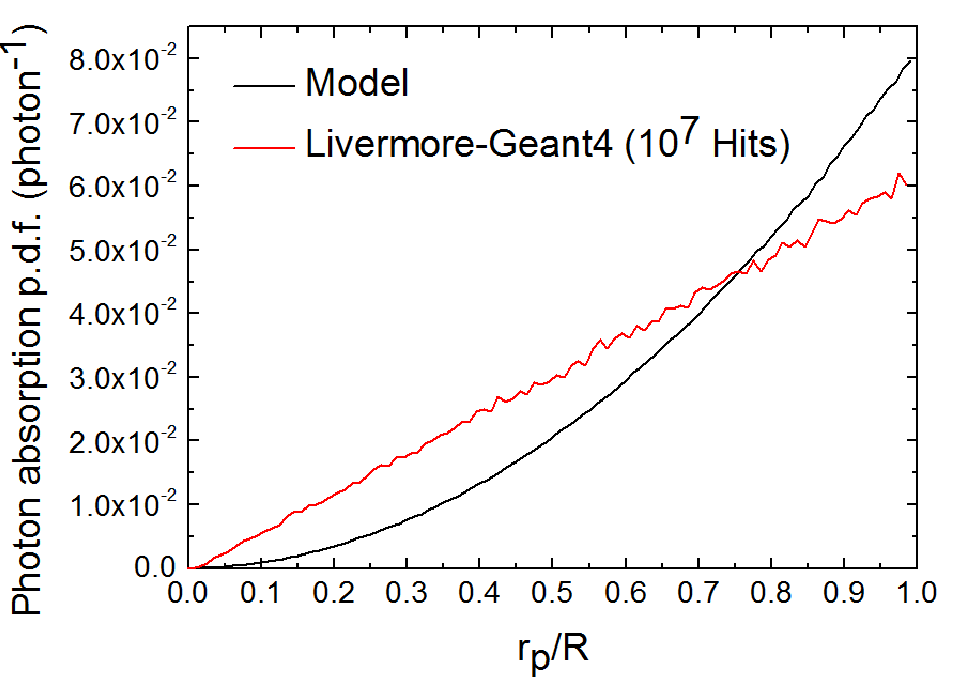
We observe that the p.d.f. integral over is not equal to . This is due to the small photon number absorbed (i.e. the integral over all values) by the nanoparticle, in our case.
The two curves show a difference between our model and the Livermore-Geant4 simulation. Indeed for this last one, the p.d.f. is linear as a function of whereas the model one follows a quadratic function. This difference is not explained for the moment but originates probably in the Geant4 nanoparticle geometry management.
Nevertheless the two p.d.f. are very close which confirms our approach. The Livermore-Geant4 p.d.f. can be seen as a good approximation of the model one.
2.2 Electron cascade trajectory probability density function (p.d.f.)
At the energy range of interest, photon trajectories are quite simple: photons do not loose energy and are not scattered during their tracks. But their absorptions inside the nanoparticle give rise to the creation of free electrons by photo-electric processes. These primary electrons scatter inside the matter and create secondary electrons of lower energies by electron impact ionisation which in turn are scattered inside the matter and can themselves create secondary electrons. Lets call this process an electron cascade. Some of these electrons can reach the nanoparticle surface and contribute to the nanoparticle electron emission.
2.2.1 Electron cascade probability density function (p.d.f.) approximation from Livermore-Geant4 in the bulk solid
In this section we define and study the electron cascade p.d.f. in an infinite solid before including it in our nanoparticle model.
For a single absorption event, lets define at any point within the solid the electron cascade probability as the probability that an electron of energy produced in the cascade goes through the infinitesimal surface around this point. The electron cascade probability is given by:
| (10) |
It is the probability to find an electron of energy in an infinitesimal solid angle after a photo-electric reaction of a photon of energy , given the distance to the absorption point, and the photon energy as described on Fig.3.
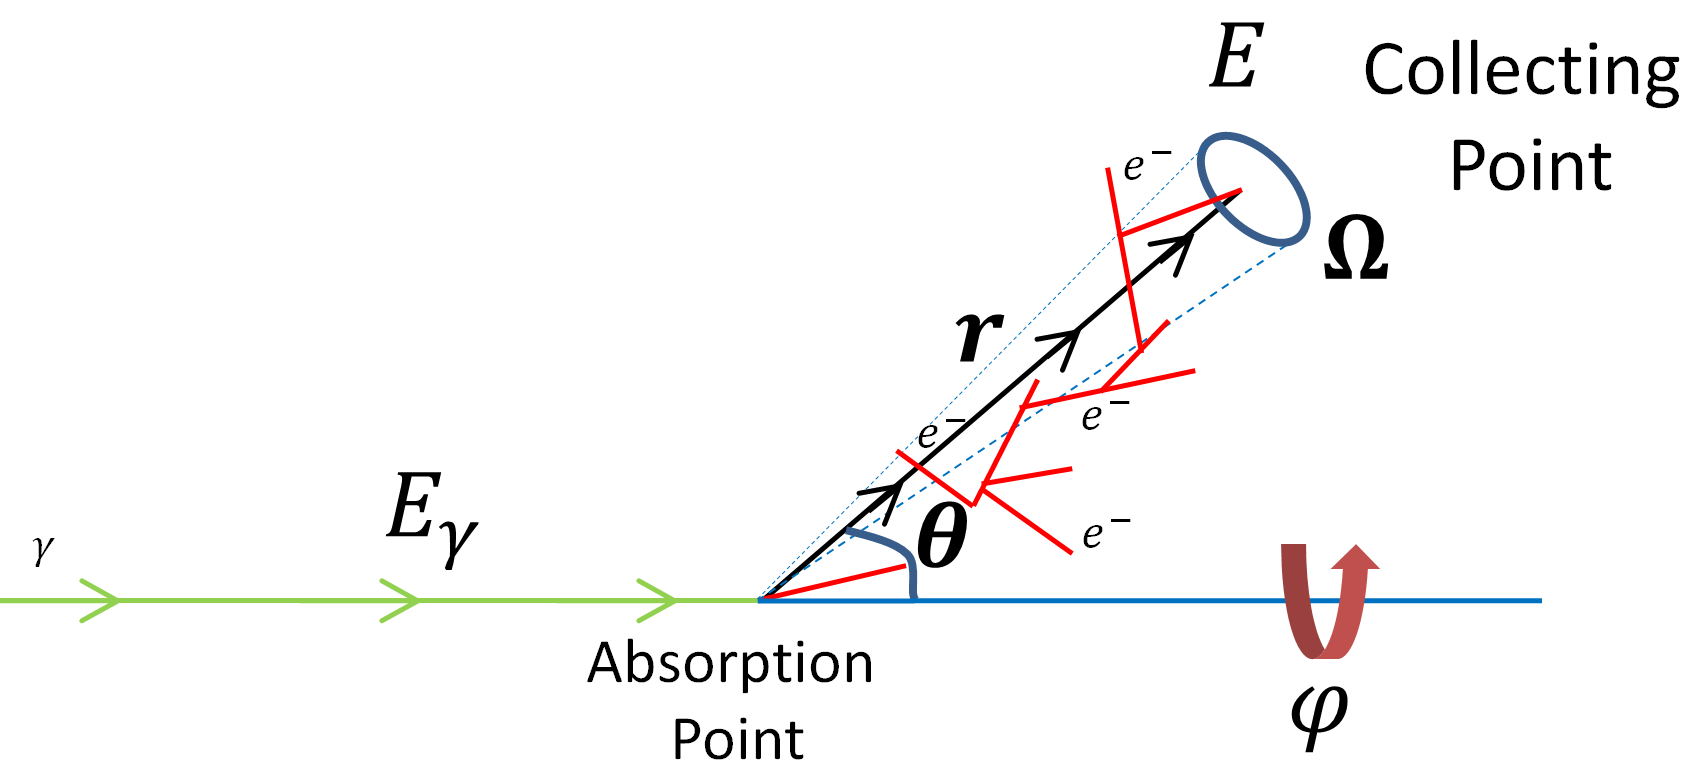
Here we do not analytically compute the p.d.f. but we approximate it from Livermore-Geant4 by simulating the experiment shown on Fig.3 fifty million times for each value with a low cutoff at 100eV for electrons and photons. We compute energy , path length and scattering angle for all the electrons emitted forward i.e. the backscattered electrons are not scored and we assume that the p.d.f. follows a uniform law. From these collected data we draw a histogram. We choose relatively small bin sizes: , and , in order to have a good approximation. Each value of the p.d.f. is approximated to its corresponding bin value in the histogram. The relative error is evaluated to a few percents by measuring the -histogram noise intensity. The Livermore-Geant4 model reliability has been successfully confronted to the experiment (see [6]).
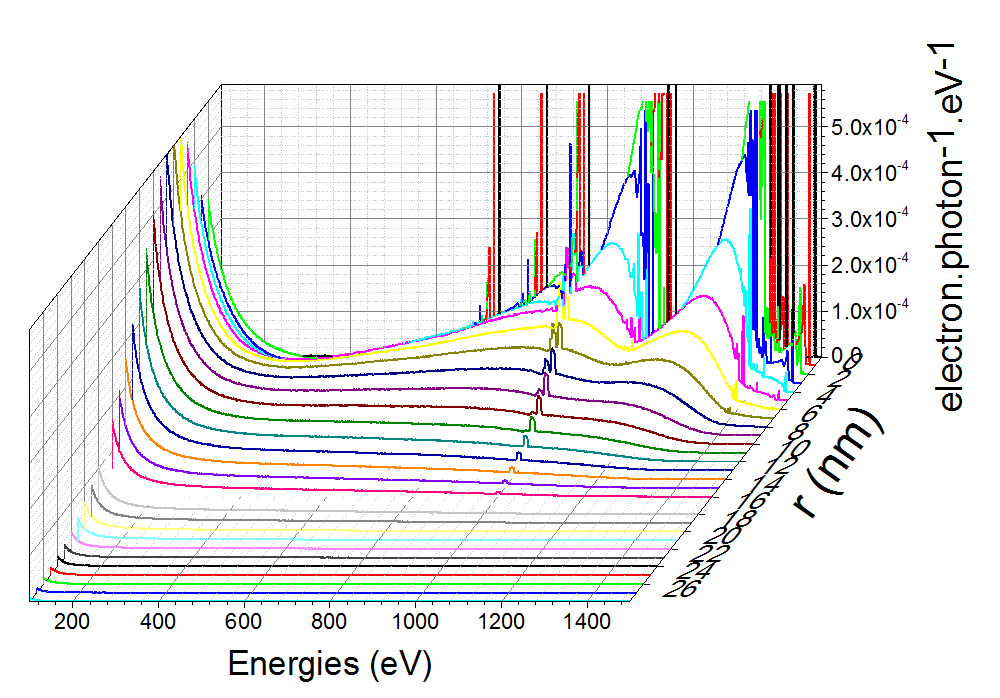
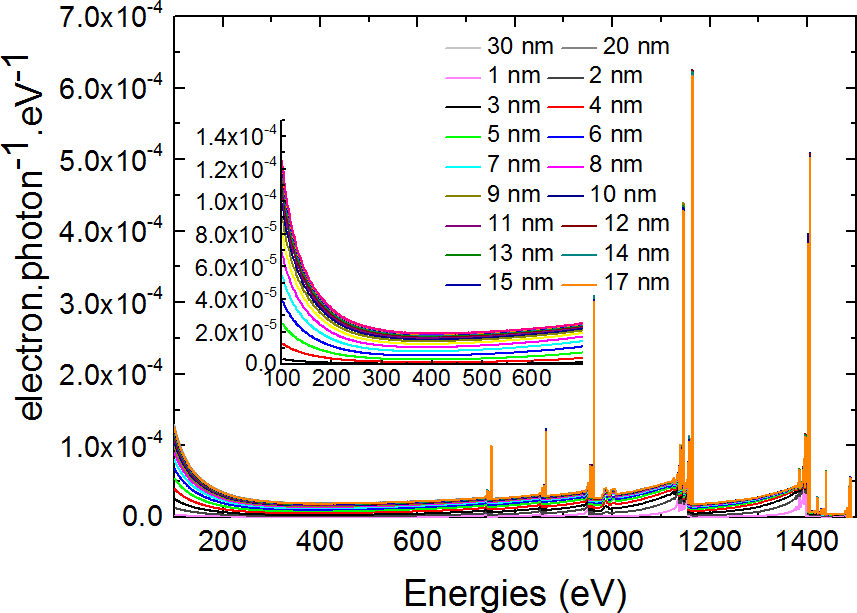
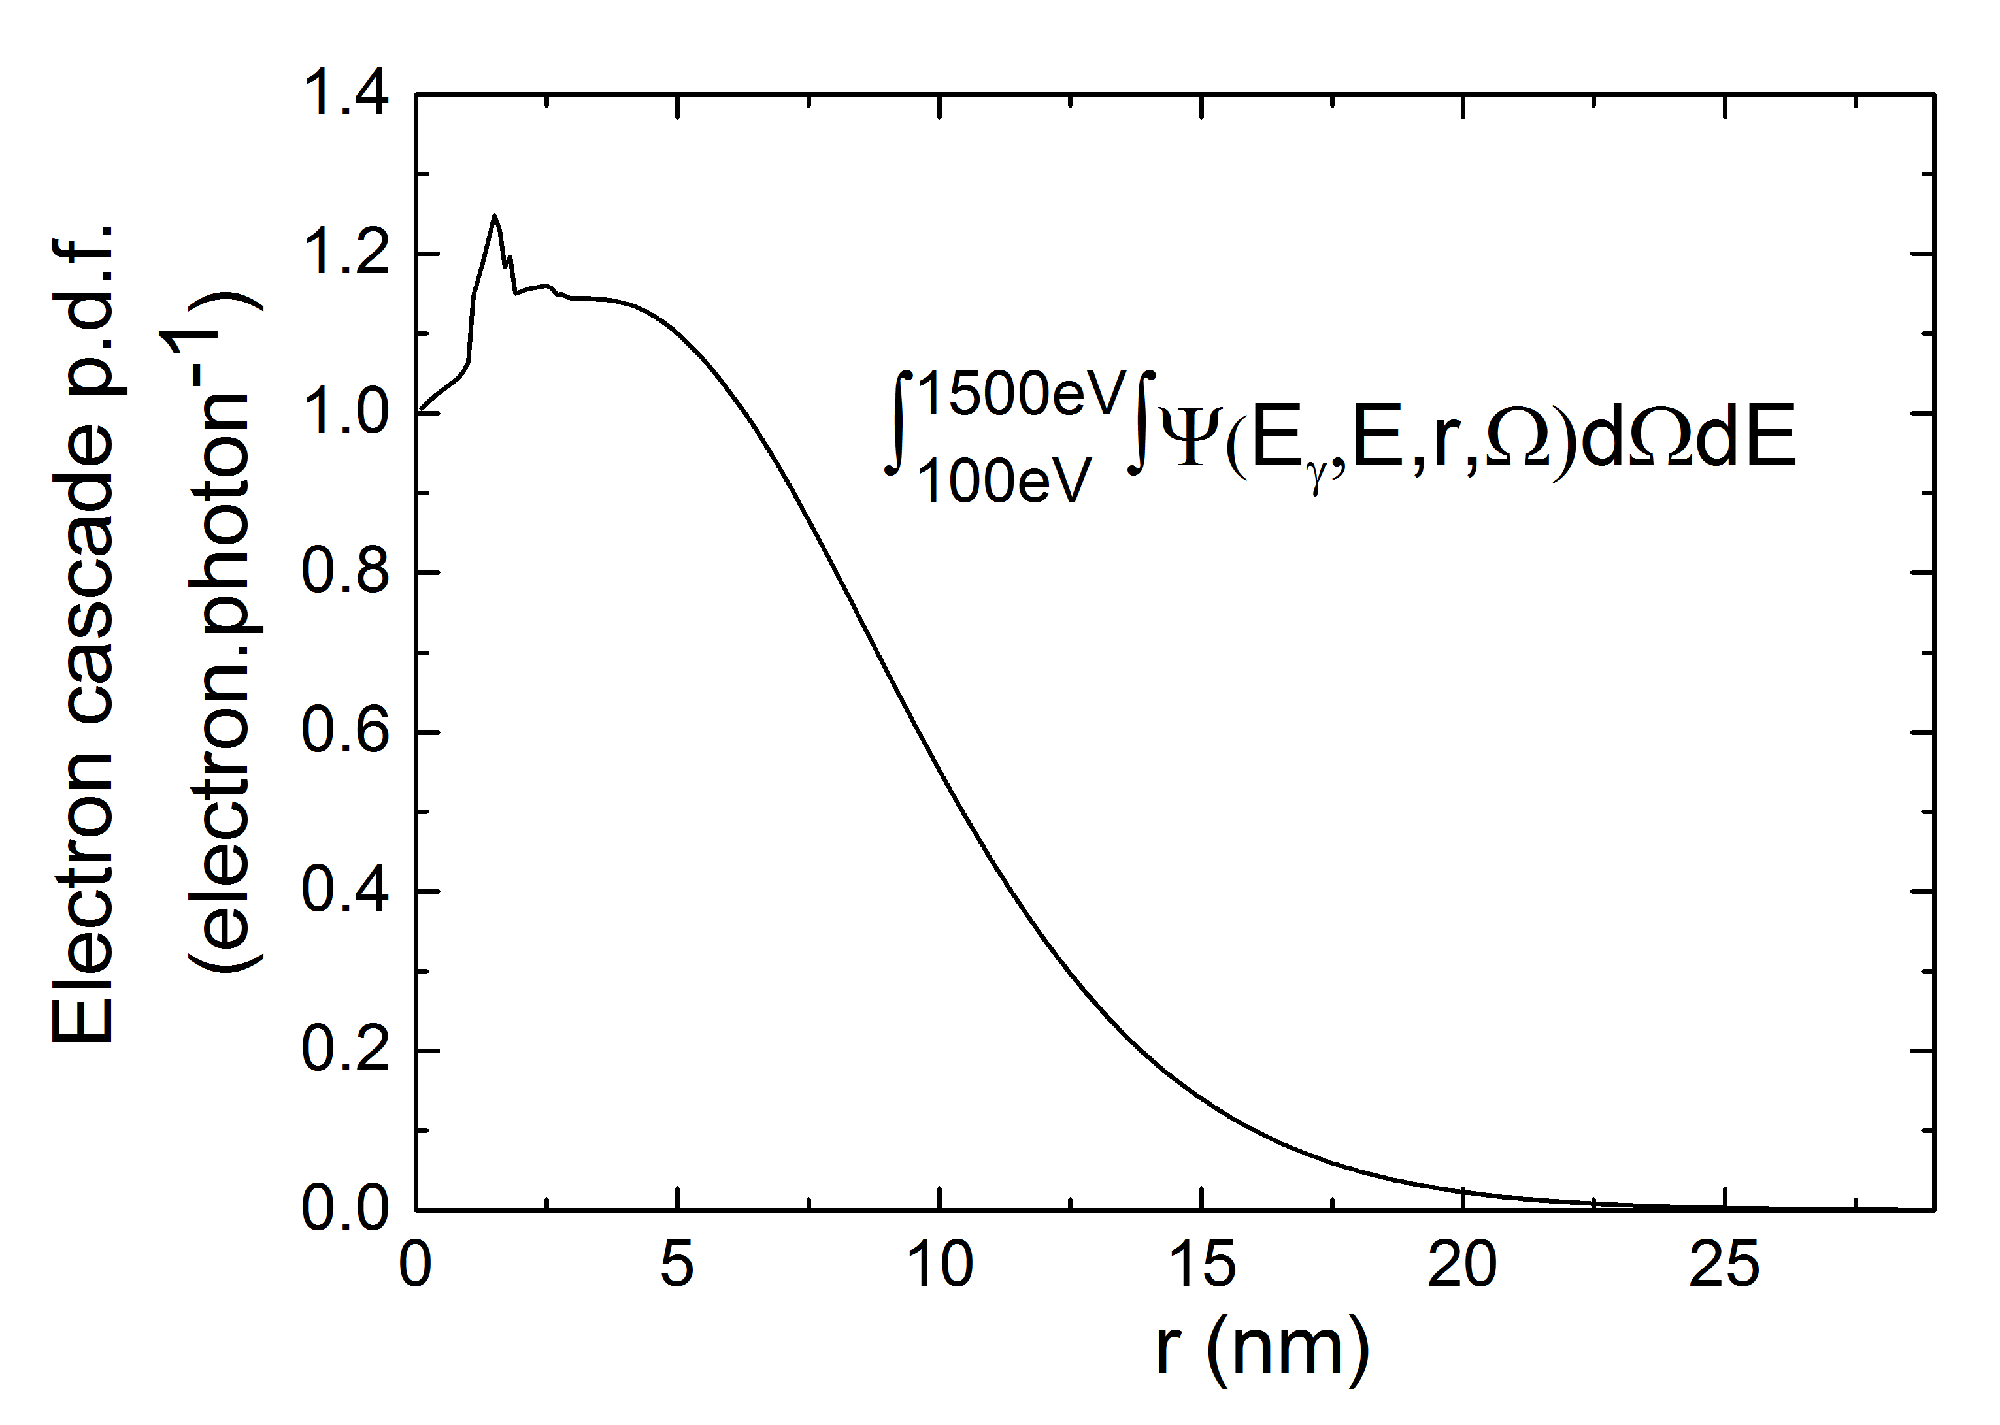
Fig.4 shows a few values of the approximated electron cascade p.d.f. in gold, integrated over angles and for . We observe that p.d.f. values are very small for compared to smaller values. Therefore we approximate this p.d.f. to zero for values superior to .
On this figure, p.d.f. shows photo-electric peaks for the small values. They go broader as we move away from the absorption and finally merge into the electron background. These peaks are analysed in details in [6].
2.2.2 Inclusion of the electron cascade probability density function (p.d.f.) approximation into the nanoparticle model
Now that we have computed the electron cascade p.d.f. lets inject it in the nanoparticle model.
We represent the photon and electron cascade trajectories on Fig.5 where is the distance from the absorption point to a nanoparticle surface point specified in the spherical coordinates system of origin and local orthogonal unit vectors .
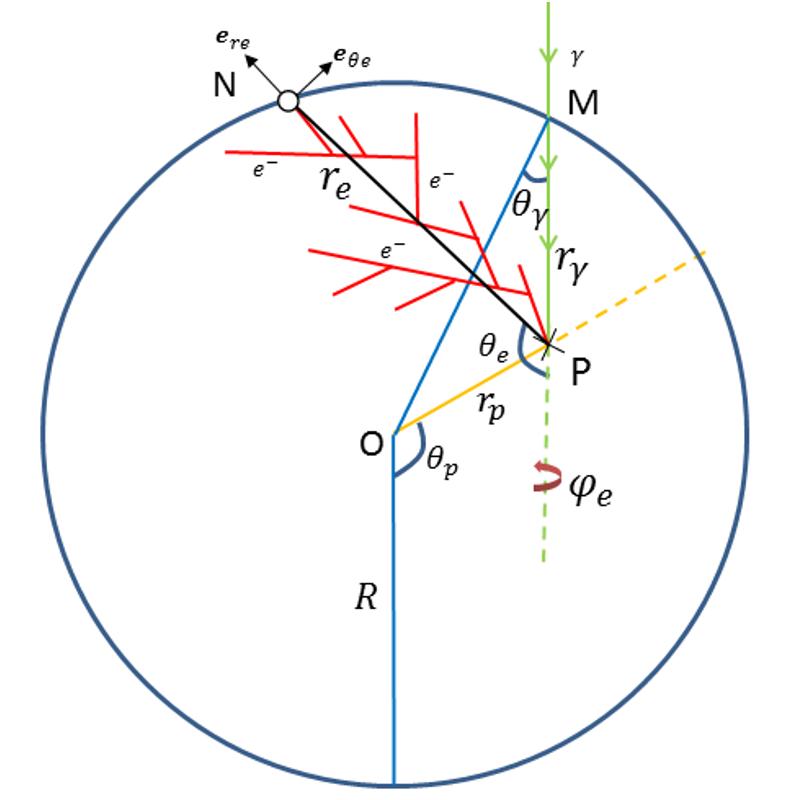
We can associate the electron cascade p.d.f. defined in (10) to the electron cascade trajectory . We write the probability to find an electron of energy in the infinitesimal solid angle around given the length between the photon absorption point and the surface point , and the photon energy :
| (11) |
2.3 Electron emission probability density function (p.d.f.)
We can multiply photon absorption and electron cascade p.d.f. in order to obtain the probability of an incident photon entering in the nanoparticle at , absorbed at and producing an electron cascade ejecting an electron of energy at a surface point :
| (12) |
can be written as a function of the integration variables:
| (13) |
We can integrate (12) over the variables (, , ) and (,) corresponding respectively to the absorption points and the surface points . Hence we get the total nanoparticle electron emission at an energy :
| (14) |
By replacing by its Livemore-Geant4 approximation, we can numerically compute this integral with a Monte-Carlo method. We do it on a large range of energies and we draw the resulting electron emission intensity as a function of the electron energies.
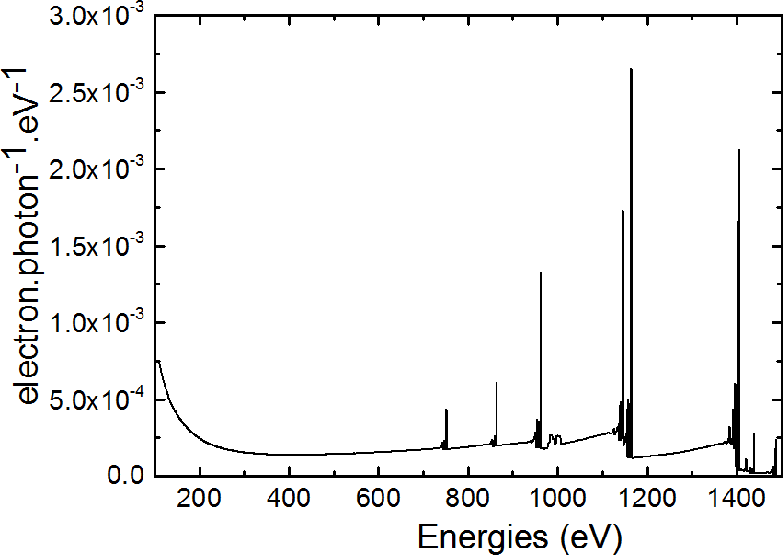
The obtained spectrum is shown on Fig.6 for a X-ray energy value of and a gold nanoparticle of as an example. It is compared with a purely Livermore-Geant4 simulation of ten millions hits, with the same parameters. The computing times comparison is clearly at the advantage of the model. For the same relative standard deviation, it takes to compute the whole electron emission spectrum with the Livermore-Geant4 model whereas it takes only with our model. This gain in time can be largely improved by refining the integration method. The computations were performed on a computer equipped with an Intel Core i7-3770 processor and 16GB memory.
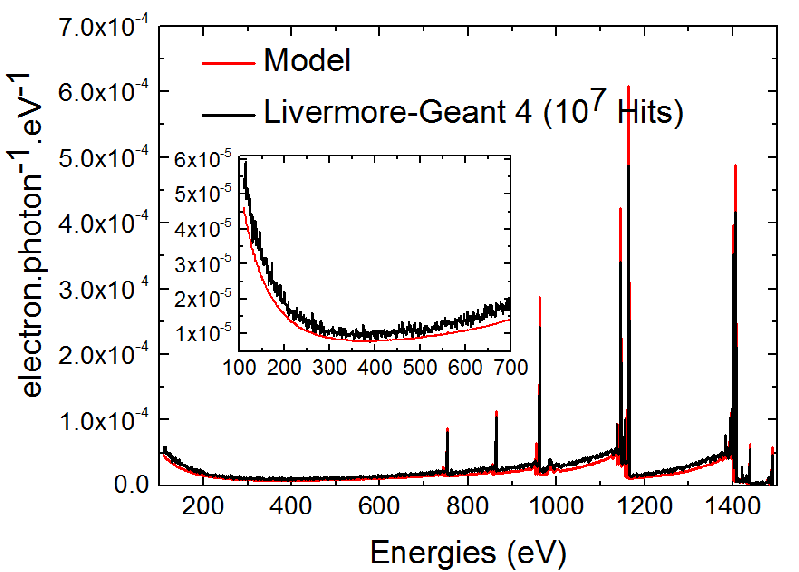
We can see that both spectra are very close but present a few differences which are explained by the photon absorption p.d.f. (Fig.2) in a following section.
Our model is reliable as long as the photo-electric process is the main photo-reaction process of photons inside the nanoparticle material. The electron trajectory reliability is fully dependent of the model used. In the Livermore-Geant4 case, we assume that the electron trajectory simulations are correct until . In our specific case, the model is valid in the photon energy range , and for electron of energies higher than .
This work can be achieved for higher photon energy used in radiotherapy treatment with the same method and with the Livermore-Geant4 model for example. This will be the subject of a next paper.
3 Plane surface electron emission
In a previous paper [6], we compared nanoparticle of radius and very large gold plane surface experimental electron emission spectra. To complete this work, we have decided to develop this model for plane surface electron emission too.
As well as for nanoparticles we consider the photon and the electron cascade trajectories. These are represented on Fig.7. is the entry point, the absorption point specified by its depth and the exit point specified by the spherical coordinates system of origin and local orthogonal unit vectors .
In the same approximations than for nanoparticles and by integrating over all the surface points and the depth , we express the total infinite plane surface electron emission p.d.f. for an energy as:
| (15) |
Again we have as a function of and :
| (16) |
We integrate this p.d.f. by a Monte-Carlo numerical method for a gold plane surface as an example. The result is shown on Fig.8.
We can see that the electron emission for the plane surface is much larger than for the radius nanoparticle (Fig.6). For example the surface electron emissions are at and
at whereas for the nanoparticle the electron emissions are respectively and . This is explained by the larger photon number absorbed by the gold surface plane than by the gold nanoparticle.
Indeed, because of its infinite depth all the incident photons are absorbed by the plane surface, producing photo-electrons whereas only of the incident photons are absorbed by the nanoparticle of radius . We do a more extensive comparison in a further section.
4 Discussion
4.1 Nanoparticle electron cascade production depth
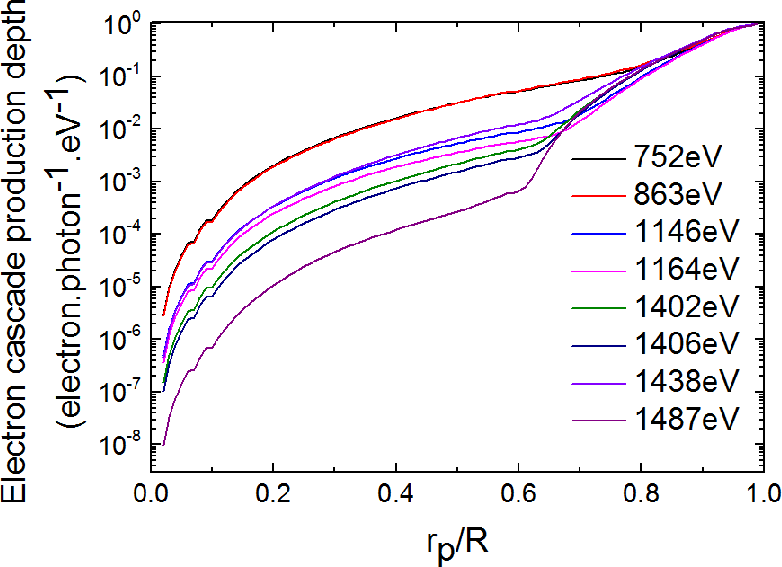
Before going further, we choose to study the electron cascade production depth p.d.f.. To obtain this p.d.f., we numerically integrate equation (12) on all the variables excepted and and draw the resulting p.d.f. which represents the electron cascade production depth i.e. the probability that a photon of energy reacts at a distance from the nanoparticle center and produces an electron of energy at the nanoparticle surface. We draw it on Fig.9 for a gold nanoparticle of radius irradiated by photons, and few electrons energies located in the electron background range .
These electron cascade production depth p.d.f. show, as expected, that most of the emitted electrons are produced by absorption close from the nanoparticle surface. After normalization we notice that all of them follow the same non-linear function which has a maximum at the nanoparticle surface.
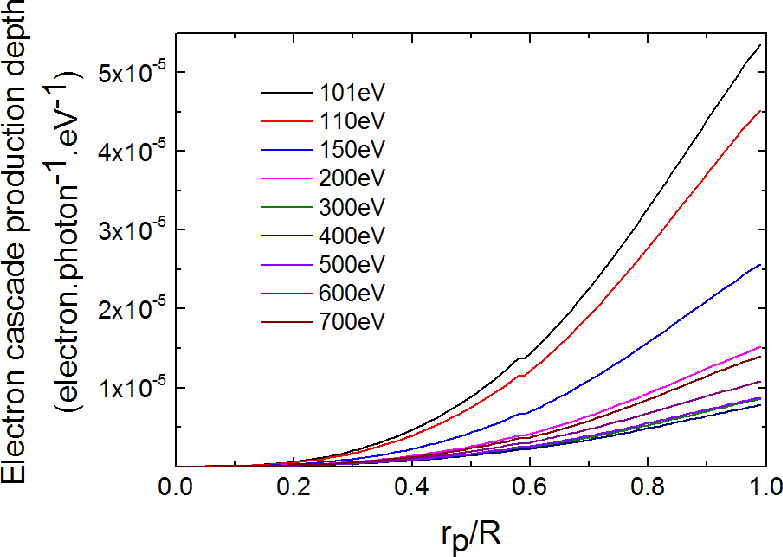
This non-linear function is not completely described by the electron cascade production depth p.d.f. of the photo-electric peak energies as we see on Fig.10.
Indeed, the previous p.d.f. is constituted of secondary electrons forming the peaks bases and the electron background. The production depth p.d.f. of the primary photo-electrons, ejected at the nanoparticle surface constituting most of the photo-electric peaks are created directly by photons shallower in the nanoparticle. That is why for the peak energies, their production depth p.d.f. are the same than the electron background p.d.f. until then diverge more and more till .
4.2 Comparison between our model and Livermore-Geant4
From the spectra shown on Fig.6 we see that our model results are consistent with the Livermore-Geant4 ones. But both spectra do not exactly match. The model continuous background is slightly below the Livermore-Geant4 one and the model photo-electric peak intensities are above the Livemore-Geant4 ones as seen on Tab.1.
These differences are explained by the photon absorption p.d.f.. We observe on Fig.2 that these p.d.f. are comparable but slightly different. As seen before, the Livermore-Geant4 curve follows a linear function with the relative distance to the nanoparticle center whereas the model one follows a non-linear quadratic function. As a consequence the model absorption probability is larger than the Livermore-Geant4 one under and smaller over these values.
However as we have seen on Fig.10, the surface nanoparticle (where model photon absorption p.d.f. is larger) is the production place of the photo-electric line electrons. So the gap between the model and the Livermore-Geant4 photo-electric line intensities presented on Tab.1 is due to the difference between the photon absorption p.d.f. after . By the same way the gap between electron background is explained by the difference between photon absorption p.d.f. before .
| Energies | Model | Livermore-Geant4 | Ratios |
|---|---|---|---|
4.3 Comparison between model nanoparticle and plane surface electron emission
To compare a gold nanoparticle of radius and a gold infinite plane surface electron emission, we normalize both spectra by the number of absorbed photons. The results are presented on Fig.11 for electron emission spectra and on Tab.2 for photo-electric line intensities.
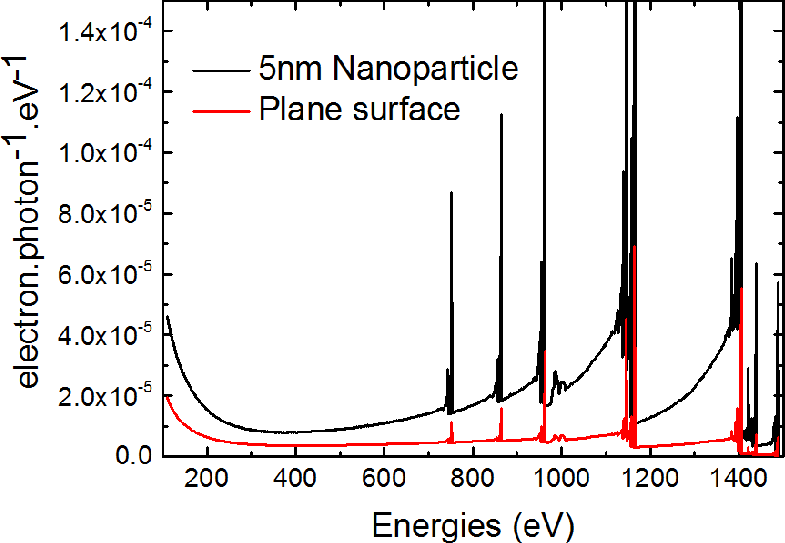
We can see that the number of emitted electrons by photon absorption is much greater for the nanoparticle than for the gold plane surface. This is due to the small nanoparticle size. Indeed each photon absorbed by the nanoparticle produces an electron cascade which as seen on Fig.2 is at a distance of a few nanometers of the nanoparticle surface. So there is a high probability that this cascade creates electrons at the nanoparticle surface.
As seen in Fig.12, in the infinite plane surface, all the photons are absorbed but for most of them this happens too deep from the surface to create electron cascades which have a reasonable chance to reach the surface. Indeed by observing the electron cascade p.d.f. on Fig.4, we see that after there is almost no chance for these electrons to reach the surface.
| Energies | 5nm Nanoparticle | Plane Surface | Ratios |
|---|---|---|---|
In order to compare in details both normalized electron emission, we draw their ratios i.e. we divide the radius gold nanoparticle electron emission spectra intensity by the corresponding gold plane surface intensity. The resulting ratio is presented on Fig.13 for spectra and on Tab.2 for photo-electric line intensities.
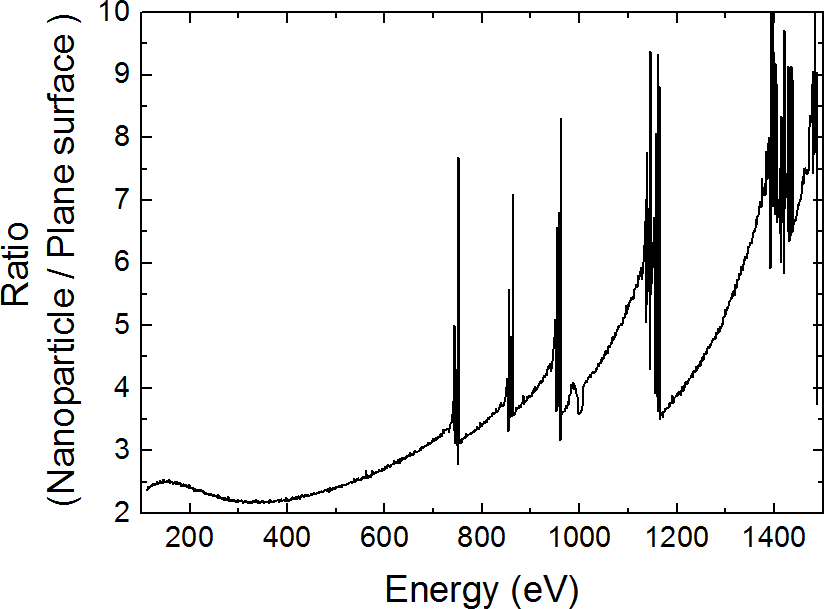
We observe on Tab.2 that the photo-electric line intensities normalized to the absorbed photon number are much larger (between and times) for nanoparticle than for the plane surface. We also observe on the spectra ratio Fig.13 that after each peak the ratio slowly decreases, as a consequence of the electron cascade p.d.f. .
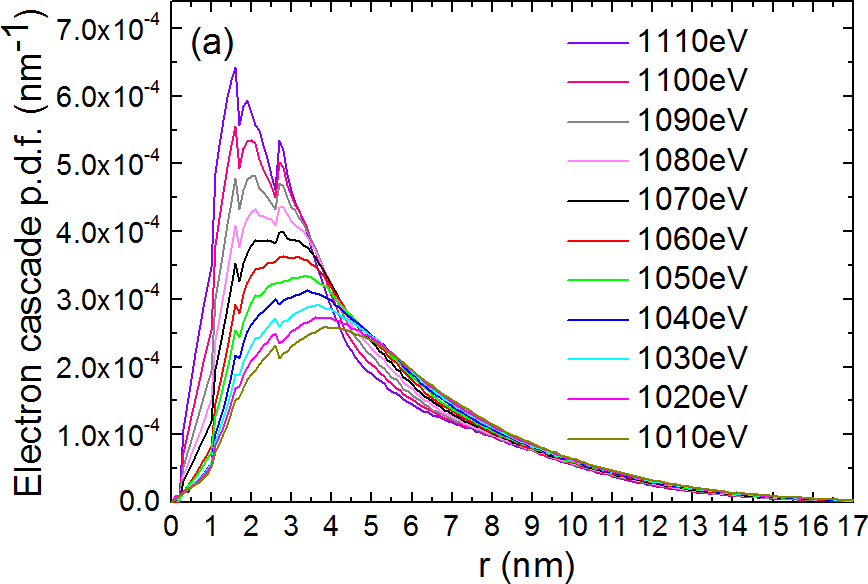
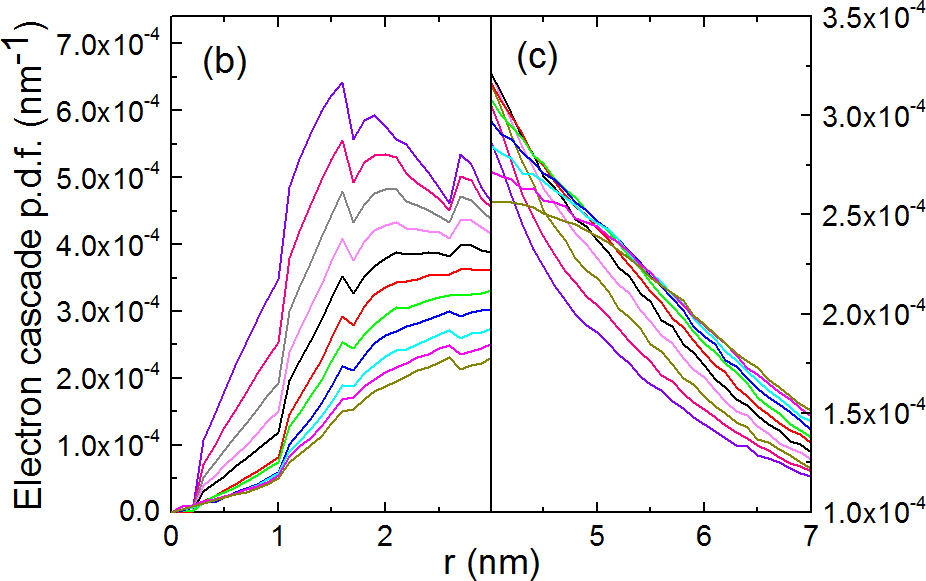
We present this p.d.f. as a function of the distance from absorption point, for energies between and on Fig.14. We see that the further we move down from the peak energy ( in our case), the lower are the probabilities to find an electron at a small distance from the absorption point (Fig.14(b)). On the other hand, as we move down from the peak energy we observe an increase of the p.d.f. for values between and (Fig.14(c)) and there is clearly a shift of maximum to larger values (Fig.14(a)).
In a radius nanoparticle, we know that most of the absorption points are close from the surface (). Consequently, the nanoparticle electron emission is strongly affected by the decrease of p.d.f. at small values. The plane surface absorptions are located as seen previously further from the surface and are less affected by this decrease.
For these reasons, as we move down from the peak energy, there is a stronger decrease for nanoparticle electron intensities than for plane surfaces, explaining the ratio decrease between both electron emissions.
4.4 Radius impact on nanoparticle electron emission
One of the main interest of our model is that we can keep the same electron cascade p.d.f. but easily change the nanoparticle radius, which is a critical parameter. This is an important gain of computing time compared to a full Monte-Carlo simulation approach classically used. To study the radius influence over the electron emission, we compute it for several radii from to and present few of them on Fig.15. We observe that the electron emission rapidly increases from to and then saturates. The spectrum form does not seem to depend of the nanoparticle radius.
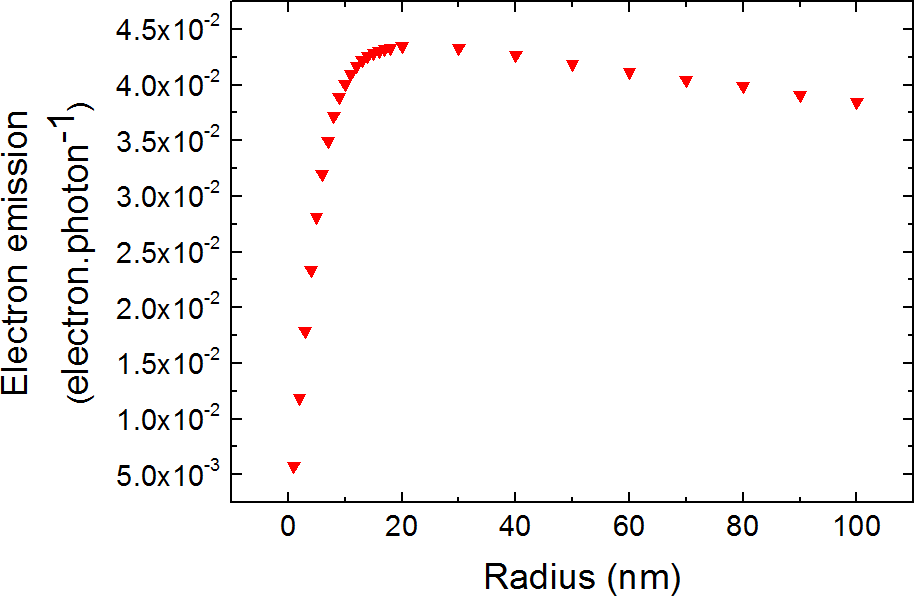
To have a more accurate information about the radius influence, we draw the nanoparticle electron emission integrated over the ejected electrons energy from to as a function of the nanoparticle radius on Fig.16. We see, as expected, an important increase from to and then a slow decrease.
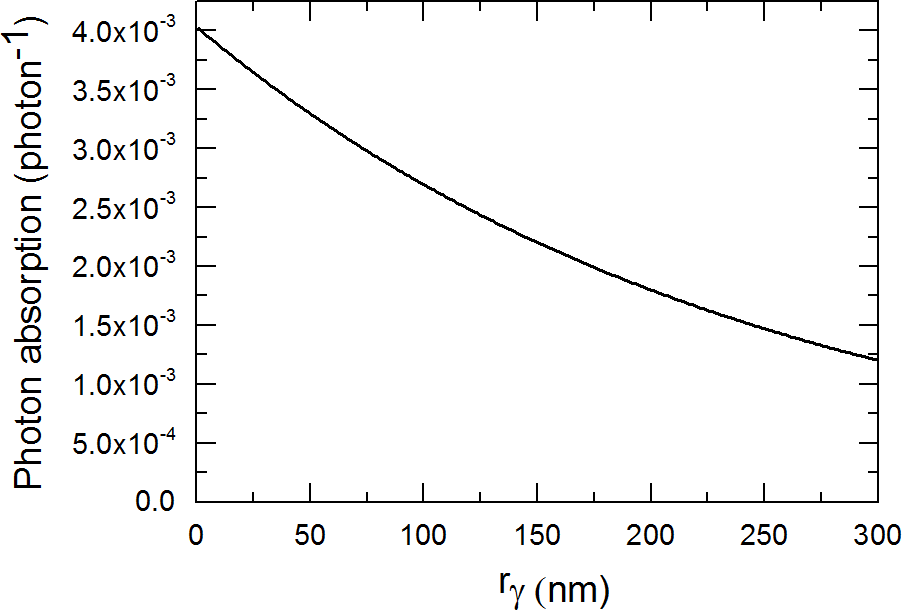
These features can be explained qualitatively by the total photon absorption p.d.f. as a function of nanoparticle radius, shown on Fig.17, and by the gold electron cascade p.d.f.
(Fig.18)
i.e. the p.d.f. that an electron cascade produces an electron at a distance of its production place.
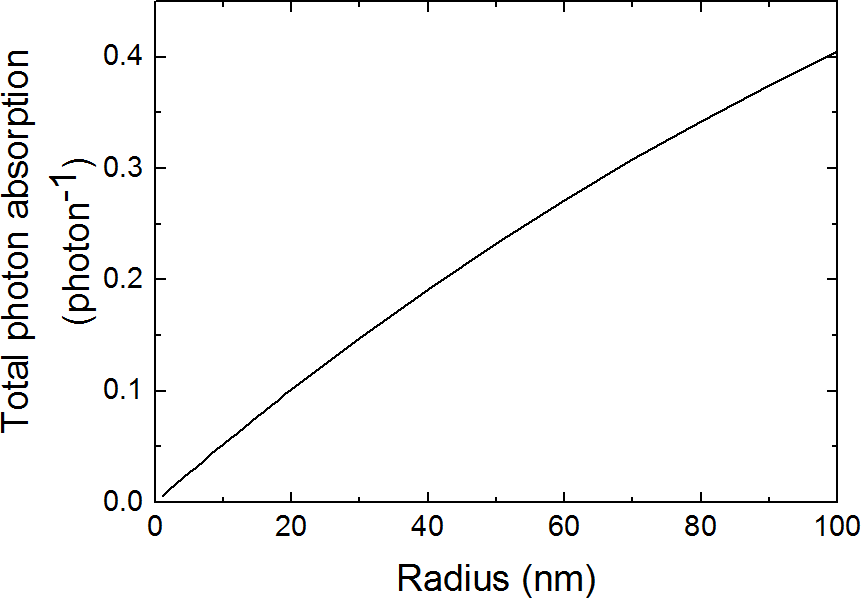
The total photon absorption (Fig.17) shows an increase with the nanoparticle radius, which in turn causes an increase in the first part of the total electron emission (Fig.16). Indeed if there are more photon absorbed, there are more photo-electrons produced, more electron cascades and consequently more electrons ejected at the surface.
This increase of the total electron emission stops at a maximum located at . Further a slow decrease appears because the number of electron cascades able to reach the surface is less and less important. As seen on Fig.18, once the distance from the absorption point is larger than the further an electron cascade is created from the absorption point, the lower its probability to reach the surface and eject electrons.
Up to as long as the electron emission increases, the total electron emission curve of Fig.16 follows the total absorption increase, because it is not counterbalanced by the decrease of the electron cascade p.d.f.. In small nanoparticles most of the electron cascade production points are closer than from the surface. As a consequence their probability to reach the surface is roughly stable as shown by Fig.18. For larger nanoparticles, the number of electron production points further than from the surface becomes significant and the absorption increase is counterbalanced by the decrease of the electron cascade p.d.f..
5 Conclusion
We developed an original model for the electron emission of high-Z nanoparticle and plane surface irradiated by X-ray photons. After checking that this model is compatible with the Livermore model implemented in Geant4, we used it to study the electron emission of a gold nanoparticle irradiated by photons. This model allowed us to deeply understand key features and parameters of nanoparticle electron emission: nanoparticle size, difference between nanoparticle and plane surface electron emission, electron cascade production depth, incident photon energy. This work highlights the existence of a nanoparticle radius corresponding to a maximum electron emission. This model can be simplified by doing approximations and other electron cascade models can be included. It can be checked with other simulation codes, photon energies or nanoparticle compositions.
References
- Agostinelli et al [2003] Agostinelli S, Allison J, Amako K, Apostolakis J, Araujo H, Arce P, Asai M, Axen D, Banerjee S, Barrand G, Behner F, Bellagamba L, Boudreau J, Broglia L, Brunengo A, Burkhardt H, Chauvie S, Chuma J, Chytracek R, Cooperman G, Cosmo G, Degtyarenko P, Dell’Acqua A, Depaola G, Dietrich D, Enami R, Feliciello A, Ferguson C, Fesefeldt H, Folger G, Foppiano F, Forti A, Garelli S, Giani S, Giannitrapani R, Gibin D, Cadenas JG, González I, Abril GG, Greeniaus G, Greiner W, Grichine V, Grossheim A, Guatelli S, Gumplinger P, Hamatsu R, Hashimoto K, Hasui H, Heikkinen A, Howard A, Ivanchenko V, Johnson A, Jones F, Kallenbach J, Kanaya N, Kawabata M, Kawabata Y, Kawaguti M, Kelner S, Kent P, Kimura A, Kodama T, Kokoulin R, Kossov M, Kurashige H, Lamanna E, Lampén T, Lara V, Lefebure V, Lei F, Liendl M, Lockman W, Longo F, Magni S, Maire M, Medernach E, Minamimoto K, de Freitas PM, Morita Y, Murakami K, Nagamatu M, Nartallo R, Nieminen P, Nishimura T, Ohtsubo K, Okamura M, O’Neale S, Oohata Y, Paech K, Perl J, Pfeiffer A, Pia M, Ranjard F, Rybin A, Sadilov S, Salvo ED, Santin G, Sasaki T, Savvas N, Sawada Y, Scherer S, Sei S, Sirotenko V, Smith D, Starkov N, Stoecker H, Sulkimo J, Takahata M, Tanaka S, Tcherniaev E, Tehrani ES, Tropeano M, Truscott P, Uno H, Urban L, Urban P, Verderi M, Walkden A, Wander W, Weber H, Wellisch J, Wenaus T, Williams D, Wright D, Yamada T, Yoshida H, Zschiesche D (2003) Geant4 a simulation toolkit. Nuclear Instruments and Methods in Physics Research Section A: Accelerators, Spectrometers, Detectors and Associated Equipment 506(3):250 – 303
- Allison et al [2006] Allison J, Amako K, Apostolakis J, Araujo H, Dubois P, Asai M, Barrand G, Capra R, Chauvie S, Chytracek R, Cirrone GAP, Cooperman G, Cosmo G, Cuttone G, Daquino GG, Donszelmann M, Dressel M, Folger G, Foppiano F, Generowicz J, Grichine V, Guatelli S, Gumplinger P, Heikkinen A, Hrivnacova I, Howard A, Incerti S, Ivanchenko V, Johnson T, Jones F, Koi T, Kokoulin R, Kossov M, Kurashige H, Lara V, Larsson S, Lei F, Link O, Longo F, Maire M, Mantero A, Mascialino B, McLaren I, Lorenzo P, Minamimoto K, Murakami K, Nieminen P, Pandola L, Parlati S, Peralta L, Perl J, Pfeiffer A, Pia M, Ribon A, Rodrigues P, Russo G, Sadilov S, Santin G, Sasaki T, Smith D, Starkov N, Tanaka S, Tcherniaev E, Tome B, Trindade A, Truscott P, Urban L, Verderi M, Walkden A, Wellisch JP, Williams D, Wright D, Yoshida H (2006) Geant4 developments and applications. Nuclear Science, IEEE Transactions on 53(1):270–278
- Brun et al [2009] Brun E, Cloutier P, Sicard-Roselli C, Fromm M, Sanche L (2009) Damage induced to dna by low-energy (0-30 ev) electrons under vacuum and atmospheric conditions. Journal of Physical Chemistry B 113(29):10,008–10,013
- Butterworth et al [2008] Butterworth KT, Wyer JA, Brennan-Fournet M, Latimer CJ, Shah MB, Currell FJ, Hirst DG (2008) Variation of strand break yield for plasmid dna irradiated with high-z metal nanoparticles. Radiation Research 170(3):381–387
- Carter et al [2007] Carter JD, Cheng NN, Qu Y, Suarez GD, Guo T (2007) Nanoscale energy deposition by x-ray absorbing nanostructures. Journal of Physical Chemistry B 111(40):11,622–11,625
- Casta et al [2014] Casta R, Champeaux JP, Sence M, Moretto-Capelle P, Cafarelli P, Amsellem A, Sicard-Roselli C (2014) Electronic emission of radio-sensitizing gold nanoparticles under x-ray irradiation : experiment and simulations. Journal of Nanoparticle Research 16(4):2348
- Chithrani et al [2010] Chithrani DB, Jelveh S, Jalali F, van Prooijen M, Allen C, Bristow RG, Hill RP, Jaffray DA (2010) Gold nanoparticles as radiation sensitizers in cancer therapy. Radiation Research 173(6):719–728
- Chow et al [2012] Chow JCL, Leung MKK, A JD (2012) Monte Carlo simulation on a gold nanoparticle irradiated by electron beams. Phys Med Biol 57:3323–3331
- Garnica-Garza [2013] Garnica-Garza H (2013) Microdosimetry of x-ray irradiated gold nanoparticles. Radiation Protection Dosimetry 155:59–63
- Hainfeld et al [2004] Hainfeld JF, Slatkin DN, Smilowitz HM (2004) The use of gold nanoparticles to enhance radiotherapy in mice. Physics in Medicine and Biology 49
- Herold et al [2000] Herold D, Das I, Stobbe C, Iyer R, Chapman J (2000) Gold microspheres: a selective technique for producing biologically effective dose enhancement. International Journal of Radiation Biology 76(10):1357–1364
- Kennedy et al [2011] Kennedy LC, Bickford LR, Lewinski NA, Coughlin AJ, Hu Y, Day ES, West JL (2011) A new era for cancer treatment: Gold-nanoparticle-mediated thermal therapies. Small 17:169–183
- Lechtman et al [2011] Lechtman E, Chattopadhyay N, Cai Z, Mashouf S, Reilly R, Pignol JP (2011) Implications on clinical scenario of gold nanoparticle radiosensitization in regards to photon energy, nanoparticle size, concentration and location. Physics in Medicine and Biology 56(15):4631–4647
- Lechtman et al [2013] Lechtman E, Mashouf S, Chattopadhyay N, Keller B, Lai P, Cai Z, Reilly R, J-P P (2013) A Monte Carlo-based model of gold nanoparticle radiosensitization accounting for increased radiobiological effectiveness. Phys Med Biol 58:3075–3087
- McMahon et al [2011] McMahon SJ, Hyland WB, Muir MF, Coulter JA, Jain S, Butterworth KT, Schettino G, Dickson GR, Hounsell AR, O’Sullivan JM, Prise KM, Hirst DG, Currell FJ (2011) Biological consequences of nanoscale energy deposition near irradiated heavy atom nanoparticles. SCIENTIFIC REPORTS 1
- Salvat et al [2011] Salvat F, Fernández-Varea JM, Sempau J (2011) Penelope-2011: A code system for Monte Carlo simulation for electron and photon transport, https://www.oecd-nea.org/science/docs/2011/nsc-doc2011-5.pdf
- Sanche [2009] Sanche L (2009) Role of secondary low energy electrons in radiobiology and chemoradiation therapy of cancer. Chemical Physics Letters 474:1–6
- Schaeublin et al [2011] Schaeublin NM, Braydich-Stolle LK, Schrand AM, Miller JM, Hutchison J, Schlager JJ, Hussain SM (2011) Surface charge of gold nanoparticles mediates mechanism of toxicity. Nanoscale 3:410
- Sharma and Chen [2009] Sharma R, Chen CJ (2009) Newer nanoparticles in hyperthermia treatment and thermometry. Journal of Nanoparticle Research 11(3):671–689
- Vujacic et al [2011] Vujacic A, Vodnik V, Joksic G, Petrovic S, Leskovac A, Nastasijevic B, Vasic V (2011) Particle size and concentration dependent cytotoxicity of citrate capped gold nanoparticles. Digest Journal of Nanomaterials and Biostructures 6(3):1367–1376
-
Wright [2012]
Wright D (2012) Geant4 10.0 - Physics reference manual, http://geant4.web.cern.ch/geant4/UserDocumentation/
UsersGuides/PhysicsReferenceManual/fo/PhysicsReferenceManual.pdf