Spectral weight transfer in strongly-correlated Fe1.03Te
Abstract
The temperature dependence of the in-plane optical conductivity has been determined for Fe1.03Te above and below the magnetic and structural transition at K. The electron and hole pockets are treated as two separate electronic subsystems; a strong, broad Drude response that is largely temperature independent, and a much weaker, narrow Drude response with a strong temperature dependence. Spectral weight is transferred from high to low frequency below , resulting in the dramatic increase of both the low-frequency conductivity and the related plasma frequency. The change in the plasma frequency is due to an increase in the carrier concentration resulting from the closing of the pseudogap on the electron pocket, as well as the likely decrease of the effective mass in the antiferromagnetic state.
pacs:
72.15.-v, 75.50.Bb, 78.30.-jThe discovery of superconductivity at high temperatures in the iron-arsenic materials Kamihara et al. (2008); Ren et al. (2008); Johnston (2010) prompted the search for this phenomenon in other iron-based systems, including the iron-chalocogenide materials. FeSe is an ambient-pressure superconductor with a critical temperature K; while the partial substitution of Te for Se almost doubles the , the end compound FeTe is not a superconductor Khasanov et al. (2009). For nearly stoichiometric Fe1+δTe there is a first-order structural and magnetic transition Bao et al. (2009); Zaliznyak et al. (2011, 2012) from a tetragonal, paramagnetic (PM) state to a monoclinic, antiferromagnetic (AFM) state at K. In the low-temperature phase a bond-order wave is observed that has been attributed to ferro-orbital ordering Fobes et al. (2014). At ambient pressure, the structural and magnetic properties depend strongly on the amount of excess Fe Liu et al. (2011); Rodriguez et al. (2011). Fe1+δTe is a poor metal that exhibits a non-metallic resistivity that increases with decreasing temperature Chen et al. (2009); Hancock et al. (2010); Jiang et al. (2013); at the resistivity drops discontinuously, followed by a metallic response decreasing steadily with temperature. Optical works on Fe1+δTe observe a rapid increase in the low-frequency optical conductivity below that has been attributed to a reduction of the free-carrier scattering rate Chen et al. (2009); Hancock et al. (2010). Electronic structure calculations reveal the multiband nature of this material with three hole-like bands at the center of the Brillouin zone and two electron-like bands at the corners Subedi et al. (2008); this result is in agreement with Hall-effect measurements in Fe1+δTe where both the electron and hole carriers are observed Tsukada et al. (2011). Angle-resolved photoemission spectroscopy (ARPES) is able to observe some of the predicted bands, but they are strongly renormalized with a large mass enhancement , suggesting a strongly-correlated metal Xia et al. (2009); Tamai et al. (2010); Zhang et al. (2010); Liu et al. (2013); Qazilbash et al. (2009). The enhancement of the effective mass in the PM state has been attributed to an orbital blocking mechanism Yin et al. (2011). In addition, a pseudogap of meV has been observed on the electron pocket in the PM state that closes in the AFM state Lin et al. (2013). The multiband nature of this material suggests that an analysis of the optical data that considers two different types of free-carrier contributions is in order Wu et al. (2010).
In this Letter we report on the detailed temperature dependence of the in-plane optical conductivity of Fe1.03Te above and below where the electron and hole pockets have been treated as two separate electronic subsystems. We infer that the hole pocket has a large scattering rate, resulting in an almost incoherent response that is largely temperature independent. This is in contrast to the low-frequency conductivity associated with the electron pocket, which while roughly constant above , increases anomalously at low temperature. This behavior is accompanied by a transfer of spectral weight over much of the mid-infrared region to low energy. The striking increase in the low-frequency conductivity is due to a dramatic increase in the plasma frequency associated with the electron pocket below , suggesting that we are observing the closing of the pseudogap with a commensurate increase in the carrier concentration, as well as a possible reduction in the effective mass.
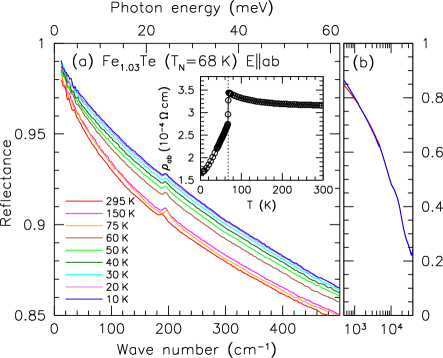
Single crystals with good cleavage planes (001) were grown by a unidirectional solidification method with a nominal composition of Fe1.03Te and a magnetic and structural transition at K. The reflectance from the cleaved surface of a mm-sized single crystal has been measured at a near-normal angle of incidence for several temperatures above and below over a wide frequency range ( meV to 4 eV) for light polarized in the a-b planes using an in situ overcoating technique Homes et al. (1993). The temperature dependence of the reflectance of Fe1.03Te is shown in Fig. 1(a) in the far-infrared region and at higher energies in Fig. 1(b). Above the reflectance is metallic but shows relatively little temperature dependence; however, below the reflectance increases rapidly in this region. This behavior is consistent with the resistivity (shown in the inset) which increases slightly from room temperature to just above , but which decreases rapidly below . In order to understand the metallic behavior of this material below , the complex conductivity has been determined from a Kramers-Kronig analysis of the reflectance Dressel and Grüner (2001), which requires the reflectance to be determined over the entire frequency interval. Given the conducting nature of this material, the Hagen-Rubens form for the reflectance is used in the limit, , where is chosen to match the data at the lowest-measured frequency point. Above the highest-measured frequency the reflectance is assumed to be constant up to cm-1, above which a free electron gas asymptotic reflectance extrapolation is assumed Wooten (1972).
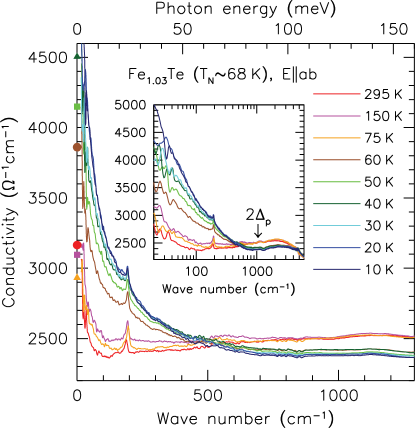
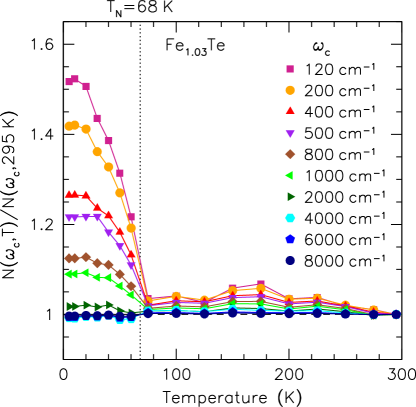
The real part of the in-plane optical conductivity is shown in Fig. 2 for several temperatures above and below . The conductivity is difficult to explain within a simple Drude model, which would follow a form, where and is the free-carrier scattering rate. Above the conductivity is essentially frequency and temperature independent over much of the infrared region; only the region below cm-1 shows any indication of following a Drude-like response. Below there is a small but abrupt decrease in the conductivity over much of the mid-infrared region at the same time that the Drude-like component increases dramatically in strength, indicating a transfer of spectral weight from high to low frequency. The spectral weight is defined as the area under the conductivity curve over a given interval . The temperature dependence of the normalized spectral weight for different cut-off frequencies is shown in Fig. 3. For small cut-off frequencies the spectral weight is roughly constant for ; however, for it increase quickly. As the cut-off frequency is increased this behavior becomes less pronounced until by cm-1 the spectral weight of the free carriers has been completely captured and a temperature dependence is no longer observed. A redistribution of spectral weight below has also been observed in ARPES Zhang et al. (2010); Lin et al. (2013).
In a single-band material, the evolution of a low-frequency Drude response to an incoherent mid-infrared band may be explained in one of two ways. First, the Drude response may be superimposed on interband transitions, modeled as Lorentz oscillators, that begin at very low frequency; while there is evidence for transitions at energies as low as 30 meV in the iron-based materials Marsik et al. (2013); Valenzuela et al. (2013), this is still not low enough to reproduce incoherent component observed in this material. A second approach is to assume a strongly-renormalized scattering rate due to electronic correlations Allen and Mikkelsen (1977). However, Fe1+δTe is a multiband material Subedi et al. (2008), negating the application of the single-band model to this material. For simplicity, the multiple hole and electron bands are gathered into single electron and hole pockets that are treated as two separate electronic subsystems using the so-called two-Drude model Wu et al. (2010) with the complex dielectric function ,
| (1) |
where is the real part of the dielectric function at high frequency. In the first sum and are the square of the plasma frequency and scattering rate for the delocalized (Drude) carriers in the th band, respectively, and and are the carrier concentration and effective mass. In the second summation, , and are the position, width, and strength of the th vibration or bound excitation. The complex conductivity is (in units of cm-1).
The fits to the optical conductivity using this approach are in general quite good and reveal a strong, broad Drude component in combination with a narrow, much weaker Drude component; in addition, there are several strong, overdamped Lorentzian oscillators in the mid- and near-infrared regions. Below there is a suppression of the optical conductivity over much of the mid-infrared region and a transfer of spectral weight from high to low energy. This result is in agreement with previous optical work Hancock et al. (2010), and is similar to what is observed in the normal state of the superconducting iron-arsenic material Ba0.6K0.4Fe2As2 Dai et al. (2013). The strong Lorentzian oscillator centered in the mid infrared shifts to a somewhat higher frequency below , but its strength does not vary and it broadens only slightly. The results of the fits at several temperatures above and below are summarized in Table 1.
We infer from the observation of the hole-like band determined from scattering interference and the virtual absence of the electron band in a related material Allan et al. (2012), Hall effect Tsukada et al. (2011) and the calculated band structure Singh and Du (2008), that the broad, temperature-independent Drude component is associated with the hole pockets, and that the narrow, strongly temperature-dependent component is associated with the electron pockets.
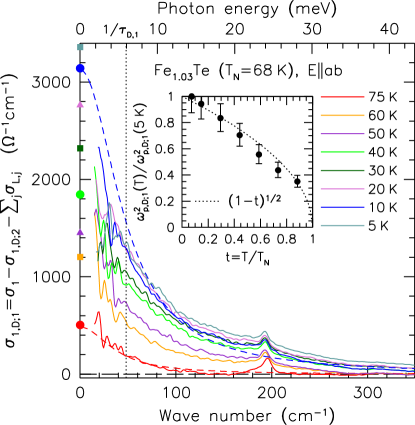
Although the optical conductivity is nearly frequency independent over much of the infrared region and displays little temperature dependence after entering the PM state, there is a dramatic increase in the low-frequency optical conductivity below . To isolate this behavior, the contributions of the broad Drude term and the Lorentzian oscillators (Table 1) have been removed, resulting in a residual component which we infer is due to the contribution to the optical conductivity from the electron pocket,
| (2) |
The resulting series of curves, shown in Fig. 4, have a Drude-like response. Using the contribution to the conductivity from the broad Drude term, , and the values determined from transport, , the dc conductivity values for the electron pocket should be ; these symbols are shown at the origin of Fig. 4. In the zero-frequency limit the conductivity extrapolates to these values reasonably well.
| T (K) | |||||
|---|---|---|---|---|---|
| 295 | 1010 | 805 | 3030 | ||
| 150 | 1200 | 776 | 3004 | ||
| 100 | 1180 | 780 | 3027 | ||
| 75 | 1050 | 786 | 3023 | ||
| 60 | 1850 | 788 | 3285 | ||
| 50 | 2035 | 765 | 3305 | ||
| 40 | 2300 | 774 | 3278 | ||
| 30 | 2570 | 784 | 3335 | ||
| 20 | 2820 | 782 | 3342 | ||
| 10 | 3010 | 772 | 3350 |
The Drude fits to the narrow component have been constrained to agree with these values and indicate that while is increasing rapidly below , the scattering rate is roughly constant. In fact, given that the Drude profile is a Lorentzian centered at zero frequency and the width at half maximum is the scattering rate, the fact that is not changing may be observed simply by inspection (dotted line in Fig. 4). The two dashed lines in Fig. 4 show the results of the fits just above and for ; in general the fits close to are quite good while for the fits are somewhat poorer, perhaps because there are in fact two electron pockets rather than just one we have used to model the low-frequency conductivity.
The rapid increase of the low-frequency conductivity below is striking. Normally, this behavior is associated with a decrease in the scattering rate, resulting in a narrowing of the Drude feature. While this narrowing results in the transfer of spectral weight from high to low frequency, the total weight associated with the individual Drude component should remain constant. However, not only does the scattering rate actually increase slightly upon entering the AFM state (whereupon it remains roughly constant below ), the spectral weight is observed to increase dramatically, indicating that is in fact the plasma frequency that is increasing. The temperature dependence of below shown in the inset of Fig. 4 follows a mean-field temperature dependence. Given the definition of , then either the carrier concentration is increasing or the effective mass is decreasing. However, in this instance there is evidence to suggest that both quantities are changing below .
In the PM state there is a partial gap (pseudogap) on the electron pocket of meV (525 cm-1) Lin et al. (2013). In the optical conductivity a pseudogap in the spectrum of excitations shifts spectral weight associated with the free-carriers in the electron pocket to energies above meV (1050 cm-1) resulting in a localized, incoherent response. This is precisely what is observed in Fig. 3, where is necessary to recover the full spectral weight. However, below the pseudogap is observed to close Lin et al. (2013) resulting in coherent charge transport; this is consistent with the appearance of quasiparticles below Zhang et al. (2010). As a result, the number of carriers in the electron pocket () will increase below with a commensurate increase in the plasma frequency, . In addition, there is also evidence that in the PM state of FeTe there is a large mass enhancement of the Fe orbital of ; this effect is attributed to an orbital-blocking mechanism Yin et al. (2011). In the AFM state the spin fluctuations are observed to decrease Zhang et al. (2010) and most signs of correlations disappear Lin et al. (2013), suggesting that orbital blocking, and as a consequence the effective mass, may be reduced below . Thus, the increase in and the decrease in may combine in tandem to lead to an increase of the plasma frequency for the carriers on the electron pocket in the AFM state.
To conclude, we have measured the in-plane optical properties of Fe1.03Te above and below . The optical conductivity has been described using the two-Drude model, revealing a strong component with a large scattering rate associated with the hole pocket that varies little with temperature, and a weaker component with a much smaller scattering rate associated with the electron pocket that displays a strong temperature dependence below . The plasma frequency associated with the carriers in the electron pocket increases anomalously below due to an increase in the carrier concentration following the closing of the pseudogap, as well as the possible decrease of the effective mass in the AFM state.
The authors thank J. C. Davis, K. Haule, J. Hwang, G. Kotliar, J. H. Shim, and I. Zaliznyak for helpful discussions. Research supported by the U.S. Department of Energy (DOE), Office of Basic Energy Sciences, Division of Materials Sciences and Engineering under Contract No. DE-AC02-98CH10886. RDZ and JS were supported by the Center for Emergent Superconductivity, an Energy Frontier Research Center, DOE.
References
- Kamihara et al. (2008) Y. Kamihara, T. Watanabe, M. Hirano, and H. Hosono, J. Am. Chem. Soc. 130, 3296 (2008).
- Ren et al. (2008) Z.-A. Ren, J. Yang, W. Lu, W. Yi, X.-L. Shen, Z.-C. Li, G.-C. Che, X.-L. Dong, L.-L. Sun, F. Zhou, and Z.-X. Zhao, EPL 82, 57002 (2008).
- Johnston (2010) D. C. Johnston, Adv. Phys. 59, 803 (2010).
- Khasanov et al. (2009) R. Khasanov, M. Bendele, A. Amato, P. Babkevich, A. T. Boothroyd, A. Cervellino, K. Conder, S. N. Gvasaliya, H. Keller, H.-H. Klauss, H. Luetkens, V. Pomjakushin, E. Pomjakushina, and B. Roessli, Phys. Rev. B 80, 140511(R) (2009).
- Bao et al. (2009) W. Bao, Y. Qiu, Q. Huang, M. A. Green, P. Zajdel, M. R. Fitzsimmons, M. Zhernenkov, S. Chang, M. Fang, B. Qian, E. K. Vehstedt, J. Yang, H. M. Pham, L. Spinu, and Z. Q. Mao, Phys. Rev. Lett. 102, 247001 (2009).
- Zaliznyak et al. (2011) I. A. Zaliznyak, Z. Xu, J. M. Tranquada, G. Gu, A. M. Tsvelik, and M. B. Stone, Phys. Rev. Lett. 107, 216403 (2011).
- Zaliznyak et al. (2012) I. A. Zaliznyak, Z. J. Xu, J. S. Wen, J. M. Tranquada, G. D. Gu, V. Solovyov, V. N. Glazkov, A. I. Zheludev, V. O. Garlea, and M. B. Stone, Phys. Rev. B 85, 085105 (2012).
- Fobes et al. (2014) D. Fobes, I. A. Zaliznyak, Z. Xu, R. Zhong, G. Gu, J. M. Tranquada, L. Harriger, D. Singh, V. O. Garlea, M. Lumsden, and B. Winn, Phys. Rev. Lett. 112, 187202 (2014).
- Liu et al. (2011) X. Liu, C.-C. Lee, Z. J. Xu, J. S. Wen, G. Gu, W. Ku, J. M. Tranquada, and J. P. Hill, Phys. Rev. B 83, 184523 (2011).
- Rodriguez et al. (2011) E. E. Rodriguez, C. Stock, P. Zajdel, K. L. Krycka, C. F. Majkrzak, P. Zavalij, and M. A. Green, Phys. Rev. B 84, 064403 (2011).
- Chen et al. (2009) G. F. Chen, Z. G. Chen, J. Dong, W. Z. Hu, G. Li, X. D. Zhang, P. Zheng, J. L. Luo, and N. L. Wang, Phys. Rev. B 79, 140509 (2009).
- Hancock et al. (2010) J. N. Hancock, S. I. Mirzaei, J. Gillett, S. E. Sebastian, J. Teyssier, R. Viennois, E. Giannini, and D. van der Marel, Phys. Rev. B 82, 014523 (2010).
- Jiang et al. (2013) J. Jiang, C. He, Y. Zhang, M. Xu, Q. Q. Ge, Z. R. Ye, F. Chen, B. P. Xie, and D. L. Feng, Phys. Rev. B 88, 115130 (2013).
- Subedi et al. (2008) A. Subedi, L. Zhang, D. J. Singh, and M. H. Du, Phys. Rev. B 78, 134514 (2008).
- Tsukada et al. (2011) I. Tsukada, M. Hanawa, S. Komiya, A. Ichinose, T. Akiike, Y. Imai, and A. Maeda, Physica C: Superconductivity 471, 625 (2011), the 23rd International Symposium on Superconductivity.
- Xia et al. (2009) Y. Xia, D. Qian, L. Wray, D. Hsieh, G. F. Chen, J. L. Luo, N. L. Wang, and M. Z. Hasan, Phys. Rev. Lett. 103, 037002 (2009).
- Tamai et al. (2010) A. Tamai, A. Y. Ganin, E. Rozbicki, J. Bacsa, W. Meevasana, P. D. C. King, M. Caffio, R. Schaub, S. Margadonna, K. Prassides, M. J. Rosseinsky, and F. Baumberger, Phys. Rev. Lett. 104, 097002 (2010).
- Zhang et al. (2010) Y. Zhang, F. Chen, C. He, L. X. Yang, B. P. Xie, Y. L. Xie, X. H. Chen, M. Fang, M. Arita, K. Shimada, H. Namatame, M. Taniguchi, J. P. Hu, and D. L. Feng, Phys. Rev. B 82, 165113 (2010).
- Liu et al. (2013) Z. K. Liu, R.-H. He, D. H. Lu, M. Yi, Y. L. Chen, M. Hashimoto, R. G. Moore, S.-K. Mo, E. A. Nowadnick, J. Hu, T. J. Liu, Z. Q. Mao, T. P. Devereaux, Z. Hussain, and Z.-X. Shen, Phys. Rev. Lett. 110, 037003 (2013).
- Qazilbash et al. (2009) M. M. Qazilbash, J. J. Hamlin, R. E. Baumbach, L. Zhang, D. J. Singh, M. B. Maple, and D. N. Basov, Nat. Phys. 5, 647 (2009).
- Yin et al. (2011) Z. P. Yin, K. Haule, and G. Kotliar, Nat. Mater. 10, 932 (2011).
- Lin et al. (2013) P.-H. Lin, Y. Texier, A. Taleb-Ibrahimi, P. Le Fèvre, F. Bertran, E. Giannini, M. Grioni, and V. Brouet, Phys. Rev. Lett. 111, 217002 (2013).
- Wu et al. (2010) D. Wu, N. Barišić, P. Kallina, A. Faridian, B. Gorshunov, N. Drichko, L. J. Li, X. Lin, G. H. Cao, Z. A. Xu, N. L. Wang, and M. Dressel, Phys. Rev. B 81, 100512(R) (2010).
- Homes et al. (1993) C. C. Homes, M. Reedyk, D. A. Crandles, and T. Timusk, Appl. Opt. 32, 2976 (1993).
- Dressel and Grüner (2001) M. Dressel and G. Grüner, Electrodynamics of Solids (Cambridge University Press, Cambridge, 2001).
- Wooten (1972) F. Wooten, Optical Properties of Solids (Academic Press, New York, 1972) pp. 244–250.
- Marsik et al. (2013) P. Marsik, C. N. Wang, M. Rössle, M. Yazdi-Rizi, R. Schuster, K. W. Kim, A. Dubroka, D. Munzar, T. Wolf, X. H. Chen, and C. Bernhard, Phys. Rev. B 88, 180508 (2013).
- Valenzuela et al. (2013) B. Valenzuela, M. J. Calderón, G. León, and E. Bascones, Phys. Rev. B 87, 075136 (2013).
- Allen and Mikkelsen (1977) J. W. Allen and J. C. Mikkelsen, Phys. Rev. B 15, 2952 (1977).
- Dai et al. (2013) Y. M. Dai, B. Xu, B. Shen, H. Xiao, H. H. Wen, X. G. Qiu, C. C. Homes, and R. P. S. M. Lobo, Phys. Rev. Lett. 111, 117001 (2013).
- Allan et al. (2012) M. P. Allan, A. W. Rost, A. P. Mackenzie, Y. Xie, J. C. Davis, K. Kihou, C. H. Lee, A. Iyo, H. Eisaki, and T.-M. Chuang, Science 336, 563 (2012).
- Singh and Du (2008) D. J. Singh and M.-H. Du, Phys. Rev. Lett. 100, 237003 (2008).