Polarisation Observations of H2O 620.701 GHz Maser Emission with HERSCHEL††thanks: Herschel is an ESA space observatory with science instruments provided by European-led Principal Investigator consortia and with significant participation from NASA. /HIFI in Orion KL
Abstract
Context. The high intensities and narrow bandwidths exhibited by some astronomical masers make them ideal tools for studying star-forming giant molecular clouds. The water maser transition at 620.701 GHz can only be observed from above Earth’s strongly absorbing atmosphere; its emission has recently been detected from space.
Aims. We sought to further characterize the star-forming environment of Orion KL by investigating the linear polarisation of a source emitting a narrow 620.701 GHz maser feature with the heterodyne spectrometer HIFI on board the Herschel Space Observatory.
Methods. High-resolution spectral datasets were collected over a thirteen month period beginning in 2011 March, to establish not only the linear polarisation but also the temporal variability of the source.
Results. Within a uncertainty, no polarisation was detected to an upper limit of approximately 2%. These results are compared with coeval linear polarisation measurements of the 22.235 GHz maser line from the Effelsberg 100-m radio telescope, typically a much stronger maser transition. Although strongly polarised emission is observed for one component of the 22.235 GHz maser at 7.2 km s-1, a weaker component at the same velocity as the 620.701 GHz maser at 11.7 km s-1 is much less polarised.
Key Words.:
masers - magnetic fields - polarization1 Introduction
The Kleinmann-Low nebula in the Orion Molecular Cloud 1 (OMC-1) is a high-mass star-forming region, the nearest such region in our Galaxy at 4186 pc (Kim et al., 2008). Its line-of-sight velocity relative to the local standard of rest (LSR) is about 8 km s-1 (Garay et al., 1989). Since the discovery of the 22.235 GHz water maser transition in the Orion Molecular Cloud (Cheung et al., 1969), the region has frequently been studied also at higher frequency maser transitions. Recently, Neufeld et al. (2013) mapped the theoretically predicted 620.701 GHz transition in the Kleinmann-Low Nebula (Orion KL) with Herschel/HIFI. Combining their observations with collocated 22.235 GHz Effelsberg data, they were able to verify a maser pumping model arising from collisional excitation and spontaneous radiative decay (Neufeld & Melnick, 1991). Hereafter, we will mostly refer to these frequencies as 22 GHz and 621 GHz.
The first astronomical detection of the 621 GHz maser transition of ortho water vapor (Neufeld & Melnick, 1991) was made by Harwit et al. (2010). It appeared to exhibit a polarisation of approximately 2% toward the oxygen-rich supergiant star VY Canis Majoris, and was a few times less luminous than the star’s ortho-H2O 22 GHz maser. The aforementioned study of Neufeld et al. (2013) presented the first detection of this transition in an interstellar region (i.e., Orion KL). Their maps of this region revealed a spatially localized source emitting a strong, spectrally narrow emission feature at 621 GHz. Their discovery of this feature gave rise to the present attempt to determine whether the 621 GHz feature might be linearly polarised. In a later search through the Herschel archives Neufeld et al. (2013) also found similarly narrow 621 GHz emission features emanating from the Orion South condensation and the W49N region of high-mass star formation. By then, however, the Herschel mission was ending and a search for signs of polarisation in these features were no longer possible. To date, the Heterodyne Instrument for the Far Infrared (HIFI) (de Graauw et al., 2010) onboard the Herschel Space Observatory (Pilbratt et al., 2010) has been the sole facility capable of linear polarisation studies of spectral lines at this frequency. Complementary circular polarisation studies, however, have remained beyond reach.
Between March 2011 and April 2012, we obtained six sets of observations of the 621 GHz line along a sight line toward Orion KL with the Herschel/HIFI instrument. We complemented these with observations of the 22 GHz line taken contemporaneously with the Max-Planck-Institut für Radioastronomie (MPIfR) 100-m telescope in Effelsberg, Germany. In Section 2 we report the results of these observations. We next present our polarisation results in Section 3, along with a depiction of the temporal behaviour of the maser line over this year-long period. Finally, Section 4 presents our conclusions, while the tabular summaries of our observations, our maps of the 621 GHz water maser, and a further discussion on pointing errors can be found in Appendices A, B, and C (on line material).
2 Observations
2.1 HIFI Observations
HIFI enables observations in fourteen frequency bands. We observed the 621 GHz transition in HIFI Band 1B, which covers the range from 562.6 to 628.4 GHz. Like all of the other HIFI bands, Band 1B houses two channels sensitive to linearly polarised radiation, respectively, in the horizontal (H) and vertical (V) directions. The two channels exhibit peak sensitivities along directions at angles of (H) and (V), relative to the Herschel spacecraft’s y-axis, kept close to perpendicular to the ecliptic plane at all times. On the sky, the H- and V-beams are offset from each other by , a non-negligible fraction of the full-width-half-magnitude (FWHM) beam at 620.701 GHz. Due to potential beam pointing errors, small offsets in the H- and V-beam from their intended positions may be expected, leading to uncertainty in the mean beam pointing direction. At the time of writing this was constrained to between ().
Observations were conducted beginning on 14 March 2011 when a small map was acquired using the HIFI “on-the-fly mapping” (OTF) mode, as part of the HEXOS Guaranteed Time Key Program (PI: E. Bergin). A total of fifteen Nyquist-sampled pointings were implemented in a rectangular, 5 by 3 configuration. Spectral data were obtained with the digital autocorrelation high-resolution spectrometer (HRS) and the wide-band spectrometer (WBS). The map was centered at (R.A.[J2000], decl.[J2000]), and spanned in Right Ascension and in Declination. Individual pointings were separated by in R.A. and in Declination. The spectral resolution in the HRS mode was 0.125 MHz, or, equivalently, a line-of-sight velocity resolution of 0.06 km s-1. The WBS resolution was MHz or km s-1. All observations used an OFF-source reference position located 14 from the maser location.
Following the mapping of 14 March 2011, two pointed observations were obtained that year, respectively, on 26 March and 8 April. Over this period the source rotated by about the spacecraft line-of-sight. Observations obtained at different times were necessary since a minimum of two sets of measurements at separate source rotation angles are required for polarisation analyses (Harwit et al., 2010). For pointed observations the central point on the line separating the H- and V-beam centers was directed at two successive positions on the sky, in position switching mode, in order to place the center of the H polarisation beam for a given integration to coincide with the center of the V polarisation beam for the subsequent integration – thus compensating for the misalignment between the beams.
After a preliminary analysis, follow-up observations were executed on 25 February and 14 April 2012. The first of these, performed in position switching mode, were centered at the same position cited above. Thereafter, on 14 April, the last of the pointed measurements was obtained, followed on the same day by a small map of the same dimensions as that of 14 March 2011. While the 2011 observations lasted 888 s, integrations in 2012 were extended to 1683 s in order to reduce the overall noise. The entirety of the investigation is summarised online in Table 1.
2.2 Effelsberg Observations
Ground-based observations were undertaken with the 100-m Effelsberg radio telescope in tandem with the HIFI observations of 2011 and 2012. Centered at 22 GHz, the transition of ortho water vapour, our observations consisted of linear polarisation signals obtained from two orthogonal channels of the band (1.3 cm) receiver located at the primary focus of the telescope. The Effelsberg beam profile can be approximated as a Gaussian with a FWHM of . The frequency resolution of each dataset was 6.104 kHz, corresponding to a velocity resolution of 0.082 km s-1, and the spectra were calibrated using corrections for gain-elevation and atmospheric attenuation.
Our measurements were composed of pairs of scans obtained at different source parallactic angles in each of the years 2011 and 2012. In 2011, the first scan at 17:45 UT on 21 March, lasting one hour, was followed by a second scan recorded at 20:09 UT the same day, the source having rotated by approximately by then. In 2012, pairs of observations were taken on 21 March and 18 April with corresponding source parallactic angle rotations of and , respectively. All of these pointed observations were collocated with the HIFI center position. At the same epochs, maps were also produced that were useful in more accurately describing the maser environment. A complete summary of the Effelsberg data is provided online in Table 2.
3 Methods/Results
3.1 Polarisation Analysis
As explained in Harwit et al. (2010), HIFI does not provide regular spacings with which the computation of the Stokes and parameters is simplest. Instead, we must rely on the position angles (PA) listed in Table 1 for the vertical polarisation direction, with the horizontal axis at . The Stokes and can then be calculated using the analysis detailed in Harwit et al. (2010), from which the polarisation fraction and angle are evaluated with
| (1) | |||||
| (2) |
respectively, with the total intensity. As explained below, this analysis has been applied to our entire set of HIFI 621 GHz data, with the 2011 and 2012 data sets combined to yield a single polarisation result of sufficient precision. The Effelsberg 22 GHz measurements were not affected by the same constraints and were considered separately for the respective 2011 and 2012 data sets.
3.2 HIFI data
The entire suite of observations listed online in Table 1 was considered, although only the center position of each of the maps (ObsIDs 1342215920-1 and 1342244411-2), where the maser intensity was strongest, was selected for analysis. All data were processed with version 8 of the Herschel Interactive Processing Environment (HIPE). Following an improvement in the absolute pointing error (APE) of the Herschel pointing products effective 19 Feb 2012 (Observation Day 1011) the reported center of the beam is accurate to within () for both position switching and OTF observations. Throughout our observations we found all pointings to lie within in Right Ascension and in Declination.
As shown in Table 1, the position angles of the telescope ranged more widely across the observing epochs in 2012 than in 2011. When combined with the 2011 data the three additional datasets of 2012 reduced the noise in polarisation intensity () from mK to mK. Both the Stokes and noise intensities dropped appreciably as well, to and mK, respectively.
Prior to deriving any polarisation measures, however, a marked change in the broad spectral component surrounding the narrow maser feature had to be taken into account. Although each dataset exhibits the broad component, its strength was clearly higher in the 2012 data, by almost as much as . As explained in Appendix C online, we believe that this change in the continuum level resulted from small pointing errors and the proximity of the powerfully emitting Orion “hot core.” Such differences, if resulting from pointing errors on an extended source, can render polarisation studies unreliable. Any claim about the polarisation of the maser line, therefore, required that it be separated from the underlying broad feature. To this end, two Gaussians were simultaneously fitted to the broad component and removed, to feature the maser line. From epoch to epoch there remained a substantial variability in the strength of the maser, at levels similar to those seen in the broad component itself. Nevertheless, we undertook a polarisation analysis on the assumption that the maser signals emanate from a single spatially unresolved (i.e., point-like) source in the region. As is discussed in Section 3.2.1, this assumption is consistent with the fact that we found no polarisation signatures above three standard deviations in the line, at a level of approximately . Figure 1 shows the result of the analysis after removal of the broad component; the lack of polarisation in the maser emission is apparent from the absence of a corresponding signature in polarised flux (pI) in the bottom panel. The aforementioned change in maser intensity was accompanied by a shift in the line center velocity of km s-1 across both the horizontal and vertical polarisations from observing epoch 2 to 3, a significant fraction of the width of the line ( km s-1).
These temporal changes in intensity and velocity are not surprising since, owing to their location in star forming regions, and in particular at the forefront of stellar shocks, masers generally have an intensity that varies strongly on relatively short time scales: it is thought that such turbulent environs, with their large velocity gradients, can induce more frequent fluctuations in intensity with changes in the velocity of the emission line (Stahler & Palla, 2004).

3.2.1 Pointing Effects on Maser Polarisation Measurements
We performed the same polarisation analysis discussed in Section 3.1 on a simulated spectrum to quantify the effect of our pointing uncertainties on measured maser polarisation signals. To do so the beam profile was approximated by a Gaussian function matching the FWHM of the HIFI beam at 620.701 GHz (), while the source was considered unpolarised and of no spatial extent (simulating a maser point source). Each simulated measurement was associated with one of our HIFI observations (see Table 1), including random pointing errors of about 3″, such as might reasonably be expected for HIFI. The peak intensity of a given measured spectrum would thus decrease as the pointing position drifted away from the source’s location. This analysis revealed weak polarisation levels averaging , consistent with the aforementioned upper limit resulting from our HIFI observations.
Although we cannot rule out the possibility that the totality of the 621 GHz maser flux we measure originates from the contributions of several spatially unresolved sources, our simple simulation seems to imply a lack of spatial extent for the overall maser emission, as compared to the HIFI beam. This feature allows for precise polarisation measurements when the pointing errors are sufficiently small. However, the same is not true for the broad component of the 621 GHz water line in view of potential source variations with pointing positions, as discussed in the online Appendix C.
3.3 22 GHz (Effelsberg) Data
The 22 GHz Effelsberg data, obtained during the same periods (although not precisely coeval), do not appear to be affected by the same source of emission responsible for the broad component in the 621 GHz transition. However, we also observed significant change in intensity on timescales of one to several months (i.e., between respectively 21 March 2012 and 18 April 2012, and 21 March 2011 and 18 April 2012), which imply some intrinsic source evolution with time. We find that the strongest component at km s-1 varies from K to K (or from 14 kJy to 26 kJy). These variations are in line with other observations performed at the position of peak intensity of the 22 GHz maser (located some east and south from our pointed observations) during approximately the same time period. More precisely, interferometric observations of Matveyenko et al. (2012) revealed significant outburst activity between July 2011 to May 2012 while tracking the evolution of velocity components at 7.0 km s-1 and 7.6 km s-1. Previously, in February 2011, Hirota et al. (2011) recorded a flare reaching an intensity of 44 kJy using the VLBI Exploration of Radio Astrometry interferometer. While, unlike our study, these observations were conducted at very high spatial resolutions ( mas), single-dish observations of Otto & Gaylard (2012) at approximately resolution also detected strong flares reaching as high as 80 kJy during an eight-month period spanning from March to November 2011.
We performed a polarization analysis on each of our Effelsberg data sets and found that the polarization levels did not appreciably change over the different epochs. Figure 2 shows the results of the analysis for the 21 March 2011 data. The top panel displays the Stokes spectra, along with several linear polarisation measures, while the bottom panel shows the polarisation flux and angles. Most noticeable are the high polarisation levels, of order at the center of the km s-1 feature. Elsewhere, the polarisation level is rather constant in the range, except for the second strongest feature at km s-1, where levels exceed . While there have been previous detections of polarisation of comparable levels (Horiuchi & Kameya, 2000; Garay et al., 1989), the aforementioned contemporaneous interferometric observations of Matveyenko et al. (2012) revealed lower polarization levels of about at km s-1.

4 Conclusion
We have reported the astronomical detection of the 621 GHz transition of the ortho H2O maser in the star-forming region Orion KL, which was also recently discussed by Neufeld et al. (2013). In observations with the Herschel/HIFI instrument the maser was found not to be linearly polarised to a 3 upper limit of . Low polarisation levels for water masers are not inconsistent with expectations from the mechanism of Goldreich, Keeley and Kwan (Goldreich et al., 1973), at least in the absence of radiative saturation (Watson, 2009). These results are also approximately in line with the low polarisations of a few percent found by Harwit et al. (2010).
Polarisation measurements of the HIFI data were complicated by the strengthening of a broad pedestal component in data from 2011 to 2012. We concluded that this feature is likely to be the result of pointing artifacts. Attempts were also made to settle the change in maser line strengths between the two observing epochs but the question remains to be resolved.
Acknowledgements.
We thank D. Neufeld et al. (2013) for alerting us to the presence of the 621 GHz transition prior to publication. HIFI has been designed and built by a consortium of institutes and university departments from across Europe, Canada and the United States under the leadership of SRON Netherlands Institute for Space Research, Groningen, The Netherlands and with major contributions from Germany, France, and the US. Consortium members are: Canada: CSA, U. Waterloo; France: CESR, LAB, LERMA, IRAM; Germany: KOSMA, MPIfR, MPS; Ireland: NUI Maynooth; Italy: ASI, IFSI-INAF, Osservatorio Astrofisico di Arcetri- INAF; Netherlands: SRON, TUD; Poland: CAMK, CBK; Spain: Observatorio Astronomico Nacional (IGN), Centro de Astrobiología (CSIC-INTA); Sweden: Chalmers University of Technology - MC2, RSS & GARD, Onsala Space Observatory, Swedish National Space Board, Stockholm University - Stockholm Observatory; Switzerland: ETH Zurich, FHNW; USA: Caltech, JPL, NHSC.Partly based on observations with the 100-m telescope of the MPIfR (Max-Planck-Institut für Radioastronomie) at Effelsberg.
M.H.’s research is funded through the NSERC Discovery Grant, Canada Research Chair, and Western’s Academic Development Fund programs.
The work of M.O.H. has been supported by NASA through awards of JPL subcontracts 1393122 and 1463766 to Cornell University.
References
- Beuther et al. (2005) Beuther, H., Zhang, Q., Greenhill, L., et al. 2005, ApJ., 632, 355
- Cheung et al. (1969) Cheung, A., Rank, D., Townes, C., Thornton, D., & Welch, W. 1969, Nature, 221, 626
- de Graauw et al. (2010) de Graauw, T., Helmich, F., Phillips, T., et al. 2010, A&A, 518, L6
- Garay et al. (1989) Garay, G., Moran, J., & Haschick, A. 1989, ApJ, 338, 244
- Goldreich et al. (1973) Goldreich, P., Keeley, D., & Kwan, J. 1973, ApJ., 179, 111
- Harwit et al. (2010) Harwit, M., Houde, M., Sonnentrucker, P., et al. 2010, A&A, 521, L51
- Hirota et al. (2011) Hirota, T., Tsuboi, M., Fujisawa, K., et al. 2011, ApJ., 739, L59
- Horiuchi & Kameya (2000) Horiuchi, S. & Kameya, O. 2000, Publ. Astron. Soc. Japan, 52, 545
- Kim et al. (2008) Kim, M. K., Hirota, T., & Honma, M. 2008, PASJ, 60, 991
- Matveyenko et al. (2012) Matveyenko, L., Demichev, V., Ipatov, A., Melnikov, A., & Surkis, I. 2012, Astronomy Letters, 38, 764
- Neufeld & Melnick (1991) Neufeld, D. & Melnick, G. 1991, ApJ., 368, 215
- Neufeld et al. (2013) Neufeld, D. A., Menten, K. M., Kraus, A., et al. 2013, ApJ., 769, 48
- Otto & Gaylard (2012) Otto, S. & Gaylard, M. 2012, in Proceedings IAU Symposium No. 287
- Pilbratt et al. (2010) Pilbratt, G., Riedinger, J., Passvogel, T., et al. 2010, A&A, 518, L1
- Stahler & Palla (2004) Stahler, S. W. & Palla, F. 2004, The Formation of Stars (Wiley-VCH)
- Watson (2009) Watson, W. 2009, in RevMexAA, Serie de Conferencias, 113
Appendix A Summary of Herschel/HIFI and Effelsberg Observations
| Observation | Observation | Observation | Date | System Temperature | Position Anglea𝑎aa𝑎aPosition of the HIFI vertical polarisation axis relative to north, increasing eastward. | Mode |
|---|---|---|---|---|---|---|
| Number | Day (OD) | ID (ObsID) | Tsys (K) (V/H) | PA (∘) | ||
| 1V/H | 666 | 1342215918-9 | 2011 Mar 3 | 97/98 | 266.2 | OTF Mapping |
| 2V/H | 666 | 1342215920-1 | 2011 Mar 3 | 97/97 | 266.2 | OTF Mapping |
| 3V/H | 681 | 1342216838-9 | 2011 Mar 26 | 97/97 | 273.6 | Pointed |
| 4V/H | 694 | 1342218904-5 | 2011 Apr 8 | 97/98 | 280.0 | Pointed |
| 5V/H | 1017 | 1342239637-8 | 2012 Feb 25 | 68/84 | 258.9 | Pointed |
| 6a-V/H | 1066 | 1342244409-10 | 2012 Apr 14 | 68/84 | 284.1 | Pointed |
| 6b-V/H | 1066 | 1342244411-2 | 2012 Apr 14 | 68/84 | 284.1 | OTF Mapping |
| Observation | Date | System Temperature | Parallactic Angle | Mode |
|---|---|---|---|---|
| Number | Tsys (K) (V/H) | (PA) (∘) | ||
| 1a-V/H | 2011 Mar 21 | 91/81 | 6.1 | Pointing |
| 1b-V/H | 2011 Mar 21 | 115/103 | 28.9 | Pointing |
| 2a-V/H | 2012 Mar 21 | 108/95 | -30.3 | Pointing |
| 2b-V/H | 2012 Mar 21 | 134/117 | 37.0 | Pointing |
| 3a-V/H | 2012 Apr 18 | 94/81 | 19.2 | Pointing |
| 3b-V/H | 2012 Apr 18 | 136/118 | 34.9 | Pointing |
Appendix B Herschel/HIFI Maps of 621 GHz Water Maser
Appendix C Discussion on Pointing Errors
The source for the variability of the broad pedestal component in the 621 GHz spectral line requires explanation. More precisely, we need to determine whether some time-varying physical mechanism and/or pointing errors are responsible for the change that occurs in the pedestal between 2011 to 2012.
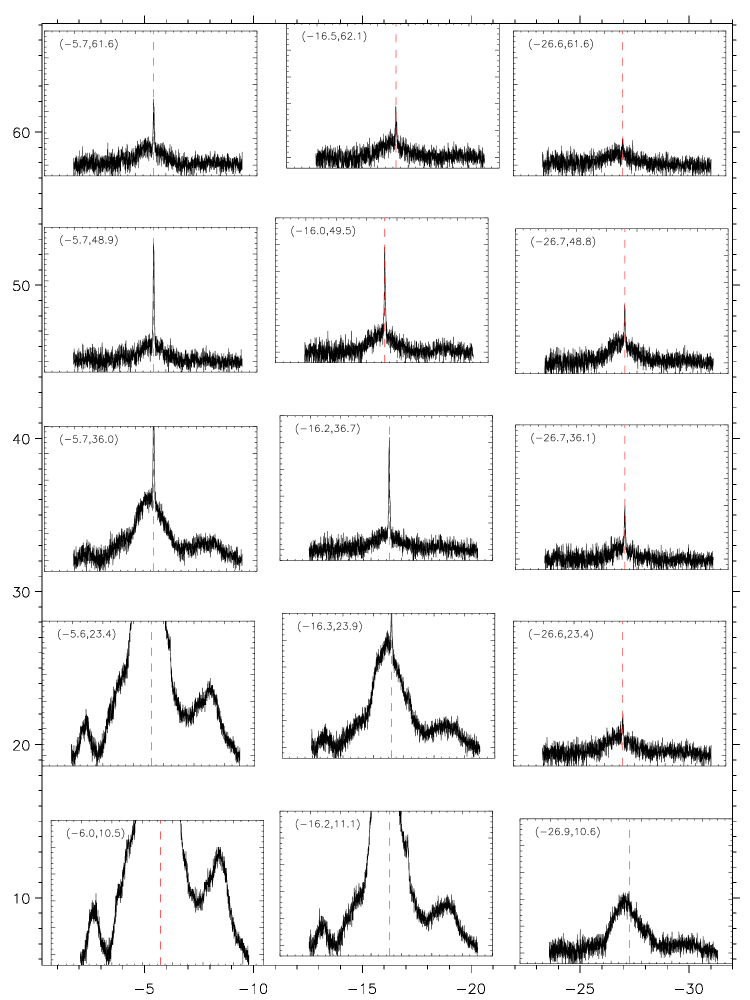
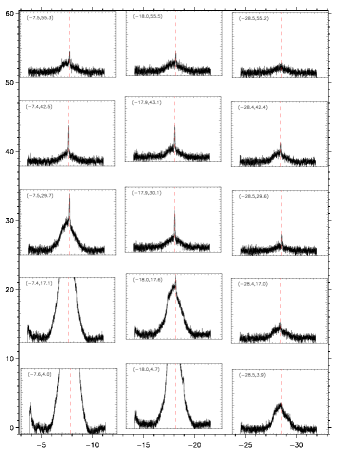
As the first and last set of observations involved a small map, we examined two possibilities. First, whether the increase in emission from the broad component is common to all areas of the map, and second, if not, whether there is a noticeable offset in the spatial positioning. Figures 3 and 4 illustrate the horizontally polarised versions of the two small maps taken during the first and last epochs of our observations. In Table 1, this corresponds to observation numbers 2-H and 6b-H, respectively. From 2011 and 2012, the intensity of the maser line itself seems to systematically decrease between the maps of Figures 3 and 4. At the same time, in many panels toward the map center, the aforementioned broad component appears to get stronger. This trend differs at points farther from the center, where there is more of a decrease, especially in the line wings of the bottom left panels. This latter point seems to indicate systematic changes in the source. However, one possible explanation for the increase in the broad component may be due to the proximity of the Orion “hot core” (HC) whose molecular line emissions were studied extensively by Beuther et al. (2005). The HC is located at (R.A.[J2000], decl.[J2000]) only about 6 arcseconds removed from Orion KL. It is displaced from our pointing direction by only in Right Ascension and in Declination, and thus lies at an offset of only 36 seconds of arc from our prime pointing direction. This small offset, barely exceeding the FWHM of our beam at 621 GHz, implies that even a relatively small error in pointing could effect a large apparent variability, given that the HC would lie on the flank of our beam profile.
In Section 3.2, we stated that the adjustment in the absolute pointing error (APE) improved the pointing accuracy of HIFI but retained some of its uncertainty. This is especially true of the mapped observations, which have additional pointing uncertainties due to relative offsetting and jitter, that may total - for OTF maps. Both mapping and pointed modes can be further misdirected from their intended pointing during telescope switching from OFF to ON source. Indeed the APE was verified during Herschel photometric operation and was never proven to exactly match while in spectroscopic observations. In general, HIFI has shown itself able to resolve source structure to better than at its high-frequency end. Nevertheless pointing errors of order have occasionally been observed on Herschel.
As we are combining data across several Observation Days, it is easy to conceive of pointing errors of this order. Together with the large source gradient shown in Figures 3 and 4 and the presence of the HC in the vicinity of our source, the effect of pointing errors must be considered a likely source of variability in the broad spectral component. Quantitatively, if one is to look more closely at, for example, Figure 4, there is a drastic, K increase in the broad component as one moves from the center position to that directly beneath. Following the discussion from above, a reasonable pointing error of , or 23% of the map step size, would thus correspond to an increase of K in the broad pedestal. An offset of this magnitude from the center position would therefore result in the amplitude of the broad component rising to K, or times the intensity.