The Peculiar Radio Source M17 JVLA 35
Abstract
M17 JVLA 35 is a radio source detected in projection against the M17 HII region. In recent observations, its spectrum between 4.96 and 8.46 GHz was found to be positive and very steep, with (). Here we present Very Large Array observations made in the 18.5 to 36.5 GHz region that indicate a spectral turnover at 13 GHz and a negative spectral index () at higher frequencies. The spectrum is consistent with that of an extragalactic High Frequency Peaker (HFP). However, M17 JVLA 35 has an angular size of at 8.46 GHz, while HFPs have extremely compact, milliarcsecond dimensions. We discuss other possible models for the spectrum of the source and do not find them feasible. Finally, we propose that M17 JVLA35 is indeed an HFP but that its angular size becomes broadened by plasma scattering as its radiation travels across M17. If our interpretation is correct, accurate measurements of the angular size of M17 JVLA35 across the centimeter range should reveal the expected dependence.
1 Introduction
In a study made with the Karl G. Jansky Very Large Array (VLA) at 4.96 and 8.46 GHz toward the classic HII region M17, Rodríguez et al. (2012) detected 38 compact radio sources. Of these sources, 19 were found to have stellar counterparts detected in the infrared, optical, or X-rays. Among the sources without previously known counterparts, these authors noted that M17 JVLA 35 (Fig. 1) was remarkable because of its steep positive spectral index (). Sources with such a spectral index at these frequencies are rare. For example, Dzib et al. (2013) determined the spectral index between 4.5 and 7.5 GHz for 165 sources in the Ophiuchus Complex. Only two of them have spectral indices comparable to that of JVLA 35.
Counterparts to JVLA 35 were searched unsuccessfully in SIMBAD, as well as in the GLIMPSE catalog of candidate young stellar objects with a high probability of association with the M17 complex (Povich et al. 2009). Its unusual radio spectrum deserves further study.
In this paper we report new VLA observations of M17 JVLA 35 that extend its spectrum to the high frequencies: from 18.5 to 36.5 GHz. Our main goal was to obtain a spectrum extending sufficiently in frequency to attempt a better classification of the source.
2 Observations
Observations of M17 were made with the Karl G. Jansky Very Large Array (VLA) of the National Radio Astronomy Observatory (NRAO)111The NRAO is a facility of the National Science Foundation operated under cooperative agreement by Associated Universities, Inc.. We observed the continuum emission in the K and Ka bands in C configuration during June 22nd, 2013 (project code: 13A-125). For each band, we observed a total continuum bandwidth of 8 GHz covering the frequency ranges 18-26 GHz in K band, and 29-37 GHz in Ka band. Each band is divided in 4096 channels of 2 MHz each. Bandpass and complex gain calibration were made by observing J18251718 every 2 minutes. Flux calibration was achieved by observation of the standard flux calibrator 3C48. We centered our observations at the position of M17 JVLA 35 ((J2000)=18h 20m 33.100s, (J2000)=16∘09′41.00′′). The on-source time in each band was 20 minutes. Calibration of the data were performed with the data reduction package CASA (Common Astronomy Software Applications; version 4.1.0)222https://science.nrao.edu/facilities/vla/data-processing following standard VLA procedures for high frequency data.
We divided the calibrated data of each band in 8 parts of 1 GHz each and made cleaned continuum maps of each chunk by using the task clean of CASA. In order to resolve out the extended emission from the M17 HII region, we used only visibilities larger than 50 k in our imaging, thus suppressing structures larger than 4. A similar imaging procedure was used by Rodriguez et al. (2012). The central frequencies, rms noises and synthesized beams for each map are shown in Table 1. Source JVLA 35 is detected in all our 1 GHz wide maps and we obtained its flux density at each frequency by performing a Gaussian fit. Our typical angular resolution is and the source is unresolved in our images.
In Table 1 we show the flux density of JVLA 35 obtained from our data and in Figure 2 we show the spectral energy distribution (SED). In the SED we have included the flux density at 8.46 GHz and the upper limit at 4.96 GHz obtained by Rodríguez et al. (2012). As can be seen, the spectral index of the emission is positive at low frequencies, there is a maximum of emission at intermediate frequencies, and then the emission diminishes with frequency with a negative spectral index at high frequencies.
We fitted the SED by assuming a synchrotron-like spectrum in the form:
| (1) |
where and are the flux density and the optical depth at a reference frequency . This equation assumes that the emission is optically thick at low frequencies with a spectral index , and optically thin at high frequencies with a spectral index . We assumed the theoretically expected value of =2.5 and obtained =2.0 by fitting the data at the highest frequencies. The maximum of the emission takes place at 13.3 GHz. It should be noted that the spectral index al low frequencies is only an estimate since we only have an upper limit and one measured flux density. Additional observations are required.
| Central | rms | Synthesized beam | Flux Density | |
|---|---|---|---|---|
| Frequency | noise | HPBW | P.A. | of JVLA 35 |
| (GHz) | (Jy beam-1) | (arcsec) | (deg) | (Jy) |
| 18.5 | 70 | 1.350.74 | 8.90 | 1003 44 |
| 19.5 | 62 | 1.300.72 | 8.15 | 1018 31 |
| 20.5 | 63 | 1.240.68 | 7.95 | 962 35 |
| 21.5 | 60 | 1.170.68 | 9.40 | 1030 38 |
| 22.5 | 55 | 1.120.65 | 9.90 | 838 64 |
| 23.5 | 55 | 1.090.63 | 10.50 | 812 38 |
| 24.5 | 44 | 1.040.60 | 10.98 | 733 30 |
| 25.5 | 42 | 1.020.58 | 8.36 | 647 33 |
| 29.5 | 68 | 1.140.61 | 20.02 | 529 17 |
| 30.5 | 47 | 1.090.59 | 19.83 | 428 7 |
| 31.5 | 46 | 1.020.61 | 18.63 | 533 30 |
| 32.5 | 49 | 0.980.60 | 18.85 | 409 6 |
| 33.5 | 44 | 0.970.54 | 19.23 | 375 8 |
| 34.5 | 44 | 0.920.58 | 18.25 | 348 14 |
| 35.5 | 42 | 0.890.55 | 19.41 | 328 16 |
| 36.5 | 44 | 0.880.54 | 20.71 | 323 41 |
3 A Search for a Counterpart in the Infrared
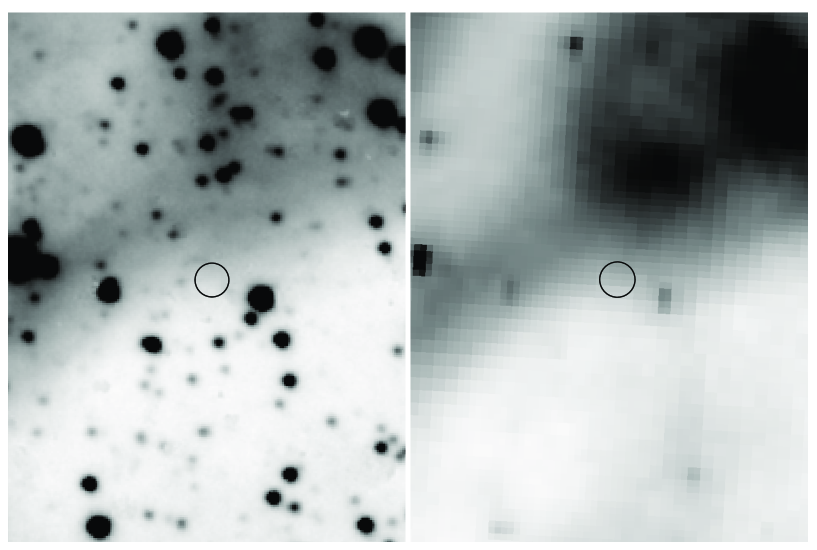
In order to further constrain the observed properties of M17 JVLA35, we extended our search for counterparts to a wider range of frequencies by analyzing several deep survey images of M17. We retrieved these from from the public archives of the United Kingdom Infrared Telescope (UKIRT) Infrared Deep Sky Survey (UKIDSS; Lawrence et al. 2007) in the near-infrared bands, the Spitzer Galactic Legacy Infrared Midplane Survey Extraordinaire (GLIMPSE; Benjamin et al. 2003; Churchwell et al. 2009) taken with the Infrared Array Camera (IRAC) at 3.6, 4.5, 5.8 and 8 m, and the Herschel Infrared Galactic Plane Survey (HI-GAL; Molinari et al. 2010) at 70, 160, 250, 350 and 500 m. No compact infrared counterparts were found in any of these images within of the JVLA position. Using the appropriate survey calibrations, we derived the following upper limits to the flux densities: 16 Jy at 1.2 m, 23 Jy at 1.6 m, 17 Jy at 2.2 m, 40 Jy at 3.6 m, 60 Jy at 4.5 m, 200 Jy at 5.8 m, 1 mJy at 8 m, 1.2 Jy at 70 m and 1.8 Jy at 160 m. At 250, 350 and 500 m, the extended thermal dust emission associated with M17 is too strong to derive any useful limit. As an illustration, Figure 3 shows the -band UKIDDS and the GLIMPSE 5.8 m images of a small field centred on M17 JVLA35. Note also that no Chandra X-ray source was listed at this position by Broos et al. (2007).
4 Discussion
In this section we discuss continuum emission mechanisms that could explain the spectrum observed for M17 JVLA35. In addition to the mechanisms discussed below, we note that an explanation in terms of a galactic background massive star seems unlikely. These stars have ionized winds that at high frequencies show a spectral index on +0.6 (i.e. Abbott et al. 1985), in contrast to the negative spectral index shown by JVLA35.
4.1 Self-absorbed synchrotron source
The observed spectrum is similar to those seen in the High Frequency Peakers (HFPs). These are compact, powerful extragalactic radio sources with well-defined peaks in their radio spectra above 5 GHz, with most of them being high redshift quasars (Dallacasa et al. 2000). A possible explanation for the HFP radio sources is that we are observing self-absorbed synchrotron emission. An estimate for the magnetic field in the region can be obtained from (Kellermann & Pauliny-Toth 1981):
where , , and are the frequency, flux density, and angular size of the source at the turnover. For an HFP radio source, the terms in square brackets on the right hand side of the equation are of order unity and a magnetic field of order 100 mGauss is obtained (e.g. Orienti & Dallacasa 2014). However, M17 JVLA35 is clearly resolved at 8.46 GHz (with deconvolved dimensions of ; Rodríguez et al. 2012). We will adopt as the characteristic angular size the geometric mean of the major and minor axes, . For this angular dimension the resulting magnetic field is unrealistically large for any type of astronomical object. We then consider alternative explanations for the nature of JVLA 35.
4.2 Optically-thin synchrotron with free-free absorption by M17
M17 JVLA35 could be a source with a single power-law spectrum, with the turnover observed at 13 GHz due to free-free absorption in the low frequencies produced by the M17 HII region. To test this hypothesis, we calibrated VLA archive observations made at 1.42 GHz in the DnC configuration. These observations were made on 1991 February 12 under project AM279. We calibrated the data using the usual NRAO procedures and made images from the average of the pure continuum (that is, without detectable HI absorption) channels. The data was self-calibrated in phase and the final image is shown in Figure 4. The total flux density from the HII region in this image is 370 Jy. This result indicates that we are detecting most of the extended emission from the region since the single dish measurement of Altenhoff et al. (1970) at the same frequency gives a total flux density of 50050 Jy. The position of JVLA 35 is indicated with an symbol.
The flux density per beam at the position of JVLA 35 is 2.25 Jy beam-1. In contrast, the flux density per beam at the position of peak emission in the image () is 9.09 Jy beam-1. These flux densities per beam imply brightess temperatures of 1,500 K for the line of sight to JVLA 35 and of 6,200 K for the position of peak emission. Assuming that the emission in the latter position traces optically thick emission, we assume that the electron temperature of the HII region is 6,200 K. Then, using
we derive a free-free optical depth of for the emission in the line of sight to JVLA 35. Since the free-free optical depth goes as , we expect . We then conclude that the turnover at 13 GHz cannot be explained by free-free absorption from M17.
4.3 Optically-thin synchrotron with associated free-free absorption
Another possibility is an optically-thin synchrotron source that is absorbed at the lower frequencies by directly associated ionized gas. The problem in this case is that the optically-thick free-free should produce an emission of about 100 mJy at 8.46 GHz, while the observed value is of order 1 mJy.
4.4 Self-absorbed free-free
The spectral index at low frequencies is marginally consistent with optically-thick free-free emission (). However, the clearly negative spectral index above 13 GHz is inconsistent with optically-thin free-free emission since for this type of emission the spectral index will always be equal or more positive than (Rodríguez et al. 1993).
4.5 Dust emission
From the spectrum that rapidly rises in frequency between 4.96 and 8.46 GHz (Rodríguez et al. 2012), our first assumption was that we were seeing a source of dust emission. However, dust emission keeps rising rapidly with frequency (, e. g. Rodmann et al. 2006) well into the far-infrared and the turnover and change of sign in the spectral index above 13 GHz rules out this explanation.
4.6 Spinning dust emission
Draine & Lazarian (1998b) proposed that rotating small interstellar grains (spinning dust) could produce detectable electric dipole radiation. This emission is believed to account for the ”anomalous” Galactic background component, which correlates with the 100 m thermal emission from dust (Draine & Lazarian 1998a). The spectrum of spinning dust grains is somewhat similar to that of JVLA 35 in that it rises with frequency, reaches a peak at a few tens of GHz and drops in intensity for higher frequencies. However, the negative spectral index of the high frequency end is steeper than the positive spectral index of the low frequency end (e.g. Ali-Haïmoud et al. 2009). This behavior is opposite to that seen in JVLA 35 and we discard this mechanism as a possibility.
4.7 Self-absorbed synchrotron source with line-of-sight plasma scattering
As discussed above, the source M17 JVLA35 should be extremely compact (mas angular size) if it is an HFP. One possibility is that the source is intrinsically compact, but that in traveling across M17 the radio emission suffers plasma scattering (e.g. Moran et al. 1990), a process similar to optical ”seeing” that broadens the radio image. A well studied plasma-scattered object is the extragalactic source J17204-3554, that is intrinsically very compact but measured to have an angular dimension of at 4.9 GHz (Trotter et al. 1998). This scattering is produced as the radio waves pass across the inhomogeneous plasma of the galactic HII region NGC 6334(A).
To first approximation, the plasma-scattered angular size is proportional to the square root of the emission measure along the line of sight to the extragalactic source (Thompson et al. 1986). In the case of the extragalactic source J17204-3554, the emission measure of NGC 6334(A) is cm-6 pc (Moran et al. 1990). For the plasma-scattering explanation to work, we need a larger emission measure in M17 along the line-of-sight to the presumed extragalactic HFP. Since the angular size of the scattered source goes as and M17 JVLA35 at 8.46 GHz is about twice as large as J17204-3554 at 4.9 GHz, we need that the emission measure in the line-of-sight within M17 is about 40 times that of NGC 6334(A).
As noted previously, we derive an optical depth of for the emission in the line of sight to JVLA 35. This optical depth corresponds to an emission measure of cm-6 pc. This emission measure is about 100 times larger than that measured for NGC 6334(A) in the line of sight to J17204-3554. We then conclude that M17 can easily provide the observed plasma scattering. We note that the emission measure toward the region of peak emission of M17 is even larger, cm-6 pc)
A direct way to test this hypothesis is to determine the angular size of M17 JVLA 35 at several frequencies, searching for the expected dependence. At present, we cannot perform this test because the source was detected by Rodríguez et al. (2012) only at one frequency and because the observations reported here lack the angular resolution to achieve this. Additional observations are required to more fully understand the nature of M17 JVLA 35. One expects to detect additional compact extragalactic sources that are plasma-scattered if they are located behind a galactic HII region or planetary nebula.
5 Conclusions
We discussed several possibilities to explain the observed spectrum and angular size of the source M17 JVLA35. We favor that it is an HFP whose angular size is plasma-broadened as the radiation travels across M17. This hypothesis can be tested by searching the expected angular size dependence in the centimeter range.
References
- Abbott et al. (1985) Abbott, D. C., Bieging, J. H., & Churchwell, E. 1985, Radio Stars, 116, 219
- Ali-Haïmoud et al. (2009) Ali-Haïmoud, Y., Hirata, C. M., & Dickinson, C. 2009, MNRAS, 395, 1055
- Altenhoff et al. (1970) Altenhoff, W. J., Downes, D., Goad, L., Maxwell, A., & Rinehart, R. 1970, A&AS, 1, 319
- Benjamin et al. (2003) Benjamin, R. A., Churchwell, E., Babler, B. L., et al. 2003, PASP, 115, 953
- Broos et al. (2007) Broos, P. S., Feigelson, E. D., Townsley, L. K., et al. 2007, ApJS, 169, 353
- Casali et al. (2007) Casali, M., Adamson, A., Alves de Oliveira, C., et al. 2007, A&A, 467, 777
- Churchwell et al. (2009) Churchwell, E., Babler, B. L., Meade, M. R., et al. 2009, PASP, 121, 213
- Dallacasa et al. (2000) Dallacasa, D., Stanghellini, C., Centonza, M., & Fanti, R. 2000, A&A, 363, 887
- Draine & Lazarian (1998) Draine, B. T., & Lazarian, A. 1998a, ApJ, 494, L19
- Draine & Lazarian (1998) Draine, B. T., & Lazarian, A. 1998b, ApJ, 508, 157
- Dzib et al. (2013) Dzib, S. A., Loinard, L., Mioduszewski, A. J., et al. 2013, ApJ, 775, 63
- Hambly et al. (2008) Hambly, N. C., Collins, R. S., Cross, N. J. G., et al. 2008, MNRAS, 384, 637
- Hewett et al. (2006) Hewett, P. C., Warren, S. J., Leggett, S. K., & Hodgkin, S. T. 2006, MNRAS, 367, 454
- Kellermann & Pauliny-Toth (1981) Kellermann, K. I., & Pauliny-Toth, I. I. K. 1981, ARA&A, 19, 373
- Lawrence et al. (2007) Lawrence, A., Warren, S. J., Almaini, O., et al. 2007, MNRAS, 379, 1599
- Molinari et al. (2010) Molinari, S., Swinyard, B., Bally, J., et al. 2010, A&A, 518, L100
- Moran et al. (1990) Moran, J. M., Rodriguez, L. F., Greene, B., & Backer, D. C. 1990, ApJ, 348, 147
- Orienti & Dallacasa (2014) Orienti, M., & Dallacasa, D. 2014, MNRAS, 438, 463
- Povich et al. (2009) Povich, M. S., Churchwell, E., Bieging, J. H., et al. 2009, ApJ, 696, 1278
- Rodmann et al. (2006) Rodmann, J., Henning, T., Chandler, C. J., Mundy, L. G., & Wilner, D. J. 2006, A&A, 446, 211
- Rodriguez et al. (1993) Rodriguez, L. F., Marti, J., Canto, J., Moran, J. M., & Curiel, S. 1993, Rev. Mexicana Astron. Astrofis., 25, 23
- Rodríguez et al. (2012) Rodríguez, L. F., González, R. F., Montes, G., et al. 2012, ApJ, 755, 152
- Thompson et al. (1986) Thompson, A. R., Moran, J. M., & Swenson, G. W. 1986, New York, Wiley-Interscience, 1986, Interferometry and synthesis in radio astronomy
- Trotter et al. (1998) Trotter, A. S., Moran, J. M., & Rodriguez, L. F. 1998, ApJ, 493, 666