Critical Behavior of the SDW Transition in Under-doped
Ba(Fe1-xCox)2As2 ():
75As NMR
Investigation
Abstract
We investigate the nature of the SDW (Spin Density Wave) transition in the underdoped regime of an iron-based high superconductor Ba(Fe1-xCox)2As2 by 75As NMR, with primary focus on a composition with ( K). We demonstrate that critical slowing down toward the three dimensional SDW transition sets in at the tetragonal to orthorhombic structural phase transition, K, suggesting strong interplay between structural distortion and spin correlations. In the critical regime between and , the dynamical structure factor of electron spins measured with the longitudinal NMR relaxation rate exhibits a divergent behavior obeying a power-law, with the critical exponent .
pacs:
74.70-b, 76. 60-kI Introduction
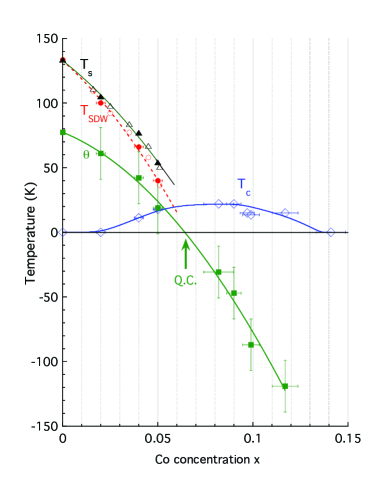
The discovery of superconductivity with as high as 28 55 K in iron-pnictides Kamihara et al. (2008); Ren et al. (2008); Chen et al. (2008); Rotter et al. (2008); Sefat et al. (2008) has regenerated strong interest in the research of high temperature superconductivity. The parent compound of the so-called 122 ferropnictides, BaFe2As2, is a semi-metallic antiferromagnet; upon cooling, BaFe2As2 undergoes a first-order Spin Density Wave (SDW) transition at K, accompanied by a tetragonal to orthorhombic structural phase transition at Rotter et al. (2008); Huang et al. (2008); kigawa et al. (2008); Fukazawa et al. (2008). Doping a few % of Co into the Fe sites of BaFe2As2 quickly suppresses Ning et al. (2009); Ni et al. (2008) as well as Chu et al. (2009), as summarized in Fig. 1. In the lightly Co doped regime, the structural phase transition takes place first upon cooling, followed by the SDW transition in the orthorhombic phaseChu et al. (2009); Nandi et al. (2010). Superconductivity with optimized K appears when and are completely suppressed by 6 8 % Co doping Sefat et al. (2008); Ning et al. (2009); Ni et al. (2008); Chu et al. (2009); Wang et al. (2008); Nandi et al. (2010); Fang et al. (2009). The nature and origin of the SDW ordering, and its potential relation to the superconducting mechanism, are the subject of intense debates Johnston et al. (2010).
In this work, we investigate the critical behavior of the SDW transition and its interplay with the structural transition in lightly Co doped single crystals of Ba(Fe1-xCox)2As2 with , 0.04, and 0.05 based on 75As NMR measurements. We will place our primary focus on a composition with ; thanks to its relatively sharp NMR lines, experimental characterizations of structural and SDW phase transitions are straightforward for this composition. We demonstrate that the structural transition at K triggers the critical slowing down of spin dynamics toward the three dimensional SDW transition at K. We found that the critical exponent for the divergence of the dynamical structure factor of electron spins, , near the SDW transition is different from often attributed to itinerant electron magnetism, such as metallic Cr Kontani et al. (1993). Instead, we found . This value is nearly identical with the case of a Mott insulator CuO with Itoh et al. (1990), and is in reasonable agreement with the theoretically predicted value of for insulating three-dimensional (3D) Heisenberg antiferromagnets Halperin et al. (1967); Kawasaki et al. (1968); Hohenemser et al. (1989); Lovesey et al. (1995). Here is the critical exponent for the spin-spin correlation length , and . We also demonstrate that Co doping enhances the density of states of the reconstructed Fermi surfaces below roughly in proportion to , based on the enhancement of at low temperatures.
The rest of this paper is organized as follows. In section II, we will briefly describe experimental procedures. In section III, we will discuss our results in the paramagnetic state above , followed by brief discussions about the SDW ordered state. We will conclude in section IV.
II EXPERIMENTAL METHODS
We grew single crystals of Ba(Fe1-xCox)2As2 from FeAs flux Sefat et al. (2008); Fang et al. (2009). We carried out NMR measurements using the standard pulsed NMR techniques. For , we cleaved a small piece of shiny crystal from a much larger boule used for our previous report Ning et al. (2009). The total mass of the smaller crystal used for the present work is about mg. It was necessary to use the smaller piece to ensure high homogeneity of the sample. In fact, we found no evidence for a stretched recovery of Dioguardi et al. (2013) in our small homogeneous crystal of , contrary to an earlier report that a crystal Curro et al. (2009) and lightly doped LaFeAsO1-xFx crystals Hammerath et al. (2013) exhibit a large distribution of , which implies a large distribution of . From the sharpness of the divergent behavior of and the NMR linewidth, we estimate the upper bound of the distribution of and as little as K in our small crystal. Moreover, we could resolve the fine structures of the NMR lineshapes in the magnetically ordered state below (see Fig. 2(b) and (c) below), which we were unable to detect in our earlier study using a larger, inhomogeneous crystal Ning et al. (2009). Due to the poor signal to noise ratio arising from the small volume of the crystal and long relaxation time , the NMR data acquisition is extremely time consuming below ; it took up to 10 days of continuous signal averaging to complete one set of NMR lineshape measurements at a given temperature.
Small single crystal samples used for other compositions with and are identical with those used in our previous studies Ning et al. (2009, 2010). We found stretched forms of recovery only for below K, analogous to the earlier report Curro et al. (2009). It is worth recalling that Co substitution is known to suppress spin fluctuations locally at Co sites, as evidenced by temperature independent observed at Co sites at low temperatures Ning et al. (2008). A level of distribution in the electronic properties in the alloyed samples of Ba(Fe1-xCox)2As2 is therefore naturally expected, as we demonstrated earlier from the variation of within a single NMR peak of a given composition Ning et al. (2009). But none of the key findings and conclusions in the present work rely on the sample at low temperatures, and hence the issue of the inhomogeneity induced by Co substitution is beyond the scope of the present work.
III Results and Discussions
III.1 75As NMR lineshape, width and Knight shift
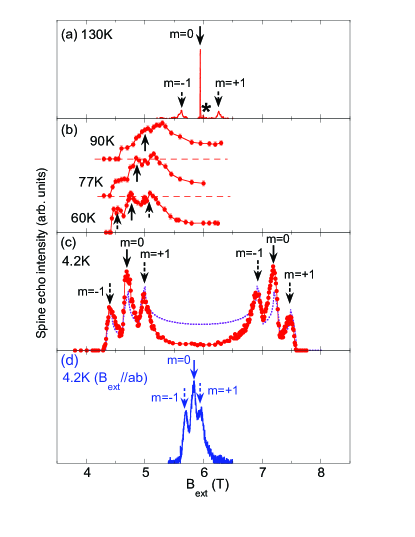
In Fig. 2(a), we present a representative field-swept 75As NMR lineshape of Ba(Fe0.98Co0.02)2As2 observed at a fixed NMR frequency of MHz in the paramagnetic state above . In general, the nuclear spin Hamiltonian can be expressed as a summation of the Zeeman and nuclear quadrupole interaction terms,
| (1) |
where the 75As nuclear gyromagnetic ratio is MHz/T, h is Planck’s constant, and represents the nuclear spin. Since 75As has nuclear spin , we observe three transitions from to (with , 0, and ) in the NMR lineshape: the sharp central peak arises from the to +1/2 transition (); additional two broad satellite peaks arise from to transitions (), separated by . The nuclear quadrupole interaction frequency along the -axis is proportional to the Electric Field Gradient (EFG) at the observed 75As site, and is the asymmetry parameter of the EFG, = . Due to the tetragonal symmetry at the 75As sites, above . Co doping induces substantial disorder in the lattice, reflected on the distribution of .
is the summation of the external field and the time averaged hyperfine fields from nearby electron spins, , i.e. . In the paramagnetic state, the central peak frequency is slightly shifted (i.e. “Knight shift”) due to small hyperfine fields induced by polarized electron spins nearby. Since the spin polarization induced by is proportional to spin susceptibility , we can measure the latter by accurately determining the central peak position Jaccarino et al. (1967). In the SDW ordered state, static induced by ordered magnetic moments in the vicinity of the observed 75As nuclear spins dramatically affect the NMR lineshapes, as shown in Fig.2 (b) and (c). We will come back to this point below in section C.
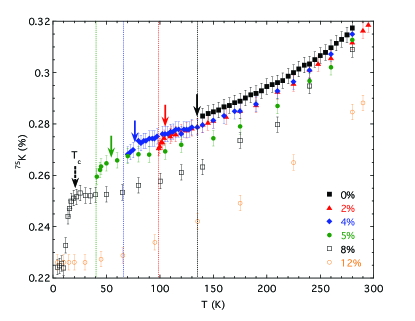
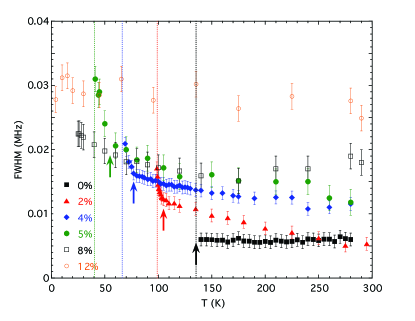
We summarize the temperature dependence of the paramagnetic NMR Knight shift and the FWHM (Full Width at Half Maximum) of the central peak frequency in Fig. 3 and 4, respectively. To ensure high accuracy, we conducted these measurements by taking the FFT of the spin echo envelope in a fixed magnetic field. The NMR Knight shift, , probes the local spin susceptibility via hyperfine coupling ; ( % or less for ) is a temperature independent chemical shift Ning et al. (2008). Our new results of in Ba(Fe0.98Co0.02)2As2 are analogous to those observed for other compositions Ning et al. (2008, 2009, 2010): decreases with temperature, and tends to level off near K Oh et al. (2011). See Ning et al. (2010) for detailed analysis of based on fitting the data with a pseudo gap K.
One interesting aspect of Fig. 3 is that exhibits a noticeable drop below K for Ba(Fe0.98Co0.02)2As2. This anomaly is accompanied by a sudden onset of the divergent behavior of FWHM, as shown in Fig. 3. We note that FWHM indeed diverges below K, where the emergence of static hyperfine magnetic field splits the NMR line in the SDW ordered state, as shown in Fig. 2(b) and (c). We found analogous anomalies of and FWHM for Co 4% and 5% doped samples at K and K, respectively, as shown in Figs. 3 and 4. We summarize the concentration dependence of these anomalies in Fig. 1. Clearly, these anomalies are related to the structural phase transition at Chu et al. (2009); Nandi et al. (2010).
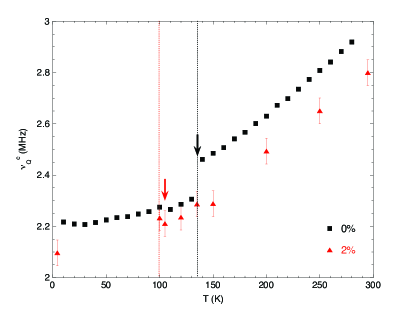
Having identified the signature of the structural phase transition at in our NMR data for the central transition, we also searched for an anomaly in the nuclear quadrupole frequency by measuring the splitting between the central and satellite peaks. We recall that, in typical second order structural phase transitions such as the high temperature tetragonal to low temperature orthorhombic phase transition in the undoped and Sr-doped La2CuO4 high cuprates, one could even observe a -like kink in the temperature dependence of Imai et al. (1993). We summarize our results for Ba(Fe0.98Co0.02)2As2 in Fig. 5. (High precision determination of is rather difficult for higher Co concentrations, because the satellite peaks become very broad due to disorder Ning et al. (2008).) In the case of undoped BaFe2As2, exhibits a step at the first order structural transition K kigawa et al. (2008), but we find practically no anomaly at K for the Co 2% sample. In general, when the lattice contracts with decreasing temperature, the lattice contribution to the electric field gradient (EFG), and hence to , increases. Our finding that smoothly decreases with temperature might be an indication that there is a sizable on-site ionic contribution with an opposite sign.
It is not clear why does not exhibit a clear anomaly at for the Co 2% doped sample. One possible scenario is that the influence of structural distortion on 75As sites becomes so subtle under the presence of Co dopants that the change of also becomes extremely small. We also recall that softening of the lattice stiffness begins at unusually high temperatures in Ba(Fe1-xCox)2As2, and has been speculated to be the consequence of antiferromagnetic correlations Fernandes et al. (2010); Yoshizawa et al. ; Fernandes et al. (2013). Perhaps the effects of orthorhombic distortion on appear progressively from much higher temperature than . In any event, the absence of a strong signature of structural anomaly in the temperature dependence of at excludes the possibility that anomalies observed below in Figs. 3 and 4 are a consequence of the subtle changes in the second order quadrupole effects. In fact, we confirmed that the FWHM is approximately proportional to the magnitude of the applied magnetic field, hence the divergent behavior of FWHM below is the consequence of magnetic effects. We recall that the NMR line broadened by the second order quadrupole effects would be inversely proportional to the magnetic field instead.
Quite generally, divergence of the NMR linewidth precedes a magnetic phase transition through the divergence of dynamical spin susceptibility in the critical regime Jaccarino et al. (1967). We also recall that the NMR Knight shift reflects local paramagnetic spin susceptibility , hence the downturn in the temperature dependence of below is also consistent with suppression of due to strong antiferromagnetic short-range order. Thus our findings in both Fig. 3 and 4 suggest that the structural phase transition at drives the onset of strong 3D antiferromagnetic short range order. This point is more vividly demonstrated through the divergent behavior of in the next section.
III.2 Critical spin dynamics near
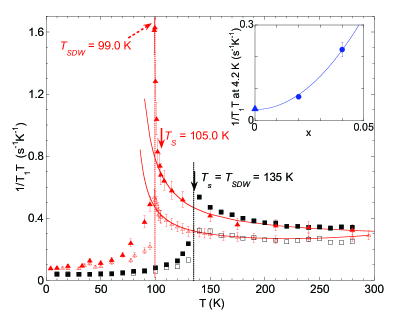
In Fig. 6, we present 75As nuclear spin-lattice relaxation rate divided by temperature , i.e. , observed for Ba(Fe0.98Co0.02)2As2. measures wave-vector q integral of the imaginary part of the dynamical electron spin susceptibility weighted by the hyperfine form factor Smerald et al. (2011). In the case of undoped BaFe2As2, does not show divergent behavior at expected for second order magnetic phase transitions; instead, shows a step at 135 K because the SDW transition is first order kigawa et al. (2008). In contrast, observed for Co 2% doped sample exhibits strongly divergent behavior near in the geometry of . In this configuration, probes fluctuations of hyperfine fields both along the c-axis and ab-plane. The divergent signature is less prominent for , because probes fluctuating hyperfine fields only within the ab-plane, and the transferred hyperfine field becomes vanishingly small for staggered wave vectors in this configuration kigawa et al. (2008); Johnston et al. (2010); Smerald et al. (2011). In other words, it is advantageous to use the geometry to probe the critical behavior of the SDW transition.
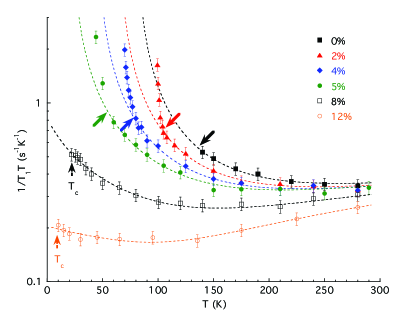
Accordingly, in what follows, we focus our attention on measured in . In Fig. 7, we show in a semi-log scale for various Co concentrations. To avoid confusion, we show only the results above (for %) or (for % and 12%). Also presented is a phenomenological Curie-Weiss fit to an empirical equation, Ning et al. (2010). and are fitting parameters, and is the Weiss temperature of the staggered spin susceptibility near the ordering vector. The concentration dependence of thus obtained is summarized in Fig. 1. Note that we have reversed the sign convention for in the present work (i.e. in Fig. 1 corresponds to in Ning et al. (2010)). The second, activation term in the fit represents the background contributions which decrease with temperature, reflecting the pseudo-gap like signature commonly observed for iron-pnictide and iron-selenide superconductors Ahilan et al. (2008); Nakai et al. (2008); Ning et al. (2010); Imai et al. (2009); Torchetti et al. (2011); Zhou et al. (2013). As already discussed in detail in Ning et al. (2010), the phenomenological Curie-Weiss fit captures the temperature and concentration dependence of remarkably well, including the new results for the Co 2% doped sample. The Curie-Weiss behavior of reflects the fact that, upon cooling, short-range antiferromagnetic correlations slowly grow toward . reverses its sign above the quantum critical point , which implies that Fe spins are not destined to order above . Remarkably, the optimally superconducting composition with the maximum K is located in the vicinity of , hinting at the link between the superconducting mechanism and spin fluctuations Ning et al. (2010).
Another important feature of Figs. 6 and 7 which we did not discuss explicitly in Ning et al. (2010) is that the phenomenological Curie-Weiss fit breaks down below . Extrapolation of the fit to below underestimates the data points near the SDW phase transition for Co 2%, 4%, and 5%, and strong divergent behavior sets in at . In other words, the three dimensional short range order sets in at the tetragonal to orthorhombic structural phase transition, which is prerequisite to the critical slowing down of spin fluctuations toward the eventual three dimensional SDW order. Analogous interplay between the spin and lattice degrees of freedom was also observed for LaFeAsO Fu et al. (2012).
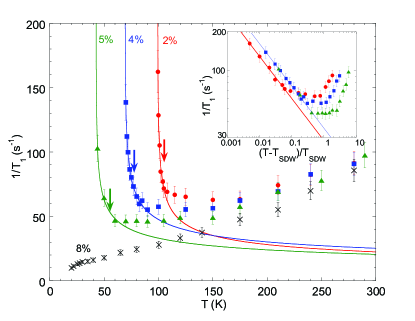
In Fig. 8, we plot of three underdoped compositions on a linear scale. We note that , where is the dynamical structure factor. is a very convenient probe to study the critical dynamics of in the immediate vicinity of magnetic phase transitions, because (i) one can probe the dynamics at extremely low energy (), and (ii) the wave-vector integral is automatically done. Below , we can fit the critical dynamics with a power-law, . We determined and the critical exponent based on the best fit. The resultant values of K (Co 2 %), 68.9 K (Co 4 %), and 42.3 K (Co 5%) are summarized in Fig. 1. The best fit also resulted in the critical exponent for Co 2 %, and 0.317 for Co 4%. The aforementioned distribution of below K for Co 5% makes it difficult to estimate with high accuracy, but the observed temperature dependence is consistent with . The inset of Fig. 8 shows a log-log plot of as a function of the reduced temperature . The common slope in the vicinity of the SDW transition indicates that the SDW transition of all three compositions belong to the same universality class, and the critical exponent is given by . This value is close to observed for a Mott-insulator CuO Itoh et al. (1990) in the vicinity of the Néel transition at K, and consistent with the prediction for insulating three dimensional Heisenberg antiferromagnets, Halperin et al. (1967); Hohenemser et al. (1989); Kawasaki et al. (1968); Lovesey et al. (1995).
III.3 Ordered moments
In Fig. 2(b) and (c), we show the effects of SDW ordering on the field swept NMR lineshapes of Ba(Fe0.98Co0.02)2As2 with . We confirmed the symmetrical nature of the lineshape at 4.2 K, as expected, hence only the lower field half of the lineshapes was measured in the intermediate temperature range between 4.2 K and . Below , the entire 75As NMR lineshape begins to split. As noted first by Kitagawa et al. in the case of undoped BaFe2As2kigawa et al. (2008), this is because the static hyperfine magnetic field at 75As sites arising from the ordered Fe moments within the Fe layers point toward the +c or -c axis. For this reason, the overall NMR lineshape shifts only slightly without exhibiting a splitting under the configuration of , as shown in Fig. 2(d).
While the observed NMR lineshapes below bear similarities with the case of undoped BaFe2As2, there is one major difference Ning et al. (2009): our NMR lineshapes in Fig. 2(b) and (c) exhibit a continuum in the middle. The integrated intensity between = 5.474 to 6.475 T accounts for 8.5 % of the overall intensity. This implies that 8.5 % of 75As nuclear spins experience T, while the maximum value of the hyperfine field reaches T at 4.2 K. Our attempt to fit the observed lineshape with one dimensional incommensurate modulation , where represents the incommensurate SDW ordering vector, is unsatisfactory, as shown in Fig. 2(c). Notice that the calculated results grossly overestimate the spectral weight in the middle part of the lineshape. In view of the fact that the integrated intensity of the 75As(1) sites with a Co atom in one of their four nearest neighbor Fe sites also accounts for approximately 7.5 % of the intensity (see in Fig. 2(a)) Ning et al. (2010), the continuum in the middle part of the NMR lineshape may arise primarily from 75As(1) sites. That is, Co dopants may be suppressing the Fe magnetic moments locally. It has been shown by neutron scattering that the SDW is commensurate with the lattice up to x = 0.056 Pratt et al. (2009, 2011). Base on our NMR data, we can not prove or disprove the incommensurability at x = 0.02. We note that similar 75As lineshapes have been observed in the lightly doped regime of Ba(Fe1-xNix)2As2 ( = 0.0072 and 0.016) Curro et al. (2009).
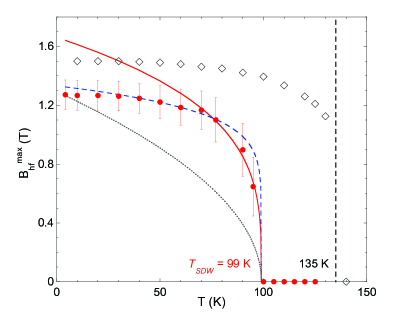
We summarize the temperature dependence of in Fig. 9. remains approximately constant up to K, then decreases continuously toward K. This behavior is markedly different from the first order commensurate SDW transition in BaFe2As2 kigawa et al. (2008); decreases discontinuously at = 135 K in the latter. By fitting the temperature dependence of between 70 K () and K to a power law, with a fixed = 99.0 K, we obtain the critical exponent . Very broad lineshapes make accurate determination of difficult near , hence we were unable to eliminate the large uncertainties of . Nonetheless, it is worth pointing out that is consistent with the expectation from the Heisenberg model, , but different from the mean-field value, .
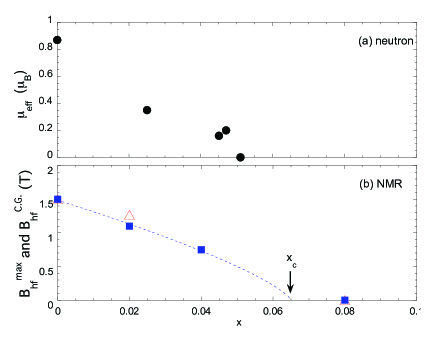
Turning our attention to the magnitude of the ordered moment at 4.2 K as a function of , we compare NMR results with those obtained from neutron scattering in Fig. 10. Since has a distribution under the presence of Co dopants, we plot both the maximum value and the center of gravity of the hyperfine field, and , respectively, in Fig. 10(b). We recall that at 4.2 K for the parent compound BaFe2As2 Huang et al. (2008), and Co doping suppresses Pratt et al. (2009); Lester et al. (2009), as summarized in Fig. 10(a). On the other hand, T observed earlier for BaFe2As2 kigawa et al. (2008) is gradually suppressed by Co doping. Our results of smoothly extrapolate to the critical concentration as determined from the analysis of in Fig. 1, %.
III.4 Low energy spin excitations below
In Fig. 6, we show the temperature dependence of below . Our results show a typical -like temperature dependence in the vicinity of the SDW transition. In insulating antiferromagnets, the low temperature behavior of is usually dominated by multi magnon Raman processes, and decreases very quickly Jaccarino et al. (1967). In the present case, however, as we approach the base temperature of 4.2 K, levels off to a constant value of (s). Analogous behavior was previously reported also for the undoped parent phase BaFe2As2, and was attributed to the Korringa process arising from low energy electron-hole pair excitations at the reconstructed Fermi surface kigawa et al. (2008). We summarize the values of observed at 4.2 K as a function of the doping content in the inset of Fig. 6, including our preliminary results for Ning et al. (2009). Interestingly, three data points fit nicely with a parabolic function of . If the sizable magnitude of at 4.2 K indeed arises from the Korringa process, we expect , where is the density of states. That is, the observed parabolic increase of implies that increases roughly linearly with . We note that if we apply a simple rigid band picture to the reconstructed Fermi surfaces, simple dimensional analysis of and in three dimensions would lead to instead, where is the number of conduction electrons.
IV SUMMARY AND CONCLUSIONS
We have presented an in-depth 75As NMR study of the critical behavior of the SDW transition in the lightly Co doped regime of Ba(Fe1-xCox)2As2, with the primary focus on . We identified the NMR signatures of the tetragonal to orthorhombic structural phase transition preceding the SDW transition. Our Knight shift, NMR line width, and data suggest that the strong short range SDW order with three dimensional nature sets in once the FeAs planes lower the symmetry from tetragonal to orthorhombic. In the orthorhombic phase below , simplistic fits of the antiferromagnetic contribution to based on a Curie-Weiss law using two free parameters (Fig. 7) or 2D SCR theory with four free parameters Nakai et al. (2013) fail to capture the critical behavior. Precisely at , critical slowing down of spin fluctuations sets in, and the critical exponent for the divergence of the dynamical structure factor is , as generally expected for insulating 3D Heisenberg antiferromagnets. Our fitting range is rather limited and it is difficult to draw a definitive conclusion, but this value is inconsistent with expected for the 3D SCR theory for itinerant antiferromagnets Moriya et al. (1967).
V ACKNOWLEDGEMENT
The work at Zhejiang was supported by National Basic Research Program of China (No.2014CB921203,2011CBA00103), NSF of China (No. 11274268). The work at McMaster was supported by NSERC and CIFAR. The work at Oak Ridge National Laboratory was supported by the Department of Energy, Basic Energy Sciences, Materials Sciences and Engineering Division. The work at Beijing and Nanjing was supported by NSFC, the Ministry of Science and Technology of China, and the Chinese Academy of Sciences.
References
- Chen et al. (2008) X.H. Chen, T. Wu, G. Wu, R.H. Liu, H. Chen,and D.F. Fang, Nature 453, 761 (2008).
- Kamihara et al. (2008) Y. Kamihara, T. Watanabe, M. Hirano,and H. Hosono, J. Amer. Chem. Soc. 130, 3296 (2008).
- Ren et al. (2008) Z.A. Ren, W. Lu, J. yang, W. Yi, X.L. Shen, Z.C. Li, G.C. Che, X.L. Dong, L.L. Sun, F. Zhou,and Z.X. Zhao, Chin. Phys. Lett. 25, 2215 (2008).
- Rotter et al. (2008) M. Rotter, M. Tegel,and D. Johrendt, Phys. Rev. Lett. 101, 107006 (2008).
- Sefat et al. (2008) A.S. Sefat, R. Jin, M.A. McGuire, B.C. Sales, D.J. Singh,and D. Mandrus, Phys. Rev. Lett. 101, 117004 (2008).
- Huang et al. (2008) Q. Huang, Y. Qiu, W. Bao, M.A. Green, J.W. Lynn, Y.C. Gasparovic, T. Wu, G. Wu,and X.H. Chen, Phys. Rev. Lett. 101, 257003 (2008).
- Fukazawa et al. (2008) H. Fukazawa, K. Hirayama, K. Kondo, T. Yamazaki, Y. Kohori, N. Takeshita, K. Miyazawa, H. Kito, H. Eisaki,and A. Iyo, J. Phys. Soc. Jpn. 77, 093706 (2008).
- kigawa et al. (2008) K. Kitagawa, N. Katayama, K. Ohgushi, M. Yoshida,and M. Takigawa, J. Phys. Soc. Jpn. 77, 114709 (2008).
- Ni et al. (2008) N. Ni, M.E. Tillman, J.Q. Yan, A. Kracher, S.T. Hannahs, S.L. Bud’ko,and P.C. Canfield, Phys. Rev. B. 78, 214515 (2008).
- Ning et al. (2009) F.L. Ning, K. Ahilan, T. Imai, A.S. Sefat, R. Jin, M.A. McGuire, B.C. Sales,and D. Mandrus, J. Phys. Soc. Jpn. 78, 013711 (2009).
- Chu et al. (2009) J.H. Chu, J.G. Analytis, C. Kucharczyk,and I. R. Fisher, Phys. Rev. B. 79, 014506 (2009).
- Nandi et al. (2010) S. Nandi, M.G. Kim, A. Kreyssig, R.M. Fernandes, D.K. Pratt, A. Thaler, N. Ni, S.L. Bud’ko, P.C. Canfield, J. Schmalian, R.J. McQueeney,and A.I. Goldman, Phys. Rev. Lett. 104, 057006 (2010).
- Wang et al. (2008) X.F. Wang, T. Wu, J. Wu, R.H. Liu, X.H. Chen,and Y.L. Xie, New J. Phys. 11, 045003 (2008).
- Fang et al. (2009) L. Fang, H. Luo, P. Cheng, Z. Wang, Y. jia, G. Mu, B. Shen, I.I. Mazin, L. Shan, C. Ren,and H.H. Wen, Phys. Rev. B 80, 140508(R) (2009).
- Johnston et al. (2010) D.C. Johnston, Advances in Physics 59, 803 (2010).
- Kontani et al. (1993) K. Kontani,and Y. Masuda, J. Magn. Magn. Mater. 31-34, 287 (1993).
- Itoh et al. (1990) Y. Itoh, T. Imai, T. Shimizu, T. Tsuda, H. Yasuoka,and Y. Ueda, J. Phys. Soc. Jpn. 59, 1143 (1990).
- Halperin et al. (1967) B.I. Halperin,and P.C. Hohenberg, Phys. Rev. Lett. 19, 700 (1967).
- Hohenemser et al. (1989) C. Hohenemser, N. Rosov, and A. Kleinhammes, Hyperfine Interactions 49, 267 (1989).
- Kawasaki et al. (1968) K. Kawasaki, Prog. Theor. Phys. 39, 285 (1968).
- Lovesey et al. (1995) S. W. Lovesey, E. Balcar,and A. Cuccoli, J. Phys. Cond. Matt. 7, 2615 (1995).
- Ning et al. (2009) F.L. Ning, K. Ahilan, T. Imai, A.S. Sefat, R. Jin, M.A. McGuire, B.C. Sales,and D. Mandrus, Phys. Rev. B. 79, 140506(R) (2009).
- Dioguardi et al. (2013) A.P. Dioguardi, J. Crocker, A.C. Shockley, C.H. Lin, K.R. Shirer, D.M. Nisson, M.M. Lawson, N. apRoberts-Warren, P.C. Canfield, S.L. Budko, S. Ran, and N.J. Curro, Phys. Rev. Lett. 111, 207201 (2013).
- Curro et al. (2009) A.P. Dioguardi, N. apRoberts-Warren, A.C. Shockley, S. L. Budko, N. Ni, P.C. Canfield, and N.J. Curro, Phys. Rev. B 82, 140411(R) (2010).
- Hammerath et al. (2013) F. Hammerath, U. Gräfe, T. Kühne, H. Kühne, P.L. Kuhns, A.P. Reye, G. Lang, S. Wurmehl, B. Büchner, P. Carretta,and H.J. Grafe, Phys. Rev. B. 88, 104503 (2013).
- Ning et al. (2010) F.L. Ning, K. Ahilan, T. Imai, A.S. Sefat, M.A. McGuire, B.C. Sales, D. Mandrus, P. Cheng, B. Shen, and H.H. Wen, Phys. Rev. Lett. 104, 037001 (2010).
- Ning et al. (2008) F.L. Ning, K. Ahilan, T. Imai, A.S. Sefat, R. Jin, M.A. McGuire, B.C. Sales, and D. Mandrus, J. Phys. Soc. Jpn. 77, 103705 (2008).
- Jaccarino et al. (1967) V. Jaccarino, Proc. of Int. School of Physics, Enrico Fermi XXXVII (Academic Press, NY, 1967) .
- Oh et al. (2011) S. Oh, A.M. Mounce, S. Mukhopadhyay, W.P. Halperin, A.B. Vorontsov, S.L. Bud ko, P.C. Canfield, Y. Furukawa, A.P. Reyes,and P.L. Kuhns, Phys. Rev. B. 83, 214501 (2011).
- Imai et al. (1993) T. Imai, C.P. Slichter, K. Yoshimura, and K. Kosuge, Phys. Rev. Lett. 70, 1002 (1993).
- Fernandes et al. (2013) R.M. Fernandes, A.F. Boehmer, C. Meingast,and Joerg Schmalian, Phys. Rev. Lett. 111, 137001 (2013).
- Fernandes et al. (2010) R.M. Fernandes, L.H. VanBebber, S. Bhattacharya, P. Chandra, V. Keppens, D. Mandrus, M.A. McGuire, B.C. Sales, A.S. Sefat,and J. Schmalian, Phys. Rev. Lett. 105, 157003 (2010).
- (33) M. Yoshizawa, D. Kimura, T. Chiba, A. Ismayil, Y. Nakanishi, K. Kihou, C.H. Lee, A. Iyo, H. Eisaki, M. Nakajima,and S. Uchida, J. Phys. Soc. Jpn. 81, 024604 (2012).
- Smerald et al. (2011) A. Smerald and N. Shannon, Phys. Rev. B 84, 184437 (2011).
- Ahilan et al. (2008) K. Ahilan, F.L. Ning, T. Imai, A.S. Sefat, R. Jin, M.A. McGuire, B.C. Sales,and D. Mandrus, Phys. Rev. B 78, 100501(R) (2008).
- Imai et al. (2009) T. Imai, K. Ahilan, F.L. Ning, T.M. McQueen, and R.J. Cava, Phys. Rev. Lett. 102, 177005 (2009).
- Torchetti et al. (2011) D.A. Torchetti, M. Fu, D.C. Christensen, K.J. Nelson, T. Imai, H.C. Lei,and C.P. Petrovic, Phys. Rev. B. 83, 104508 (2011).
- Nakai et al. (2008) Y. Nakai, K. Ishida, Y. Kamihara, M. Hirano,and H. Hosono, J. Phys. Soc. Jpn. 77, 073701 (2008).
- Zhou et al. (2013) R. Zhou, Z. Li, J. Yang, C.T. Lin,and G.Q. Zheng, Nature Comm. 4, 2265 (2013).
- Fu et al. (2012) M. Fu, D.A. Torchetti, T. Imai, F.L Ning, J.Q. Yan,and A. Sefat, Phys. Rev. Lett. 109, 247001 (2012).
- Lester et al. (2009) C. Lester, Jiun-Haw Chu, J. G. Analytis, S. C. Capelli, A. S. Erickson, C. L. Condron, M. F. Toney, I. R. Fisher,and S. M. Hayden, Phys. Rev. B. 79, 144523 (2009).
- Pratt et al. (2009) D.K. Pratt, W. Tian, A. Kreyssig, J. L. Zarestky, S. Nandi, N. Ni, R. Bud ko, S.L. Sales, P.C. Canfield, A.I. Goldman,and R.J. McQueeney, Phys. Rev. Lett. 103, 087001 (2009).
- Pratt et al. (2011) D.K. Pratt, M.G. Kim, A. Kreyssig, Y.B. Lee, G.S. Tucker, A. Thaler, W. Tian, J.L. Zarestky, S.L. Bud ko, P.C. Canfield, B.N. Harmon, A.I. Goldman,and R.J. McQueeney, Phys. Rev. Lett. 106, 257001 (2011).
- Nakai et al. (2013) Y. Nakai, T. Iye, S. Kitagawa, K. Ishida, S. Kasahara, T. Shibauchi, Y. Matsuda, H. Ikeda,and T. Terashima, Phys. Rev. B. 87, 174507 (2013).
- Moriya et al. (1967) T. Moriya, Spin Fluctuations in Itinerant Electron Magnetism (Springer, New York, 1985).