- DASH
- dynamic adaptive streaming over HTTP
- CDN
- content delivery network
- CDF
- cumulative density function
- probability density function
- RTP
- real-time protocol
- QoE
- Quality of Experience
- VQM
- Video Quality Metric
- MILP
- mixed integer linear program
- ILP
- integer linear program
- HDTV
- high definition television
- UGC
- User-Generated Content
- MPD
- Media Presentation Description
Optimized Adaptive Streaming Representations based on System Dynamics
Abstract
Adaptive streaming addresses the increasing and heterogeneous demand of multimedia content over the Internet by offering several encoded versions for each video sequence. Each version (or representation) is characterized by a resolution and a bit rate, and it is aimed at a specific set of users, like TV or mobile phone clients. While most existing works on adaptive streaming deal with effective playout-buffer control strategies on the client side, in this paper we take a providers’ perspective and propose solutions to improve user satisfaction by optimizing the set of available representations. We formulate an integer linear program that maximizes users’ average satisfaction, taking into account network dynamics, type of video content, and user population characteristics. The solution of the optimization is a set of encoding parameters corresponding to the representations set that maximizes user satisfaction. We evaluate this solution by simulating multiple adaptive streaming sessions characterized by realistic network statistics, showing that the proposed solution outperforms commonly used vendor recommendations, in terms of user satisfaction but also in terms of fairness and outage probability. The simulation results show that video content information as well as network constraints and users’ statistics play a crucial role in selecting proper encoding parameters to provide fairness among users and to reduce network resource usage. We finally propose a few theoretical guidelines that can be used, in realistic settings, to choose the encoding parameters based on the user characteristics, the network capacity and the type of video content.
Index Terms:
Dynamic adaptive streaming over HTTP, content distribution, video streaming, integer linear program.I Introduction
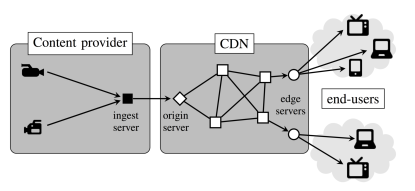
Due to the ever increasing popularity of modern mobile devices, users can request and play multimedia content anywhere and at any time. This results in an increase of the variety of each of the following: requested contents, devices used to display them and access network capacity [1]. Adaptive streaming solutions aim at addressing this growing heterogeneity by offering several versions of the video sequences. Each version is encoded at a different bitrate and resolution so that each user can select the most suitable version depending on the video client capabilities and network bandwidth. Fig. 1 illustrates an instance of an adaptive streaming system. The ingest server receives video data from cameras and prepares several different video representations, each one characterized by a different resolution and bitrate. The ingest server sends the streams corresponding to each representation to the origin server of a content delivery network (CDN), which delivers the video representations to the edge-servers, which, in turn, directly serve the requests of the clients.
Several models have been recently proposed to standardize the adaptive streaming communication framework, like dynamic adaptive streaming over HTTP (DASH) [2, 3, 4] and WebRTC [5]. The multiple implementations of such systems differ in two ways: the client adaptation strategy, and the selection of the different video representations. So far, the first problem has been at the center of the attention of the research community, while the second one has rarely been considered. The only existing guidelines for selecting the parameters of the video representations are recommendations from system manufacturers, including Apple [6] and Microsoft [7]. Some content providers have also defined their own representations sets, for example Netflix [8]. However, to the best of our knowledge, neither the recommendations from system manufacturers nor the choices made by content providers have been supported by any scientific study.
This paper is a first step towards filling this gap. We focus on optimizing the set of representations that should be generated by the ingest server and show that the existing recommended sets have critical weaknesses. Optimizing the encoding parameters for representations sets is an open problem, dealing with multiple constraints, including the cost of delivering video streams using a CDN, the characteristics of end-users, and the type of video to be delivered. For example, smaller sets (i.e., with few representations for each video) might satisfy only a fraction of the users, while larger ones could satisfy more users, but at a larger cost in terms of increased storage costs for on-demand video, or larger encoding delays in the case of live streaming. It is therefore important to study how the representations set should be designed, in order to strike the appropriate balance between user satisfaction and the cost of the system. This is the goal of our work.
In particular, we consider a scenario in which video channels (e.g., sports, documentary, cartoon) are encoded at different encoding rates and various spatial resolutions, leading to several representations available at the server. Representations are then delivered to clients through a CDN characterized by an overall capacity constraint. Clients requests (video content and display resolution) are supposed to be known. Depending on the bandwidth available to each user, specific representations will be provided to fulfill clients’ video requests. The quality experienced by users, modeled in our problem as a satisfaction level function, depends on both the compression artifacts (driven by the video source rate) and spatial scaling artifacts (depending on the potential adaptation of the video resolution to the display resolution).
We formulate an optimization problem to select the best encoding parameters of the representations set and study the resulting performance in different adaptive streaming scenarios. We further show the need of making the selection of the representations set based on the video content, network, and clients’ characteristics. The proposed optimization is not necessarily meant to be used to make real-time adjustments in DASH systems. It is rather a theoretical framework to derive benchmarks or optimal encoding solutions for non-live systems, along with guidelines for practical design of representations sets in video streaming applications. The provided optimization highlights the sub-optimality of the current recommendation sets and provide theoretical guidelines that can help a system designer to understand which are the crucial system parameters that should be taken into account when optimizing the representations set. Our main contributions are as follows:
- i.
-
We formulate a novel integer linear program (ILP) to find the best representations set, defined as the one that maximizes the expected user satisfaction under network and system constraints. The satisfaction of each client is a function of the encoding rate, the resolution, the characteristics of the requested video, and of the bandwidth that can be used to deliver the video. By using a generic solver, it is possible to solve the ILP on representative cases, gaining insights about the optimal representations sets.
- ii.
-
We use the ILP to study the recommendations from system manufacturers and content providers. We compute the solution of the ILP for different user populations and study how it performs in realistic streaming applications w.r.t. the existing recommendations. Simulation results show that recommended sets lead to good performance in terms of quality experienced by those users that can be served by the system, but they also lead to a large probability for users not to be properly served. Overall, recommended sets require too many representations, do not easily adapt to system dynamics, and lead to unfair sharing of the network among users.
- iii.
-
In order to provide insights on how a system provider should select the encoding rates sets, we study the optimal representations sets in different scenarios. We consider several realistic cases, by varying key parameters like the number of users requesting each resolution, network connection (capacity of each client connection and overall CDN capacity), and type of video (sport, documentary, movie, cartoon). By analyzing the solution of the ILP in each scenario, we notice recurrent patterns and derive few generic guidelines, which can be useful for content providers in the selection of the best encoding parameters.
The remainder of this paper is organized as follows. Related works on adaptive streaming are described in Section II. The formulation of the optimization problem as an ILP is provided in Section III. In Section IV, we detail the simulation settings. In Section V, results are provided to study the system performance of optimal representations sets w.r.t the recommended one. In Section VI, we analyze the behavior of the optimal set across different configuration to derive the guidelines. Finally, conclusions and future works are discussed in Section VII.
II Related Works
During the last decade, adaptive streaming has been an active research area, with most efforts aimed at developing server-controlled streaming solutions. Recently, a client-driven approach, based on HTTP-adaptive streaming [3, 4], has gained popularity and attention. In this new paradigm, the clients decide which segments to get and when to request them, and the server mainly responds to the clients’ requests. Different implementation of this new architecture have been proposed in various commercial DASH players [9].
Most of the research effort in adaptive streaming has been devoted to improve the client controller, i.e., to optimize the representations selection for each user [10, 11, 12]. The controller behavior is generally driven by an estimate of the network dynamics [13] and the state of the client buffer [14]. The general objective is to maximize the Quality of Experience (QoE) for the users while avoiding unnecessary quality fluctuations. For example, the selection of the representation can be optimized in such a way that large variations of rates in successive segments are avoided, since large rate variations may lead to an unpleasant viewing experience [15, 16, 17]. Other solutions for the controller have also been investigated in order to minimize the re-buffering phases [12, 15]. On a more general perspective, it has been shown that the current HTTP-adaptive streaming systems have limitations when a large number of clients share the same network [18]. Hence, some recent research works modify the client controllers in order to simultaneously reach fairness and efficiency when many clients share the same bottleneck link [19, 20]. Rather than focusing on the client controller design, the work in [21] investigates a DASH streaming system over a mobile network where a proxy rewrites client HTTP requests in such a way that the overall QoE experienced by multiple clients is optimized. The work in [21] addresses the main limitations of multiple-clients DASH systems; however it does not address the problem of optimizing the representations on the server and rather seems complementary to our work.
Despite the many, recently published, papers about DASH, the problem of selecting proper representations to be stored on the server has been mostly overlooked. The set of available representations is usually supposed to be known (and fixed). These representations are often selected based on vendor or content provider recommendations, as in the case of Apple [6], Microsoft [7], and Netflix [8]. To the best of our knowledge neither the recommendations from system manufacturers nor the choices made by content providers have been supported by any scientific study in the literature. Rather they seem to be based on admittedly fairly good heuristics.
The importance of the optimized representations sets in adaptive streaming has recently been highlighted in [11], where authors show that the representations sets may affect the behaviors of some adaptation methods. For example, a gain can be achieved when the representations set available at the server is selected based on the video content information rather than simply the rate information. However, the authors do not propose an optimization of the set nor guidelines on the selection of the representations set. Encoding rate optimization has been investigated very recently in [22], for on-demand videos in a storage-limited scenario. Rates are optimized in such a way that the best possible QoE is provided to a pool of users and a total storage capacity constraint is met. All the scenarios presented in [22] consider a homogeneous user population and this is a key assumption exploited in the solution of the optimization problem. In [23], the optimization of the set of representations in the case where heterogeneous users are characterized by a static link capacity and a single acceptable resolution has been studied. In this paper, instead, we explicitly model different types of users, in terms of access link capacity and devices used. We also take into account the dynamic aspect of the channel as well as different types of video as this has a non-negligible impact on the perceived QoE.
III Problem Formulation
We now present the problem formulation. The goal is to select the best representations set, taking into account video content, available network capacity and users’ characteristics. We consider the user population (in terms of requested video content and resolution) and the CDN total capacity as known values. We model the time-varying available capacity between the CDN and each client using one cumulative density function (CDF) for each client. Statistics are extrapolated from the publicly available dataset presented in [24], where network measurements have been collected by a DASH module from more than a thousand Internet clients.
In the following, we first introduce the notation used in the problem formulation. Then we present the ILP used to compute the optimal representations sets.
III-A Definitions
Let be the set of videos. Each video can be encoded using different representations, each one characterized by the encoding rate and the spatial resolution , being and respectively the sets of bit rates and spatial resolutions that are admissible for the representations. The triple (, , ) corresponds to the representation of a video encoded at rate and resolution . Note that is a pure integer number that represents the rate index in . The nominal value (in ) of the encoding rate is denoted by . Each resolution admits encoding rates within the range , for video .
Let be the set of users that the CDN network should serve, where each user requests a video and plays the video representation at a given spatial resolution corresponding to the user display resolution (i.e., the spatial resolution at which the video will be displayed on the user’s device). We follow the assumption that a user can play segments encoded at resolutions different from its display size by performing spatial down-sampling/up-sampling before rendering. We denote by the percentage of time that user has a link capacity larger than for a certain encoded rate . These parameters are computed from the cumulative distribution function of the measured throughput of the user , using the dataset described in [24]
| Name | Description |
|---|---|
| Satisfaction level for the representation of video , watched at display and encoded at rate and resolution | |
| Percentage of time during which the throughput of user is larger than the value of the encoding rate | |
| Minimum percentage of time during which a user is served | |
| Value in of the encoding rate | |
| Value in of the minimum encoding rate that the video at resolution can admit. | |
| Value in of the maximum encoding rate that the video at resolution can admit. | |
| Video channel requested by user | |
| Display size (spatial resolution) for user | |
| Average CDN budget defined as average capacity per user in | |
| Total number of representations used, i.e., triples (, , ) available at the server | |
| Fraction of users that must be served |
A user with a display resolution watching video encoded at resolution experiences a satisfaction level , which is an increasing function of the encoding rate . Generally, for a given pair (, ), the satisfaction level is higher if the video resolution is the same as the display resolution than if . This is due to artifacts introduced by the up-sampling and down-sampling of the spatial resolution during the decoding process on the user side. For the sake of clarity, throughout the paper we denote the satisfaction level by rather than .
We define the optimal encoding parameters set as the one that maximizes the expected user satisfaction, subject to several constraints imposed by both the delivery system and the service provider. The constraints that we formulate for this problem derive directly from real challenges identified by service providers. We highlight three such constraints:
- i.
-
The overall CDN capacity available to deliver all the video streams. In general, video service providers reserve an overall budget (in $) for video delivery and use it to buy a delivery service from a CDN provider. In today’s CDN, the price depends on the sum of all the rates of all the video streams originating at the content provider [25]. Thus, the video service provider is interested in maintaining the total delivery bandwidth below a given value, here represented by , where denotes the average CDN budget in terms of hired capacity per user in and denotes the number of users of the CDN.
- ii.
-
The total number of representations, denoted by , is the total number of triplets (, , ) provided to the ingest servers. A higher number of representations means more complexity and higher system costs for the video service provider. Higher complexity comes from more data to handle, log, store and deliver while system cost directly derives from the number of machines that have to be provisioned to encode raw video and from storage costs. To have an idea of possible storage and maintenance costs, a website like justin.tv has to maintain about video channels simultaneously [26].
- iii.
-
The minimal fraction of time during which some users should be served. Ideally, the service provider would like to serve all the users. But in certain cases, especially when the number of representations is small, users might not be served if the channel capacity is too small for the available representations. In this case, the representations set which optimizes the average satisfaction might not lead to fairness among users. To address this problem, we impose that at least a fraction of users must be served for at least a fraction of time . 111As there exist different definitions of fairness, this constraint can be modified accordingly.
Table I summarizes the notation used in this paper.
III-B ILP Model
We now describe the ILP formulation for computing the optimal set of representations. The decision variables in our framework model are the following:
-
•
: percentage of time during which user is served by a representation of video at resolution and rate
-
•
-
•
-
•
With these variables, the optimization problem can be formulated as shown in (1).
| (1a) | ||||
| (1b) | ||||
| (1c) | ||||
| (1d) | ||||
| (1e) | ||||
| (1i) | ||||
| (1j) | ||||
| (1k) | ||||
| (1l) | ||||
| (1m) | ||||
| (1n) | ||||
| (1o) | ||||
| (1p) | ||||
| (1q) | ||||
| (1r) | ||||
The objective function (1a) maximizes the sum of the user satisfactions averaged over time. The constraints (1b), (1c) and (1d) set up a consistent relation between the decision variables , and . The constraint (1e) guarantees that a user plays a given representation only for the percentage of time during which the maximal user throughput is larger than the encoding rate of the representation. The constraint (1i) establishes that a user can play only those representations of the requested video with spatial resolutions compatible with the user display size , that is only representations with resolutions are allowed. Namely, the possible down-sampling/up-sampling operations at the rendering are constrained to the resolutions that are immediately adjacent to the nominal user display size . The constraints (1j) and (1k) force to zero some variables in order to ensure that each user only watches representations of video at resolution encoded at the bit rates in the range between the minimal and maximal admissible rates for the video and the resolution . The constraint (1l) guarantees that the sum of the average bit rates downloaded by all users is lower than the overall CDN budget . The constraint (1m) fixes the maximal number of representations made available at the server. Finally, the constraints (1n) and (1o) force the system to serve at least a certain percentage of users during a certain percentage of time .
A simplified version of this model could be easily derived for those scenarios where the information of client bandwidths is a priori available. For instance, if the content provider obtains the access bandwidth of the end-users at one time instant or estimates this bandwidth by using a representative statistics, like an average value, a median value or a th percentile. In these cases, the content provider uses a unique value to model the link capacity of each user , motivating the introduction of the following changes in the ILP formulation of (1): (i) the cumulative distribution function of each user is assumed to be a unit step function centered at the value , (ii) the variables are forced to be binary, and (iii) is fixed to 1. We must note that the resulting formulation becomes equivalent to the ILP introduced in [23].
IV Numerical Analysis Settings
We now describe the simulation framework that has been used to study the ILP introduced in Section III-B for computing the optimal representations sets. We have used the generic solver IBM ILOG CPLEX [27] to solve different instances of the ILP and to compare the optimized representations to the ones recommended by manufacturers and content providers. We have considered different configurations in our study of the system performance. These scenarios are not meant to be an exhaustive list covering all possible cases. Rather they illustrate how the optimal set of representations changes in several realistic cases.
| Video Type | Video Name |
|---|---|
| Documentary | Aspen, Snow Mountain |
| Sport | Rush Field Cuts,Touchdown Pass, |
| Cartoon | Big Buck Bunny, Sintel Trailer |
| Movie | Old Town Cross |
| Resolution Name | Width x Height |
|---|---|
| 224p | 400x224 |
| 360p | 640x360 |
| 720p | 1280x720 |
| 1080p | 1920x1080 |
IV-A User Satisfaction Evaluation
We characterize each video at a given spatial resolution by one satisfaction function that depends on the display resolution and expresses the QoE as a function of the encoding rate. Several works have investigated how to model this behavior but a uniformly accepted model is still missing [28]. In our case, we model the satisfaction function as a Video Quality Metric (VQM) score [29], which is a full-reference metric that has higher correlation with human perception than other MSE-based metrics, as shown in [30]. For spatial down/up-sampling in the video player, we adopt the Avisynth Lanczos filter [31], which has been already adopted in existing video players/tools [32, 33].
We have evaluated the VQM score for four different types of test sequences available at [34]. Each of these test sequences corresponds to a representative video type as given in Table II. The tested sequences have been encoded at different rates and at the resolutions described in Table III. Since the VQM score ranges from to for the best and the worst QoE, respectively, we associate the user satisfaction level with the score. The empirical measures obtained from evaluating the aforementioned sequences are depicted as continuous lines in Fig. 2 for the sport video. For the sake of brevity, here we depict only the sport video curves. From these figures we can better understand the video classification. Video categorization is aimed at providing a rough but yet accurate notion of motion level of the video content. For example, most sport sequences have a higher-motion level than most documentary sequences. This can be observed from the satisfaction curves, which are steeper for documentary sequences than for sport ones. We provide the full set of satisfaction curves and fitting models in the Online Appendix.
From these measures, we derived a satisfaction function by fitting a function of the following form:
| (2) |
It represents the satisfaction level of user receiving video encoded at rate and resolution and displayed at size . Table IX, in the Online Appendix, gives the parameters and used in the curve fitting process for each video and resolution to be displayed at size . We recall that the parameter is the nominal value in of the rate . Note that the expression in Eq. (2) has an explicit dependency only on the encoding rate, while other parameters (video content information, encoding resolution, spatial down/up-sampling) are implicitly taken into account into the model parameters and . The satisfaction curves evaluated from Eq. (2) are identified by circles in Fig. 2.
Note also that other satisfactions functions could be considered. However, as mentioned above, to this day there are no commonly accepted QoE metrics [35, 28], and the metric considered in Eq. (2) takes into account all factors that are critical in our problem formulation.
IV-B User Population Characteristics
A user is characterized by three parameters, which
we assign as follows:
The requested video stream . Users are randomly assigned
to one of the four video types given in Table II. Each
video type has the same probability ( out of ) of being selected.
Statistical information about the streaming rate capacity
. Recall that is defined as the percentage of time a user
has a streaming capacity greater than the encoding rate . We model the
streaming rate capacity with help of the dataset in [24] that
contains multiple measurements of thirty-second-long DASH
sessions from thousands of geographically distributed IP addresses. Each
thirty-second measurement is associated with a user (IP address). Note that we
have used users that have many thirty-second measurements in the dataset. From
the measurements in the dataset, we infer the download rate of each IP
address for every chunk of the session. Fig. 3 illustrates
the process we have used to compute the rate for each user. On the left, we show
the number of bytes in every two-second-long chunk. In the middle, we show the
time it takes for each IP address to entirely download the chunk. These two
values are from the dataset. On the right, we compute the download rate for each
IP address and for each chunk. Note that we do not consider the first five
chunks of each session, so that the rump-up phase of each session is ignored.
After we have computed the download rate of each user, we select a
representative population of users from the distinct IP addresses
from the dataset. We first filter the whole population and keep only the IP
addresses of those clients whose th percentile of the download rate is
lower or equal to , which is the maximum encoding rate in our encoded
set. Out of these selected users we then choose the IP addresses having the
largest number of sessions. At the end, each user in our simulation framework
is associated with one of the selected IP addresses. The streaming rate
of this user is computed from all the measurements in the dataset for the
corresponding IP address.
The display size (spatial resolution) .
We categorize users into classes based on the display size as
follows. We assume that each user is characterized by the distribution of the
available streaming rate, as described above, based on the dataset
in [24]. Based on their rate, users request a display size that fits the average available link capacity. For example, we associate users to a display size of 224p if the of the user link realizations can be found below . More formally, users
with the th percentile of download rate lower than
(respectively , , and ) are
associated to a display size of 224p (respectively 360p,
720p and 1080p). For the sake of clarity, we use the name of few devices
to indicate each class of users: smartphone for the users associated with the
224p resolution, tablet for 360p, laptop for 720p and high definition television (HDTV) for 1080p. Note that
the device-based label we assign to users is not a strict categorization, it
is rather a shorthand to identify each group of users as each group is
homogeneous in terms of requested resolution and link capacity statistics.
This classification leads to a scenario with (respectively , ,
and ) users in the smartphone category (respectively tablet, laptop, and
HDTV).
IV-C Default ILP Settings
We detail now the default settings used in the ILP instances studied in the numerical analysis. These settings remain unchanged unless otherwise mentioned. First, the video catalog and spatial resolution set correspond to the video sequences and resolutions indicated in Table II and Table III. The satisfaction coefficients are fixed for each triple (, , ) according to the satisfaction curves extrapolated from Eq. (2) with the parameters defined in Table IX.
The set of encoding rates is computed based on the user satisfaction curves. In particular, for each video at resolution displayed at a display size such that , we identify as minimum and maximum encoding rates those achieving a user satisfaction of and , respectively. The range is then discretized with a uniform step. In our case, a step of is considered, for a total of discrete values of the satisfaction function. For each of these satisfaction values, using these values in Eq. (2) with parameters in Table IX, we identify the corresponding rate . The minimum and maximum encoding rates and for each video and resolution derived with this procedure are shown in Table IV.
In our tests, we use the user population described in Section IV-B, whose cardinality is users. Larger populations could also be considered. Note however that the optimal representations sets derived in this work are highly sensitive to the heterogeneity of users’ profiles, in terms of bandwidth and requested videos, and not necessarily to the population cardinality. The average CDN budget capacity per user () is set to unless otherwise specified. This large value of implies that the system is not constrained by the overall CDN budget capacity. The maximum number of representations () is , the fraction of users that must be served () is and the minimum fraction of time during which users should be served () is .
Finally, we would like to the mention that, for instances created according to the above settings, CPLEX was able to solve the ILP model in a few minutes on an Intel(R) Xeon(R) CPU E5640 @ 2.67GHz with 24 GB of RAM.
IV-D Video Player Controller
Given a representations set (either the solution of the ILP or one based on a specific recommendation), we need to evaluate the performance for realistic “sessions”, where a realistic video player mimics the behavior of real video player implementing adaptive streaming technologies. To this end, we implement two different rate-adaptive controllers:
| 224p | 360p | 720p | 1080p | |||||||||
|---|---|---|---|---|---|---|---|---|---|---|---|---|
| Movie | 51 | 1961 | 67 | 2973 | 832 | 9378 | 1888 | 24803 | ||||
| Sport | 183 | 1766 | 429 | 3190 | 1106 | 11517 | 1976 | 19471 | ||||
| Documentary | 116 | 1488 | 231 | 2861 | 523 | 10607 | 1022 | 10945 | ||||
| Cartoon | 52 | 1418 | 64 | 2006 | 451 | 5321 | 835 | 13133 | ||||
ILP controller.
Among the representations available at
the server, each user asks for the one with the highest level
function among the ones with the encoding rate lower than or equal to the user
capacity. If no representation is available, the user is not served
(user in outage) and the user satisfaction is set to zero. This
controller mimics the behavior that is considered in the ILP formulation.
No-outage controller.
As above, each client asks for the
representation with the highest satisfaction level but with an encoding rate
lower than or equal to the user link. However, if no representation is
available, the client asks for the representation that minimizes the excess
between the requested encoding rate and the available bandwidth. This is
justified by the fact that, in adaptive streaming scenarios, players are usually
equipped with buffers that can temporally absorb small delays due to bandwidth
fluctuations. We then assign to the user the satisfaction achieved by the
requested representation, but we also keep track of the difference between the
available bandwidth and the encoding rate selected by the client. Note that in
this second controller, each user is expected to be served, so that no outage
is experienced.
| Representation | 1 | 2 | 3 | 4 | 5 | 6 | 7 | 8 | 9 | 10 | |
|---|---|---|---|---|---|---|---|---|---|---|---|
| Apple | Rate () | ||||||||||
| Resolution | 224p | 224p | 224p | 360p | 360p | 720p | 720p | 720p | 1080p | 1080p | |
| Microsoft | Rate () | ||||||||||
| Resolution | 224p | 224p | 224p | 360p | 720p | 720p | 720p | 720p | 1080p | 1080p |
| Representation | 1 | 2 | 3 | 4 | 5 | 6 | 7 | 8 | 9 | 10 | 11 |
|---|---|---|---|---|---|---|---|---|---|---|---|
| Rate () | |||||||||||
| Resolution | 224p | 224p | 224p | 224p | 224p | 224p | 224p | 224p | 224p | 224p | 224p |
| Representation | 12 | 13 | 14 | 15 | 16 | 17 | 18 | 19 | 20 | 21 | 22 |
| Rate () | |||||||||||
| Resolution | 360p | 360p | 360p | 360p | 360p | 360p | 360p | 360p | 360p | 360p | 720p |
| Representation | 23 | 24 | 25 | 26 | 27 | 28 | 29 | 30 | 31 | 32 | 33 |
| Rate () | |||||||||||
| Resolution | 720p | 720p | 720p | 720p | 720p | 720p | 1080p | 1080p | 1080p | 1080p | 1080p |
V how good are the recommended sets?
Today’s system engineers generally select encoding parameters for the representations following recommendations given by systems manufactures or content providers. These are typically versatile enough to apply to any possible scenario but not fully optimized with respect to content or context information. In this section we provide results of a numerical analysis that addresses the following question: how good are the recommended sets?
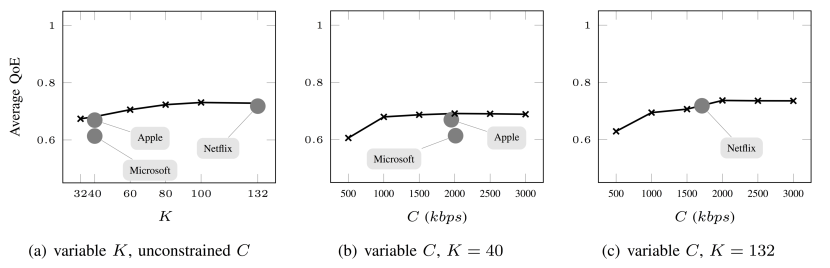
We focus on three recommended representations sets: Apple [6, 36] for HTTP Live Streaming (HLS), Microsoft [37] for Smooth Streaming (see Table V), and Netflix [38, 8] (see Table VI). Overall Microsoft and Apple recommend representations per video type, for a total of representations to be available at the server while Netflix recommends per video type, representations in total. Recommendations are compared with the optimized representations sets, namely the solution of the ILP formulation in Eq. (1). Optimal sets are evaluated for different values of both the number of representations (parameter ) and the CDN budget (parameter ) in the ILP formulation. Recall that is the CDN budget per user. Both the optimized and recommended sets are tested in the scenario described in Section IV for the ILP and the no-outage controllers.
V-A ILP Controller
The main performance metric that we consider in the ILP formulation is the average QoE per user, i.e., the average satisfaction. In Fig. 4, we show the average QoE for various numbers of representations and various values for the CDN budget. Our results show that the recommended sets perform reasonably well in terms of QoE, confirming what has been presented in [23]. Typically, Apple and Netflix recommended sets are almost as good as the optimal one if the number of representations is not constrained. However the optimized sets can perform equally well with a smaller number of representations. Namely, Apple performance can be obtained with representations and Netflix ones with . It is also worth noting that there exist representations sets that can also perform at least as well as Apple (respectively Microsoft) recommended sets with two (respectively four) times less overall bandwidth consumption (CDN budget).
| Cartoon Type | ||||||||||||
|---|---|---|---|---|---|---|---|---|---|---|---|---|
| Representation | 1 | 2 | 3 | 4 | 5 | 6 | 7 | 8 | ||||
| Rate () | ||||||||||||
| Resolution | 224p | 360p | 360p | 720p | 720p | 720p | 720p | 1080p | ||||
| Documentary Type | ||||||||||||
| Representation | 1 | 2 | 3 | 4 | 5 | 6 | 7 | 8 | 9 | |||
| Rate () | ||||||||||||
| Resolution | 224p | 224p | 360p | 360p | 360p | 720p | 720p | 720p | 720p | |||
| Movie Type | ||||||||||||
| Representation | 1 | 2 | 3 | 4 | 5 | 6 | 7 | 8 | 9 | 10 | 11 | |
| Rate () | ||||||||||||
| Resolution | 224p | 224p | 224p | 360p | 360p | 360p | 720p | 720p | 720p | 720p | 720p | |
| Sport Type | ||||||||||||
| Representation | 1 | 2 | 3 | 4 | 5 | 6 | 7 | 8 | 9 | 10 | 11 | 12 |
| Rate () | ||||||||||||
| Resolution | 224p | 360p | 360p | 360p | 360p | 360p | 720p | 720p | 720p | 720p | 720p | 720p |
To give a better understanding of the optimal representations set and how this differs from the recommended ones, Table VII shows the optimal solution (i.e., optimal representations set) of the ILP for and . By comparing the optimized set with the recommended ones (Table V and Table VI) we can notice that the former does not have an equal number of representations per video type; the encoding range changes according to the video type. The different videos have different content characteristics (e.g., different motion levels) and they are better represented by a non-uniform allocation of the rate over a given encoding range. In the following section, we study in more details the behavior of the optimized representation sets.
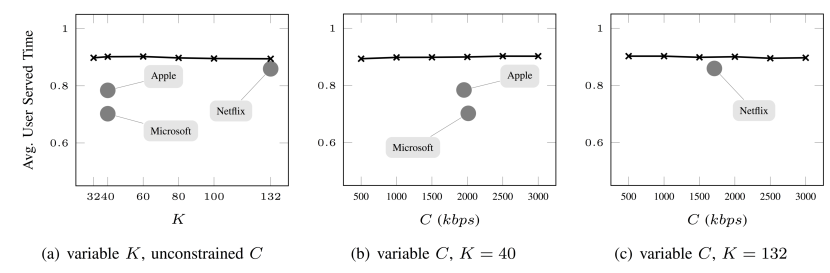
In addition to the average QoE, we are interested in reducing the outage experienced by users. Fig. 5 shows the average serving time, i.e., the average time during which a user is served. This serving time is normalized by the time duration of the session. Note that each users is served if it is able to request a representation at an encoding rate lower than its own available bandwidth. An average service time of means no outage, in other words, for each user there is always a representation that can be downloaded, i.e., there is always a representation encoded at a rate lower than the link capacity of that user. Intuitively, since the ILP takes into account all the possible link capacities experienced by users over time, it tends to offer a representations set well suited to channel dynamics. The results shown in Fig. 5 confirm this intuition. For every number of representations and every value of the CDN budget , the ILP can determine a representations set that covers well the range of user capacities. It is worth noting that, in terms of serving rate, the optimized set outperforms the representations sets recommended by Apple, Netflix, and Microsoft. This means that the ILP formulation, which takes into account the channel dynamics, provides a representations set more robust over time than recommended sets, leading to an average serving time of about .
By combining the results of Fig. 4 and Fig. 5, we conclude that the recommended sets perform well in terms of average QoE, but at a price: a high number of representations, a high CDN budget, and a low tolerance to variable downloading rates. The above results, however, consider a simplistic controller in which a user cannot be served when the requested rate exceeds the available bandwidth, i.e., when the encoding rate is greater than the link capacity. To provide a fair comparison with the existing recommendation sets, we analyze the performance of the proposed set also for the no-outage controller.
V-B No-Outage Controller
We now analyze the optimized representations set when the video players implement the no-outage controller. This controller is probably closer to the typical behavior of real clients than the ILP controller, but it does not exactly correspond to the model considered in the optimization problem in Eq. (1). We analyze in this case the downloading rate overshooting, which is experienced any time a user requests a representation at rate that overshoots the channel link (i.e., ). The downloading rate overshooting metric measures how much the link capacity is overshoot and it is evaluated as . Note that we consider only the case in which the representation overshoots the channel bandwidth and not viceversa, so we do not take into account negative values of the downloading rate overshooting metric. Ideally, we would like to constantly experience a null downloading rate overshooting, i.e., we always would like the requested representation to be supported by the channel link. In more realistic settings, in which the downloading rate overshooting is not null, we would like it to be as low as possible. Indeed, a small downloading rate overshooting can be easily absorbed by the buffer that is usually available at the client’s player. On the contrary, a high downloading rate overshooting might provoke video freeze for re-buffering.
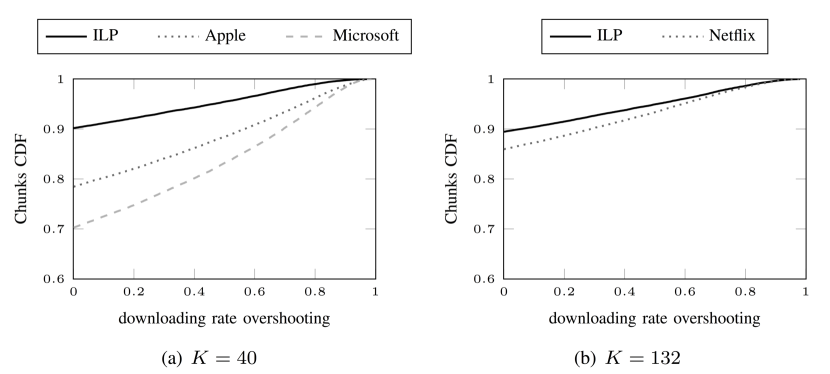
Fig. 6 shows the CDF of the event of downloading rate overshooting for both default numbers of representations and , which are used by the recommendations under consideration in this paper. Note that in the ILP formulation, the CDN budget is not constrained. In all cases, the recommended sets perform badly in comparison to what is obtained by the optimal representations set (although reducing the downloading rate overshooting is not the objective of the ILP formulation). In more details, when , the ILP finds representations sets with of chunks having a null downloading rate overshooting, while it is less than for Apple and for Microsoft. Furthermore, a high number of chunks are downloaded with a high downloading rate overshooting. For example, a downloading rate overshooting of 0.5 means that the video player needs a one-second buffer to compensate a two-second video downloading. For both Microsoft and Apple recommended sets, more than of chunks lead to such an annoying event. This result demonstrates that the optimal representations set takes into account the channel variations without sacrificing the overall QoE.
VI Guidelines
In this section, we perform a comprehensive set of experiments with the objective of providing some guidelines for selecting the representation sets. To obtain general guidelines, we need to consider multiple parameters in the users’ population and CDN characteristics in order to identify the main trends. This flexibility cannot be achieved with the population described in Section. IV since it is extracted from a specific data set, corresponding to only one population. We thus use the same idea as in [23], which is to generate a synthetic user population characterized by a certain number of parameters. In this way we can explore different scenarios in a systematic manner by changing the values of these parameters consistently. In the following, we first describe how we generate the synthetic user populations sets. Then, we describe the guidelines.
VI-A Synthetic User Population Generation
| Network | Minimum | Maximum | Attachment |
| Type | Bandwidth | Bandwidth | Probability |
| (in ) | (in ) | ||
| WiFi (high load) | 0.15 | 0.8 | 0.3 |
| 3G | 0.4 | 4 | 0.2 |
| ADSL-slow / WiFi (normal load) | 0.3 | 3 | 0.1 |
| ADSL-fast | 0.7 | 10 | 0.3 |
| FTTH | 1.5 | 25 | 0.1 |
A user is characterized by three parameters: requested video stream , requested resolution and local network capacity . These three parameters are assigned as follows:
-
•
: users are randomly assigned to one of the four video types given in Table II. Each video type has the same probability ( out of ) of being selected.
- •
-
•
: users are randomly assigned to one of the five network types in Table VIII, using the probability given in the last column of the table. Once a user is associated to a given type of network, is selected as a uniformly distributed random value between minimum and maximum capacity (second and third column in Table VIII).
In comparison with the population described in Section. IV and simulated in Section. V, the link capacity of a user is not characterized by a cumulative probability distribution. It rather assumes a constant value . The rationale behind that is to avoid generating complex populations with arbitrary channel variations, which challenges our original objective of having a common framework where population parameters can be easily modified. Thus, we run in the following the simplified version of the system model that is actually equivalent to the ILP in [23], and introduced in Section. III-B.
VI-B Results
Studying the optimal representations sets evaluated across different populations, we derive four guidelines.
Guideline 1: How many representation do we allocate per video type? The number of representations per video type should be content-aware: a larger number of representations needs to be dedicated to more complex video sequences.
A weakness of the recommended representations sets is that the number of available representations is the same for any video type, despite the different content characteristics. Fig. 7 shows the average number of representations dedicated to any video type as a function of the video resolution for the optimal representations sets. Results are depicted for two cases: when users can play representations encoded at a resolution different from their display resolution (resolution switching), when users are forced to only play videos encoded at their display resolution (no resolution switching).
A first important observation is that using resolution switching can drastically affect the optimal representations set, as it can be observed by comparing Fig. 7(a) to Fig. 7(b). Given the user satisfaction curves in Fig. 2, when resolution switching is allowed (Fig. 7(a)), high resolution videos (i.e., 1080p) require higher rates yet the user satisfaction is almost identical to the one obtained using up-sampled 720p videos, which require a lower rate. This means that, in our setting, 1080p resolution videos are redundant in terms of quality offered to users, and when the total number of representations is limited, redundant representations are not included in the optimal set. If no resolution switching is allowed (Fig. 7(b)), videos at 1080p are not redundant anymore, since they are the only resolution that can serve HD users. This comparison highlights the importance of taking into account a QoE metric in the optimization algorithm. A second consideration is that some videos clearly require more representations than others: about on average for sport videos while only about representations on average for cartoon, for the case of switching resolution. This is justified by the fact that sport videos have more complexity in the scene, leading to a wider range of QoE values than for the cartoons. Hence the need to have more representation for the sport video type rather than for the cartoon type.
Rather than a uniform distribution of video types across users, we now study the optimal representations set for non-uniform popularity of video types. This should confirm that these results are not biased by our default configuration.
Four video types are still considered, i.e., documentary, movie, sport and cartoon, but only of users watch the documentary, another watch the movie, and the remaining watch either the cartoon of the sport video. More precisely, is the percentage of users watching the sport video, and is the percentage of users watching the cartoon. In Fig. 8, the parameter ranges from (no sport videos) to (no cartoon videos). We measure the distribution of the number of representations over the different videos when . In other words, Fig. 8 shows, out of the representations, how many are dedicated to each type of video. For example, when both sports and cartoon are requested by of the population, representations are unequally distributed among videos ( for sport while for the cartoon). Similar observations can be derived from Fig. , where we have considered the same video requests fraction as above ( for documentary, for movie, for sport, and for cartoon) but for the case in which resolution switching is allowed. Also in this case, when both sports and cartoon are requested by of the population, representations are unequally distributed among videos ( for sport while for the cartoon). Fig. 8 and Fig. (a) confirm our previous observations. Some videos, like cartoons, are under represented irrespective of their popularity. Cartoon videos are the of the total of representations even when they are requested by of the population. This shows that the the content information, reflected in our case by the QoE user satisfaction function, is a critical input for selecting representation sets.
Guideline 2: For each video, how do we allocate the available representations across resolution? The distribution of the representation across resolutions should follow the distribution of user population across resolutions, putting an emphasis on the largest distributions.
For a first analysis of the representation distribution per resolution, we can refer again to Fig. 7(b). For a given video, the number of representations increases with the resolution, but the increase is not substantial. Although the number of representations for sport videos is higher than for cartoon, we find here that there are on average representations at 224p and at 1080p. This is however not a major trend.
To dig deeper in the trend of representations distributions across resolutions, we change the ratio of users’ devices in the population. Similarly to the ratio of users’ videos in the population in Fig. 8, we consider an unequal allocation of users to devices: of the population is identified as tablet users, as laptop users, and the remaining is shared between smartphone and HDTV users. We denote by the portion of HDTV users and portion of smartphone users. Fig. 8 and Fig. (b) show the ratio of representations for every resolution, for the no switching and switching case, respectively. The impact of the heterogeneity of users on the distribution of resolutions is less significant than for the popularity of videos. The evolution of the ratio of representations per resolution follows the evolution of the distribution of devices in the user population. We also observe a slight over-representation of higher resolutions independently of the ratio of HDTV users.
Guideline 3: For each video at a given resolution, how do we allocate the available representations across the encoding rates? The higher is the resolution, the wider should be the range of encoding rates. Moreover, regardless the resolution, at least one representation encoded at lowest allowed rate should always be included.
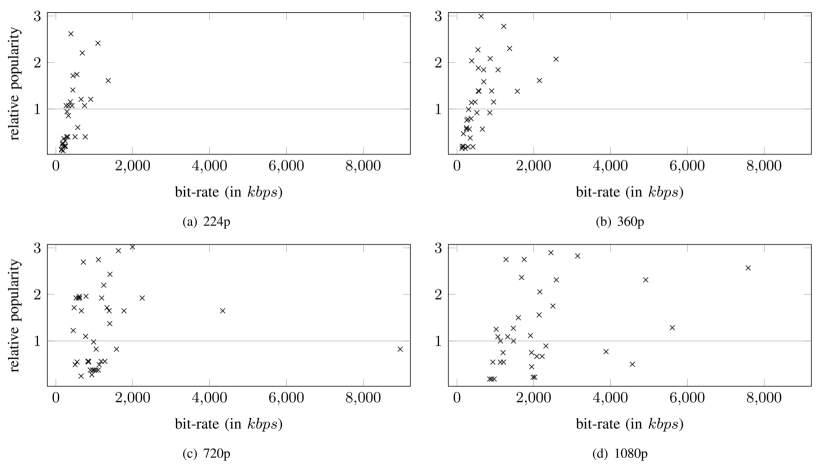
With the proposed ILP formulation, we obtain an optimal set that maximizes the average user satisfaction. However, system engineers are also interested in maintaining consistency in their systems, trying to avoid for example that one representation is accessed by a lot of users although another representation serves only a few users. In Fig. 10, not only we get some valuable insights about the range of bit rates in the optimal representation sets, but we can also analyze the “popularity” of each representation.
We define the relative popularity as a value that indicates whether a representation is “over-assigned” (relative popularity greater than one) or “under-assigned” (relative popularity lesser than one). In particular, let be a set of representations for a given video and a given resolution. Let be one representation in . Let be the number of users who watch said video at said resolution. The average number of users per representation, which is hereafter noted by , is given by . Let be the number of users assigned to representation . The relative popularity of the representation is simply:
In Fig. 10, we gather the results of several realizations of the user population. No resolution switching is allowed in this figure. We denote each realization as one run and we provide results for a total of five runs. One mark shows that one representation has been created in one of the five runs for one of the videos. For each mark, we show the bit rate and the relative popularity of the representation.
Our first observation is that the higher the resolution, the broader the range of bit rates for the representations. Typically for the 1080p resolution, the bit rates ranges from to almost . Such range is much larger than the one for the 224p resolution, from to .
Our second observation is that there exists a dense area of representations in the “south west” of every figure, meaning that there exist representations with the lowest possible rates in the optimal representations set, and that these representations are overall not accessed much. There are two reasons for such density in the low rates. First, the system has to ensure service for users connected by low capacity links (i.e., small values of ). It is thus necessary to have a representation at one of the lowest possible rates. Second, the gains in terms of QoE are usually large for low rates, so the encoding of a large number of representations at low rates is valuable because a small increase of the link capacity at the client side can result in a significant QoE gain. In other words, at a given resolution, the distance between two consecutive representations in terms of encoding bit rate should be smaller for those representations with lower rates and higher for those ones with higher rates.
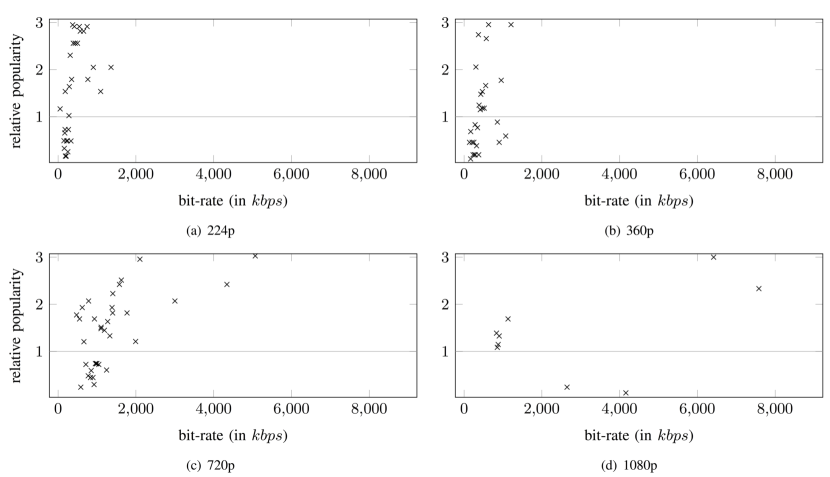
Our third observation is that no representation has a “relative popularity” larger than three. Thus, a constraint on the maximum number of users assigned to a representation is not necessary, although it would be trivial to add it to the ILP formulation. Similar considerations can be derived from Fig. 11, where resolution switching is allowed.
Guideline 4: How can we save CDN bandwidth still guaranteeing a good representations set? To achieve low CDN budgets, the range of encoding rates used at each resolution should be narrow, the number of representations per resolution should be limited, mainly for large resolutions, and at least one representation at the minimum possible bit rate should be included in the optimal set for each resolution.
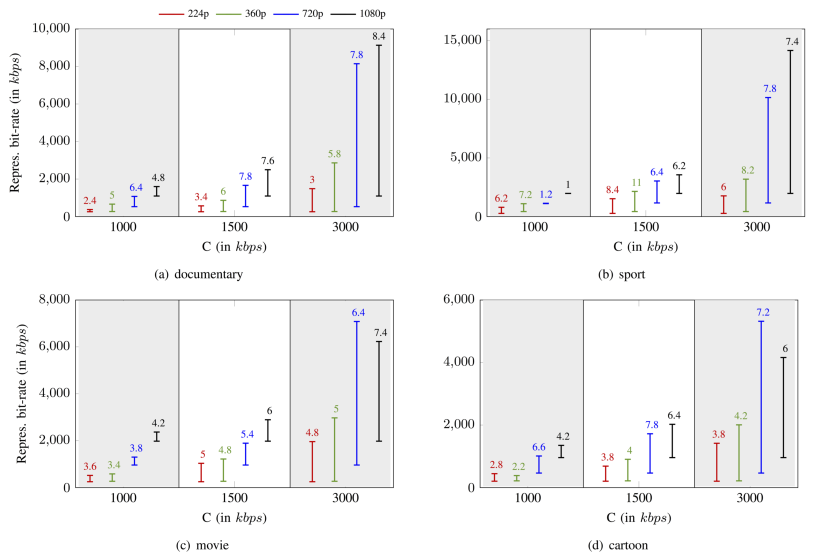
One of the major concerns of content providers is to reduce the costs of delivering video streams. Within this aim, we study the influence of the parameter , the CDN capacity for each user. The analysis of the optimal representations sets aims at identifying ways to maintain a good average user satisfaction in under-provisioned configurations.
In Fig. 12, we focus on three critical CDN capacities: , , and . An average CDN budget represents a threshold value below which poor QoE (below ) values are experienced on average for the requested representations. A budget of is rather a threshold value above which an improvement of QoE is no more experienced. This means that in our setting, leads the system to be not constrained by the CDN budget in Eq. (1l), achieving good QoE scores (above ). Finally, we considered an intermediate value , which should be enough to deliver a good quality of service to users (above ). For each of these capacities, we provide the maximum and minimum bit rates (averaged over 5 runs) of the optimal representations sets. The number above the bar is the average number of representations per resolution and per video. The total number of representations is to be distributed among all videos and resolutions.
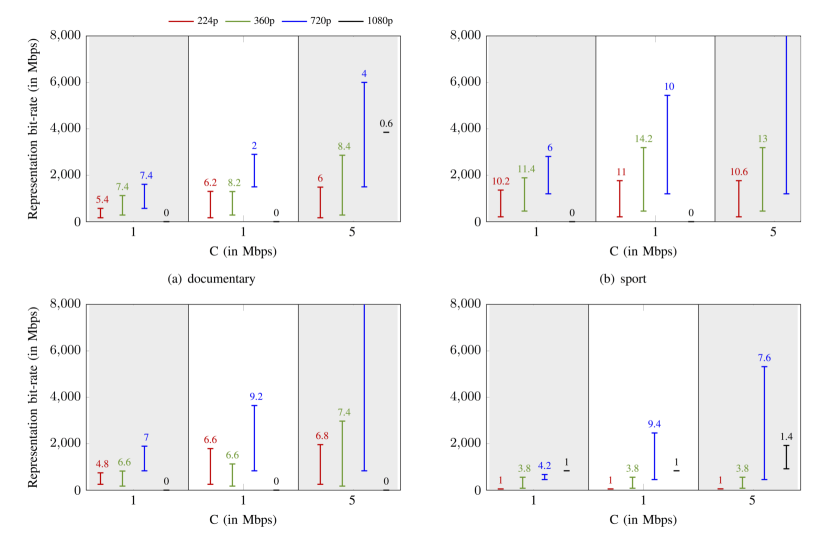
For a low capacity (), there are very few representations, only representations on average (evaluated by summing the number above the bar for all resolutions and videos in the subplots) despite the maximum being . The ranges of bit rates are very small as well. An efficient set of representations in such an under-provisioned context contains a few representations per resolution, at least one at the minimum possible bit rate. A similar trend is visible for . The number of representations increases, but the ranges of bit rates are still small. Note that similar trends are observed in Fig. , where resolution switching is allowed at the decoder.
Finally, the scenario where confirms our three first guidelines. The ranges of bit rates are larger for high resolutions, the number of representations depends on the videos and the number of representations is slightly higher for higher resolutions.
VII Conclusions
In this paper, we have proposed a new optimization problem for the selection of the representations set that maximizes the average satisfaction of users in adaptive streaming systems. We modeled this problem as an integer linear program, whose optimal solution can be computed by a generic solver. The optimal set of representations is defined as the one that maximizes the users’ satisfaction, given information about users population, network dynamics, and video content. We have conducted a detailed numerical analysis of the performance of the optimal representations sets and the ones based on recommendations from system manufacturers and content providers. We have also derived practical guidelines for system engineers in charge of the encoding process in adaptive streaming delivery systems. Most of our study have considered dynamic network profiles for a given audience. As future works, we envision to extend our study to dynamic clients requests.
This paper opens a large number of perspectives. It reveals the gap between existing recommendations and solutions that maximize the average user satisfaction. Although the representations sets can severely impact the average QoE of users in adaptive streaming, this topic is still overlooked in the literature. We therefore outline the importance of optimizing the representations sets in today’s video delivery systems. We gather information from various engineers and stakeholders to build a reasonable model in both theoretical and practical contexts. The large number of parameters to take into account when addressing optimization problems in this area however pose important challenges. This paper is a first step toward a better understanding of the interaction and correlation between the numerous system parameters and the different blocks of the video delivery chain. It opens new perspectives toward the design of processes that automatically set encoding parameters at the ingest server of content delivery architectures.
Appendix A QoE Metric
In this section, we provide further details on the user satisfaction function of Eq. (2), which is given by
In Table IX we show the parameters and used in the curve fitting process for each video and resolution to be displayed at size .
| Video: Rush Field Cuts | Video: Big Buck Bunny | |||||||||||
|---|---|---|---|---|---|---|---|---|---|---|---|---|
| Display | Res. | m | n | o | Display | Res. | m | n | o | |||
| Size | Size | |||||||||||
| 224 | 224 | -0.10 | 188.63 | 196.92 | 224 | 224 | -0.02 | 35.60 | 31.63 | |||
| 224 | 360 | -0.04 | 167.48 | 62.29 | 224 | 360 | 0.11 | 2.045 | -87.70 | |||
| 360 | 224 | 0.04 | 219.79 | 235.89 | 360 | 224 | 0.05 | 14.46 | -60.65 | |||
| 360 | 360 | -0.12 | 445.59 | 422.25 | 360 | 360 | -0.02 | 49.20 | 116.24 | |||
| 360 | 720 | -0.06 | 339.13 | -164.01 | 360 | 720 | 0.04 | 23.97 | -800.08 | |||
| 720 | 360 | 0.06 | 447.38 | 426.25 | 720 | 360 | 0.09 | 23.37 | 22.26 | |||
| 720 | 720 | -0.10 | 1348.64 | 1574.48 | 720 | 720 | -0.03 | 166.45 | -65.56 | |||
| 720 | 1080 | -0.03 | 852.28 | 262.06 | 720 | 1080 | -0.01 | 80.94 | -1156.78 | |||
| 1080 | 720 | -0.03 | 1137.04 | 1025.20 | 1080 | 720 | -0.07 | 511.04 | 1834.94 | |||
| 1080 | 1080 | -0.07 | 1548.17 | 1286.62 | 1080 | 1080 | -0.01 | 127.78 | -523.06 | |||
| Video: Snow Mountain | Video: Old Town Cross | |||||||||||
| Display | Res. | m | n | o | Display | Res. | m | n | o | |||
| Size | Size | |||||||||||
| 224 | 224 | -0.014 | 19.50 | -68.49 | 224 | 224 | -0.04 | 77.867 | 150.03 | |||
| 224 | 360 | 0.001 | 21.32 | -120.68 | 224 | 360 | 0.02 | 65.49 | 86.00 | |||
| 360 | 224 | 0.09 | 25.49 | -55.62 | 360 | 224 | 0.07 | 112.80 | 243.34 | |||
| 360 | 360 | -0.02 | 52.52 | -105.32 | 360 | 360 | -0.04 | 136.26 | 259.10 | |||
| 360 | 720 | 0.01 | 74.37 | -371.80 | 360 | 720 | -0.04 | 462.16 | 4214.38 | |||
| 720 | 360 | 0.038 | 106.18 | 89.47 | 720 | 360 | 0.09 | 226.49 | 477.13 | |||
| 720 | 720 | -0.018 | 187.43 | -74.22 | 720 | 720 | -0.01 | 119.49 | -543.77 | |||
| 720 | 1080 | 0.01 | 204.12 | -636.24 | 720 | 1080 | 0.04 | 148.76 | -288.90 | |||
| 1080 | 720 | -0.04 | 414.67 | 704.83 | 1080 | 720 | -0.04 | 270.34 | -61.45 | |||
| 1080 | 1080 | -0.03 | 372.06 | -165.76 | 1080 | 1080 | 0.02 | 148.38 | -1498.73 | |||
In Fig. 2, we have already compared the experienced QoE curves with the one from the satisfaction curves evaluated from Eq. (2), for the sport video. In the following, we provide the user satisfaction curves for movie, cartoon, and documentary channel, respectively, in Fig. 14, in Fig. 15, and in Fig. 16.
It can be noticed that, for low display sizes (224p or 360p), the case with no up/down sampling (i.e., the case in which the display size is the same as the resolution size) is the one achieving the highest satisfaction. This is expected since no additional artifacts are introduced due to spatial filtering. However, for larger display sizes it might be more convenient to encode at an encoding resolution of 360p and then perform the up-sampling rather than directly encode at 720p resolution. This can be observed in the sport and documentary channels. Similar also for the display size of 1080p.
References
- [1] Cisco, “Visual Networking Index: 2011-2016,” Cisco Inc., Tech. Rep., May 2012.
- [2] I. Sodagar, “White paper on MPEG-DASH standard: The standard for multimedia streaming over internet,” ISO/IEC JTC1/SC29/WG11 W13533, 2012.
- [3] T. Stockhammer, “Dynamic adaptive streaming over HTTP: standards and design principles,” in Proc. ACM Multimedia Systems Conference (MMSys), 2011.
- [4] I. Sodagar, “The MPEG-DASH standard for multimedia streaming over the internet,” IEEE MultiMedia, vol. 18, no. 4, pp. 62–67, 2011.
- [5] WebRTC, “: Web browser with real-time communications.” [Online]. Available: http://www.webrtc.org
- [6] Apple, “Using HTTP live streaming.” [Online]. Available: http://goo.gl/fJIwC
- [7] IIS, “Smooth streaming technical overview.” [Online]. Available: http://www.microsoft.com/en-us/download/details.aspx?id=17678
- [8] Netflix, “Encoding for streaming.” [Online]. Available: http://is.gd/Ibo0LI
- [9] S. Akhshabi, S. Narayanaswamy, A. C. Begen, and C. Dovrolis, “An experimental evaluation of rate-adaptive video players over HTTP,” Signal Processing: Image Communication, vol. 27, no. 4, pp. 271 – 287, 2012.
- [10] L. D. Cicco and S. Mascolo, “An adaptive video streaming control system: Modeling, validation, and performance evaluation,” IEEE/ACM Trans. on Networking, vol. 22, no. 2, pp. 526–539, April 2014.
- [11] T. C. Thang, H. Le, A. Pham, and Y. M. Ro, “An evaluation of bitrate adaptation methods for HTTP live streaming,” IEEE J. Select. Areas Commun., vol. 32, no. 4, pp. 693–705, April 2014.
- [12] K. Miller, E. Quacchio, G. Gennari, and A. Wolisz, “Adaptation algorithm for adaptive streaming over http,” in Proc. IEEE Packet Video Workshop (PV), May 2012.
- [13] Z. Li, X. Zhu, J. Gahm, R. Pan, H. Hu, A. Begen, and D. Oran, “Probe and adapt: Rate adaptation for HTTP video streaming at scale,” IEEE J. Select. Areas Commun., vol. 32, no. 4, pp. 719–733, April 2014.
- [14] T.-Y. Huang, R. Johari, N. McKeown, M. Trunnell, and M. Watson, “Using the buffer to avoid rebuffers: Evidence from a large video streaming service,” ArXiv, vol. /1401.2209, 2014.
- [15] Z. Li, A. C. Begen, J. Gahm, Y. Shan, B. Osler, and D. Oran, “Streaming video over HTTP with consistent quality,” in Proc. ACM Multimedia Systems Conference (MMSys), 2014.
- [16] V. Joseph and G. de Veciana, “NOVA: QoE-driven optimization of DASH-based video delivery in networks,” ArXiV, vol. /1307.7210, 2013.
- [17] R. K. P. Mok, X. Luo, E. W. W. Chan, and R. K. C. Chang, “QDASH: A QoE-aware DASH system,” in Proc. ACM Multimedia Systems Conference (MMSys), 2012.
- [18] S. Akhshabi, L. Anantakrishnan, A. C. Begen, and C. Dovrolis, “What happens when HTTP adaptive streaming players compete for bandwidth?” in Proc. ACM ACM International Workshop on Network and Operating System Support for Digital Audio and Video (NOSSDAV), 2012.
- [19] J. Jiang, V. Sekar, and H. Zhang, “Improving fairness, efficiency, and stability in HTTP-based adaptive video streaming with festive,” IEEE/ACM Trans. on Networking, vol. 22, no. 1, pp. 326–340, Feb 2014.
- [20] X. Zhu, Z. Li, R. Pan, J. Gahm, and H. Hu, “Fixing multi-client oscillations in HTTP-based adaptive streaming: A control theoretic approach,” in Proc. IEEE Workshop on Multimedia Signal Processing (MMSP), Sept 2013.
- [21] A. E. Essaili, D. Schroeder, D. Staehle, M. Shehada, W. Kellerer, and E. Steinbach, “Quality-of-experience driven adaptive http media delivery,” in Proc. IEEE Int. Conf. on Communications (ICC), June 2013.
- [22] W. Zhang, Y. Wen, Z. Chen, and A. Khisti, “QoE-driven cache management for HTTP adaptive bit rate streaming over wireless networks,” IEEE Trans. on Multimedia, vol. 15, no. 6, pp. 1431–1445, Oct 2013.
- [23] L. Toni, R. Aparicio-Pardo, G. Simon, A. Blanc, and P. Frossard, “Optimal set of video representations in adaptive streaming,” in Proc. ACM Multimedia Systems Conference (MMSys), March 2014.
- [24] S. Basso, A. Servetti, E. Masala, and J. C. D. Martin, “Measuring dash streaming performance from the end users perspective using neubot,” in Proc. ACM Multimedia Systems Conference (MMSys), March 2014.
- [25] E. Nygren, R. K. Sitaraman, and J. Sun, “The Akamai network: a platform for high-performance internet applications,” Op. Sys. Rev., vol. 44, no. 3, pp. 2–19, 2010.
- [26] T. Hoff, “Gone fishin’: Justin.tv’s live video broadcasting architecture,” High Scalability blog, Nov. 2012. [Online]. Available: http://is.gd/5ocNz2
- [27] IBM, “Ilog cplex optimization studio.” [Online]. Available: http://is.gd/3GGOFp
- [28] Z. Ma, H. Hu, M. Xu, and Y. Wang, “Rate model for compressed video considering impacts of spatial, temporal and amplitude resolutions and its applications for video coding and adaptation,” ArXiv, vol. abs/1206.2625, 2012.
- [29] VQM, “Video quality research: Vqm software.” [Online]. Available: http://www.its.bldrdoc.gov/n3/video/vqmsoftware.htm
- [30] A. Besson, F. D. Simone, and T. Ebrahimi, “Objective quality metrics for video scalability,” in icip, Sept 2013.
- [31] C. E. Duchon, “Lanczos filtering in one and two dimensions,” Journal of Applied Meteorology, vol. 18, no. 8, pp. 1016–1022, 1979.
- [32] AviSynth, “: Avisynth wiki.” [Online]. Available: http://avisynth.nl/index.php/Resize
- [33] VLC, “: Videolan’s wiki.” [Online]. Available: https://wiki.videolan.org/VLC_command-line_help/
- [34] XIPH, “:xiph.org video test media.” [Online]. Available: http://media.xiph.org/video/derf/
- [35] J.-S. Lee, F. De Simone, T. Ebrahimi, N. Ramzan, and E. Izquierdo, “Quality assessment of multidimensional video scalability,” IEEE Commun. Mag., vol. 50, no. 4, pp. 38–46, April 2012.
- [36] Apple, “Best practices for creating and deploying HTTP live streaming media for the iphone and ipad.” [Online]. Available: http://is.gd/LBOdpz
- [37] M. Grafl, C. Timmerer, H. Hellwagner, W. Cherif, D. Negru, and S. Battista, “Combined bitrate suggestions for multi-rate streaming of industry solutions.” [Online]. Available: http://alicante.itec.aau.at/am1.html
- [38] V. K. Adhikari, Y. Guo, F. Hao, M. Varvello, V. Hilt, M. Steiner, and Z.-L. Zhang, “Unreeling netflix: Understanding and improving multi-CDN movie delivery,” in Proc. IEEE INFOCOM, 2012.