Measurement of net electric charge and dipole moment of dust aggregates in a complex plasma
Abstract
Understanding the agglomeration of dust particles in complex plasmas requires a knowledge of the basic properties such as the net electrostatic charge and dipole moment of the dust. In this study, dust aggregates are formed from gold coated mono-disperse spherical melamine-formaldehyde monomers in a radio-frequency (rf) argon discharge plasma. The behavior of observed dust aggregates is analyzed both by studying the particle trajectories and by employing computer models examining 3D structures of aggregates and their interactions and rotations as induced by torques arising from their dipole moments. These allow the basic characteristics of the dust aggregates, such as the electrostatic charge and dipole moment, to be determined. It is shown that the experimental results support the predicted values from computer models for aggregates in these environments.
pacs:
52.27.Lw; 52.58.Qv; 52.70.Nc; 52.70.DsI INTRODUCTION
The agglomeration of micron and sub-micron sized particles is a fundamental process that occurs over a range of environments. Dust plays a key role in the evolution of molecular clouds and the early stage of star and planet formation. The processes governing the evolution of the system are tied to the properties of the dust grains, such as the size distribution and porosity (fluffiness) of the aggregates 1a ; 1b . The formation of ice particles on dust grains in Earth”s upper atmosphere gives rise to unusual phenomena such as noctilucent clouds and localized electron depletions (“biteouts”) associated with these clouds 1c . These ice particles also reflect and absorb energy, influencing atmospheric dynamics 1d . Dust is also readily found in magnetic confinement fusion devices, which has consequences for the safety of fusion reactors as well as their operation and performance 1e . Additionally the coagulation of dust in plasma, following gas-phase nucleation, is a source of contamination in semiconductor processing 1f ; 1g .
In many of the environments mentioned above the dust is charged, either by being immersed in a radiative or plasma environment or through triboelectric charging. While the microphysics of the coagulation process is fundamental to all of these areas, it is not yet well understood. One of the reasons for this is due to the fact that a knowledge of the basic properties of the dust particles is required to better understand and explain these phenomena. The particle electrostatic charge and dipole moment are two of the most important parameters which help define the dusty plasma since they determine both the particle interactions with themselves as well as with the plasma particles and existing electromagnetic fields.
Grains in a plasma environment often attain charges sufficiently large that they are equally affected by local electrical and gravitational fields 4a ; 4b . One method for calculating the charge of isolated dust grains in a Maxwellian plasma is orbital-motion limited (OML) theory, which has been applied to spherical dust grains 4c ; 4d , cylindrical dust particles 4e and less symmetric isolated particles using a non-spherical probe 4f . The charge on non-isolated dust grains, where interactions between dust particles is taken into account, has also been investigated theoretically 4h . Measurement of the charge on dust grains in laboratory experiments has also been performed for both isolated 4i and non-isolated dust grains 4j . For most conditions experimental results agree fairly well with theoretical predictions.
Dust grains in astrophysical and laboratory plasmas are not necessarily spherically symmetric; the grains are typically elongated 4k ; 4l or aggregates consisting of many small subunits 4ka . It has been shown that aggregates in both laboratory and astrophysical environments tend to acquire more charge compared to spherical grains of the same mass due to their porous structure 4la ; 4lb ; 4lc ; 8b . A fluffy aggregate, consisting of many spherical monomers, has charge distributed over its irregular surface which leads to a nonzero dipole moment.
The electric charge and dipole moment of aggregates play a very important role in the coagulation process. An opposite charge polarity can lead to enhanced coagulation as a result of mutual electrostatic attraction 1c . However grains which are in a plasma environment usually obtain the same charge polarity. The coagulation of like-charged grains, while less efficient than the coagulation of oppositely-charged grains, may be enhanced if dipolar mechanisms 8ba such as charge-dipole interactions 4q ; 4r , which have been observed experimentally 4n and modeled numerically 4o or dipole-dipole interactions 4m ; 4ma , are taken into account.
It is evident that any proper explanation of agglomeration of dust particles requires a fundamental understanding of the electrostatic charge and dipole moment of dust aggregates. The electrostatic charge and dipole moment of individual particles in a cloud of spherical dielectric particles, dispersed in air passing through a non-uniform electric field, has been experimentally measured in 8c by studying the particles’ trajectories. In numerical studies, the electric charge and dipole moment of aggregates in a plasma environment has been calculated using modified theory 13 and the interaction between two charged grains modeled by calculating the torques and accelerations due to the charged aggregates or external electric fields 8a ; 8b . However a direct study of both electrostatic charge and dipole of dust particles in laboratory plasmas has not yet been made. In this study, we present a model for these complex plasma environments, where dust aggregates formed in a laboratory plasma and their basic properties are investigated. These results are then compared with an existing numerical model.
II EXPERIMENT
In this work all complex plasma experiments are performed in a modified GEC (Gaseous Electronics Conference) RF reference cell. The vacuum chamber has two electrodes, a lower cylindrical electrode driven at a frequency of 13.56 MHz and a hollow cylindrical upper electrode, which is grounded. Single gold-coated melamine formaldehyde (mf) spheres with diameter of 8.94 m, are introduced into the argon plasma from a shaker located above the upper electrode. The dust particles are confined inside an open-ended glass box placed on the lower electrode. See 9 for complete description of the experimental setup. The plasma is typically maintained at a RF peak-to-peak voltage of 80 V and a pressure of 500 mTorr, allowing the particles to form a stable cloud within the box. Using the same method as in 10 for creating the aggregates, the particles are accelerated by triggering self-excited dust density waves by rapidly decreasing the pressure to 50 mTorr. After several minutes the pressure is returned to the initial level, and aggregates consisting of up to 20 monomers are observed. Aggregates are backlit using a 500 W flood lamp and imaged using a CMOS monochromatic high speed camera (1024 FASTCAM Photron) at 3000 fps. To ensure that aggregates form within the focal plane of the camera and lens assembly, the glass box is placed off-center on the lower electrode, closer to the window where the camera is mounted. The recorded field of view spans an area of 717 m 829 m with a resolution of 1.4 m/pixel.
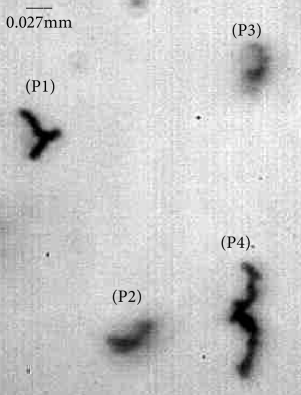
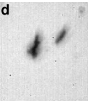
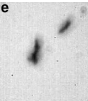
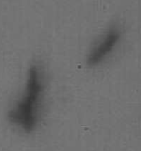
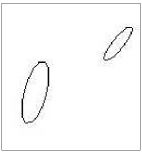
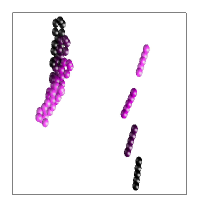
In the experiment, observed aggregates tend to be linear and elongated. Individual aggregates are often observed to rotate about the vertical z-axis, with a rotation period of approximately a few hundredths of a second. A representative sample of the aggregates observed is shown in Fig. 1. Aggregate rotation allows three-dimensional models to be reconstructed, as illustrated in Fig. 2. Interacting aggregate pairs exhibit rotation induced by their charge-dipole interactions as shown in Fig. 3.
III NUMERICAL MODEL
Two numerical codes are used to model the charging and interaction of the aggregates. The electric charge and dipole moment are calculated using , which is based on (orbital motion limited) theory modified to determine the open lines of sight () to points on the surface of the aggregate 13 . Electrons and ions in the plasma are incident to the surface along the open LOS, yielding a charge distribution over the aggregate surface. Assuming an electron temperature, K ( 2 eV), ion temperature, K, and m-3 where is the number density of electrons and is number density of ions, the total charge and dipole moment on each aggregate is calculated. Note that the values derived from () code are very sensitive to the number of monomers and their exact arrangements used to build up the 3D structure of the aggregates. The interaction between two charged grains including rotations induced by torques due to the charge dipole moments, is modeled using the code 14 .
.
IV ANALYSIS
In the experiment, the rate of change of the velocity for particles with mass and charge , was calculated using the equation of motion including gravity, , gas drag, , and the electrostatic force, , acting on the particle,
| (1) |
For weakly ionized plasmas, we consider only neutral gas drag since it dominates the ion drag 12 . The neutral drag force is given by the Epstein formula 12aa
| (2) |
where is the gas drag coefficient, which was experimentally determined to be = 9.8 s-1 for small mf aggregates in argon plasma at 500 mTorr using the same method as in 12a .
The electrostatic force arises from the interaction of dust particle with charge with the electric field from other dust grains, , the existing vertical electric field in the sheath above the lower electrode, , and a confining electric field in the horizontal direction arising from walls of the box, ,
| (3) |
The electric field produced by a charged particle can be expanded as
| (4) |
where is the electric dipole moment and is the vector displacement from the particle’s center of mass. The electric field is dominated by the leading non-vanishing term in , all the higher-order terms being negligible for calculating forces acting on the particles. It is important to note however that the electric dipole moment of the particles plays a very important role in determining the orientation of interacting particles.
The rotation of a particle is driven by the total torque acting on the dust particle. The angular acceleration of the particle is given by
| (5) |
where is angular momentum, is the moment of inertia of the aggregate, is the torque due to the electric field including , and , and is the torque due to the drag force, with being the perpendicular distance from the center of each monomer to the vertical axis about which the aggregate is rotating.
V RESULTS
For rotating aggregates, a sequence of image frames was analyzed using ImageJ 12b . A number of aggregates, almost fixed in place, spinning about the vertical z-axis with a nearly constant angular velocity were observed (Fig. 1). Two of the particles, and , which are in focus were examined using the 3D models shown in Fig. 2(h) and 2(p). The total charge on these rotating aggregates was estimated numerically using the code to be C and C, respectively. Since these aggregates show little horizontal translational motion, the gravitational force acting on the particles is assumed to be balanced by the electrostatic force due to the vertical electric field. The Debye length of the plasma is estimated to be about using the values of , , and provided by . The minimum distance between the rotating aggregates in the 2D images is measured to be mm which is larger than the calculated Debye length. Therefore it is reasonable to assume that is negligible between the particles. Using this fact, the magnitude of the vertical electric field, corresponding to the position of each aggregate is estimated to be V/m and V/m. The resulting electric field gradient is consistent with the results reported in 12baa .
Since the electrostatic force acts at the “center of charge” while gravity acts at the center of mass, the two forces exert an aligning torque, with any rotation about a horizontal axis damped by gas drag. Thus, rotation is about the vertical axis only. Using Eq. (5), the magnitude of the electric dipole moment can be calculated in the horizontal plane. The electric field which is responsible for this rotation is in the horizontal direction, , which is assumed to be the confining electric field created by the negative potential on the walls of the box. An estimation of the magnitude of this horizontal electric field using the same experimental set up is given in 12bb and taken to be V/m. As the observed particles are rotating with a constant angular velocity, the total torque applied on each particle due to this external electric field is balanced by the torque due to the drag force. Using this fact, the magnitude of the electric dipole moment in the horizontal plane is calculated to be Cm and Cm. These values are in very good agreement with the values predicted by , Cm and Cm. It is interesting to note that the value of the horizontal electric dipole moment for , which is observed to have no rotation during the measured time frame, is predicted to be Cm by . The very small value of the horizontal electric dipole moment could be one reason for the lack of rotation.
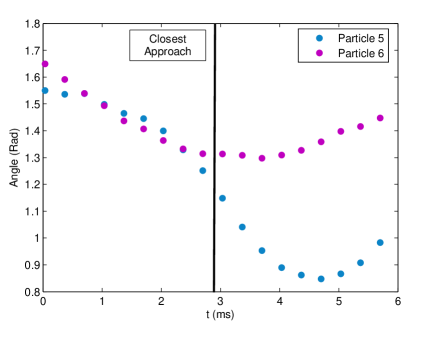
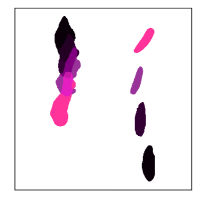
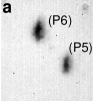
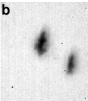
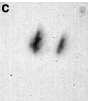
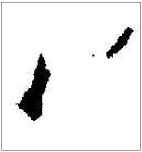
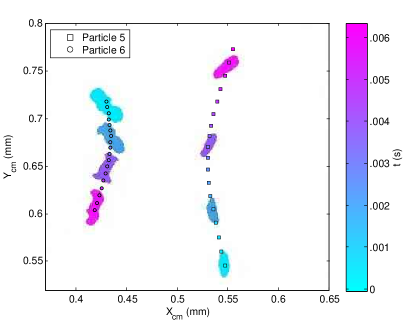
For the interacting aggregate pairs, a 30-frame sequence of images, showing a short interaction between two charged dust particles, and , was analyzed using ImageJ. As shown in Fig. 3, enters the frame from the lower right and enters the frame from the upper left. As they approach one another, their paths are deflected. ’s rotation about an axis perpendicular to the image plane is considerable. A pixel value threshold was set in the program to convert the gray-scale image into a binary image (Fig. 4(b)). The “Analyze Particles” function in ImageJ was then used to fit ellipses snugly around the particles detected as shown in Fig. 4(c) to determine the coordinates and orientations of all the particles in each frame. Fig. 5 shows the center of mass positions and for both particles as they change over time overlaid on four frames from the movie, with their orientation as a function of time shown in Fig. 6. A polynomial function was fit to the X- and Y-position data for each particle, with velocity and acceleration of the particles derived by differentiating this equation 12bbb .
The two vector-component equations from Eq. (1) for the two particles at the point of closest approach reduce to three independent equations with three unknown variables: , and , where is the net charge on and is the net charge on . Solving these equations yields , and in the downward direction.
The electric dipole moments of the dust grains are then calculated from the particles’ changing orientations during the interaction. The angular acceleration of each particle was calculated from the orientation, as shown in Fig. 6 using the values of charges and external electric field found in the previous step, and then substituting these values into Eq. (5). The electric dipole moments for each of the dust grains were found to be Cm and Cm.
Using reconstructed 3D models of P5 consisting of eight monomers and P6 consisting of sixteen monomers in , charges and electric dipole moments of aggregates were calculated as C and C with corresponding components of dipole moments as Cm and Cm. These values are in very good agreement with the values derived from experiment. The minor differences seen are assumed to arise from the sensitivity of the code to the number of monomers and their exact orientation in the constructed 3D aggregates.
The accuracy of the derived values are tested by modeling the dynamics of the interaction in . Fig. 7 compares the observed and the modeled interaction where charges and electric dipoles are those predicted by . Note that the trajectories of particles are sensitive to the interacting particles’ charges and electric dipole moments as well as their initial positions, velocities and orientations. The forces arising from the external electric fields are quite small compared to the Coulomb interaction between the aggregates and have a small impact on the particles’ trajectories.
VI CONCLUSIONS
Aggregates were formed from gold coated spherical melamine-formaldehyde monomers in a rf argon discharge plasma. The electrostatic charges and dipole moments of these aggregates were determined through analysis of the extracted particle trajectories and rotations and compared to the output of the numerical models. The excellent agreement between experiment and simulation validates the choice of underlying assumptions. For the numerical models, these include the simplifying assumptions that ions and electrons trajectories only impact the aggregate surface along open lines of sight and stick at the point of impact and that rotations of charged grains are induced by charge-dipole interactions. In deriving values from experiment, assumptions made were neglecting the ion drag force, considering a coulomb interaction between charged particles in order to calculate the force between them, and ignoring the gradient in and during the time of interaction for interacting pair particles. To the best of our knowledge, this is the first study designed to investigate dust aggregates with irregular shapes in order to evaluate the electrostatic charge and dipole moment. In previous works aggregates were simplified as spherical grains and many neglected the treatment of their electrostatic dipole moments. These measurements of the electrostatic charges and dipole moments are of importance in understanding the aggregation process, in dynamic simulations studying dust agglomeration where the charge and electric dipole moment play a very important role and determining the evolution of the grain-size distribution.
ACKNOWLEDGMENTS
This work is supported by the National Science Foundation under Grant No. 0847127.
References
- (1) A. Chokshi, A. G. G. M. Tielens and D. Hollenbach, ApJ. 407, 806 (1993).
- (2) C. W. Ormel, D. Paszum, C. Dominik and A. G. G. M. Tielens, Astronomy and Astrophysics. 502, 845 (2009).
- (3) G. C. Reid, Geophysical Research Lett. 24(9), 1095 (1997).
- (4) S. Shimizu et al., J. Geophys. Res. 115, D18205 (2010).
- (5) J. Winter, Physics of Plasmas 7(10), 3862 (2000).
- (6) A. Bouchoule and L. Boufendi, Plasma Sources Sci. Technol. 2, 204 (1993).
- (7) L. Boufendi and A. Bouchoule, Plasma Sources Sci. Technol. 3, 262 (1994).
- (8) D. A. Mendis, H. L. F. Houpis, and J. R. Hill, J. Geophys. Res. 87, 3449 (1982).
- (9) D. A. Mendis, J. R. Hill, and H. L. F. Houpis, J. Geophys. Res. 88, 929 (1983).
- (10) F. F. Chen, R. H. Huddlestone and S. L. Leonard (Eds.), Electric Probes in Plasma Diagnostic Techniques, Academic Press, New York (1965), Chapter 4.
- (11) J. E. Allen, Phys. Scr. 45, 497 (1992).
- (12) E. C. Whipple, Rep. Prog. Phys. 44, 1197 (1981).
- (13) J. G. Laframboise and L. W. Parker, Phys. Fluids 16, 629 (1973).
- (14) M. S. Barnes, J. H. Keller, J. C. Forster, J. A. O’Neill and D. K. Coultas , Phys. Rev. Lett. 68, 313 (1992).
- (15) B. Walch, M. Horanyi and S. Robertson, IEEE Trans. Plasma Sci. 22, 97 (1994).
- (16) A. Barkan, N. D’Angelo and R. L. Merlino, Phys. Rev. Lett. 73, 3093 (1994).
- (17) U. Mohideen, H. U. Rahman, M. A. Smith, M. Rosenberg and D. A. Mendis, Phys. Rev. Lett. 81, 349 (1998).
- (18) M. Harwit, Astrophysical Concepts, (Springer- Verlag, New York) P. 405 (1988).
- (19) J. M. Greenberg and J. I. Hage, ApJ. 361, 260 (1990).
- (20) R. Wiese, V. Sushkov, H. Kersten, V. R. Ikkurthi, R. Schneider and R. Hippler, New J. Phys. 12:033036 (2010).
- (21) M. Ilgner, AA, 538:A124 (2012).
- (22) S. Okuzumi, H. Tanaka, T. Takeuchi and M. Sakagami, ApJ. 731, 96 (2011).
- (23) Q. Ma, L. S. Matthews, V. Land and T. Hyde, ApJ. 763, 77 (2013).
- (24) J. Abrahamson and J. R. Marshall, J. Electrostat. 55 (1), 43 (2002).
- (25) G. Lapenta, Phys. Scr. 57, 476 (1998).
- (26) I. C. Simpson, S. Simons, and I. P. Williams, Astrophys. and Sp. Sci. 61, 65 (1979).
- (27) U. Konopka et al., New J. Phys. 7, 227 (2005).
- (28) L. S. Matthews and T. W. Hyde, IEEE Trans. Plasma Sci. 32, 586 (2004).
- (29) L. S. Matthews and T. W. Hyde, IEEE Trans. Plasma Sci. 36, 310 (2008).
- (30) J. R. Marshall, T. B. Sauke and J. N. Cuzzi, Geophysical Research Lett. 32, L11202 (2005).
- (31) P. Bagga, J. Abrahamson and J. Marshall, Advanced Powder Technology 20, 234 (2009).
- (32) L. S. Matthews, V. Land, and T. W. Hyde, ApJ. 744, 8 (2012).
- (33) L. S. Matthews, R. L. Hayes, M. S. Freed and T. Hyde, IEEE Trans. Plasma. Sci. 35, 260 (2007).
- (34) J. Kong, T. W. Hyde, L. Matthews, K. Qiao, Z. Zhang and A. Douglass, Phys. Rev. E. 84, 016411 (2011).
- (35) C. Du, H. M. Thomas, A. V. Ivlev, U. Konopka and G. E. Morfil, Phys. Plasmas 17, 113710 (2010).
- (36) L. S. Matthews, V. Land, Q. Ma, J. D. Perry and T. W. Hyde, AIP Conference Proceedings, vol. 1397, no. 1 (2011).
- (37) S. Khrapak and G. Morfill, Contrib. Plasma Phys. 49, 148 (2009).
- (38) P. Epstein, Phys. Rev. 23, 710 (1924).
- (39) J. Kong, T. W. Hyde, B. Harris, K. Qiao and J. C. Reyes, IEEE Trans. Plasma Sci. 37, 1620 (2009).
- (40) http://rsbweb.nih.gov/ij/
- (41) A. Douglass, V. Land, K. Qiao, L. S. Matthews and T. Hyde, Phys. Plasmas 19, 013707 (2012).
- (42) T. W. Hyde, J. Kong and L. S. Matthews, Phys. Rev. E. 87, 053106 (2013).
- (43) Z. Zhang, K. Qiao, J. Kong, L. Matthews and T. Hyde, Phys. Rev. E. 82, 036401 (2010).