3C 220.3: a radio galaxy lensing a submillimeter galaxy
Abstract
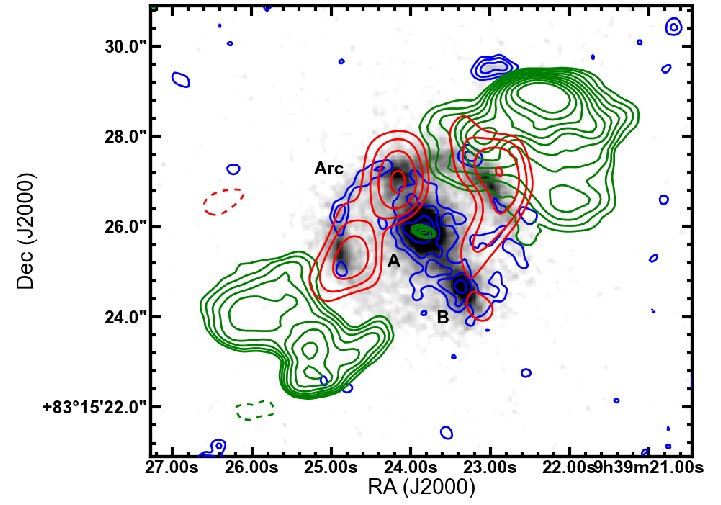
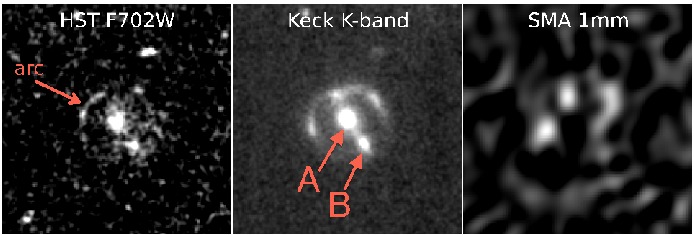
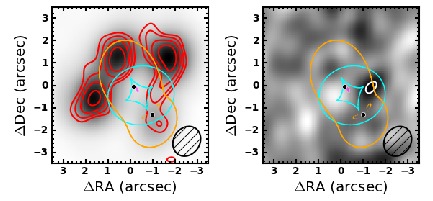
Herschel Space Observatory photometry and extensive multiwavelength followup have revealed that the powerful radio galaxy 3C 220.3 at acts as a gravitational lens for a background submillimeter galaxy (SMG) at . At an observed wavelength of 1 mm, the SMG is lensed into three distinct images. In the observed near infrared, these images are connected by an arc of 18 radius forming an Einstein half-ring centered near the radio galaxy. In visible light, only the arc is apparent. 3C 220.3 is the only known instance of strong galaxy-scale lensing by a powerful radio galaxy not located in a galaxy cluster and therefore it offers the potential to probe the dark matter content of the radio galaxy host. Lens modeling rejects a single lens, but two lenses centered on the radio galaxy host A and a companion B, separated by 15, provide a fit consistent with all data and reveal faint candidates for the predicted fourth and fifth images. The model does not require an extended common dark matter halo, consistent with the absence of extended bright X-ray emission on our Chandra image. The projected dark matter fractions within the Einstein radii of A (102) and B (061) are about 0.40.3 and 0.550.3. The mass to –band light ratios of A and B, , appear comparable to those of radio-quiet lensing galaxies at the same redshift in the CASTLES, LSD, and SL2S samples. The lensed SMG is extremely bright with observed mJy owing to a magnification factor . The SMG spectrum shows luminous, narrow C IV 1549 Å emission, revealing that the SMG houses a hidden quasar in addition to a violent starburst. Multicolor image reconstruction of the SMG indicates a bipolar morphology of the emitted ultraviolet (UV) light suggestive of cones through which UV light escapes a dust-enshrouded nucleus.
1 Introduction
Powerful radio galaxies (PRGs, with W Hz-1 sr-1 and Fanaroff-Riley morphology type FR II) mark places of exceptional energy transformation. Giant radio lobes far outside the massive host galaxies are powered by relativistic jets launched from accreting supermassive black holes in the galaxy centers. PRGs are among the most massive galaxies at their epoch, as traced by the – brightness–redshift diagram (Lilly & Longair 1984). In the cold dark matter paradigm of cosmic structure formation (White & Rees 1978), PRGs might be expected to reside in the most massive dark matter halos and in rich galaxy clusters. For a few PRGs in rich, X-ray-luminous clusters massive amounts of dark matter have been revealed by giant luminous arcs, e.g., 3C 220.1 at (Dickinson 1993) or by the weak shear of background galaxies, e.g., 3C 324 at (Smail & Dickinson 1995), both caused by cluster-scale gravitational lensing. However, for PRGs not in a cluster, no galaxy-scale gravitational lensing measurements of their dark matter content have been achieved to date.
This paper reports the first case of a lensing PRG not located in a galaxy cluster. As a bonus, the lensed source is a submillimeter galaxy (SMG). SMGs are dust-enshrouded star-forming galaxies at high redshift () and are thought to be the progenitors of today’s massive elliptical galaxies. Lensed examples of SMGs are not rare (Negrello et al. 2010), but a full picture of the population has yet to emerge.
Our discovery of the lensing nature of 3C 220.3 is based on far infrared and submillimeter photometry with the Herschel Space Observatory. The source appeared abnormally bright, suggesting contamination of a background source in the Herschel beam (5 – 35). Reprocessed archival Hubble Space Telescope (HST) visible (702 nm) images revealed an arc surrounding two objects, indicating that gravitational lensing plays a role. To identify the radio source among the two lensing candidate galaxies, we obtained a deep 3.3 cm radio map with the Karl G. Jansky Very Large Array (JVLA, 04 beam width). We performed high resolution imaging at 1.0 mm with the Submillimeter Array (SMA), near-infrared (NIR, -band, 2.124 m) adaptive optics (AO) imaging with the 10 m Keck II telescope, 3.6 and 4.5 m imaging with the Spitzer Space Telescope, 360–880 nm spectroscopy with the 5 m Palomar telescope, 320–1000 nm spectroscopy with the 10 m Keck I telescope, and obtained a 10 ks Chandra X-ray image.
This paper reports results of the imaging and spectroscopy campaigns (Section 2) and of lens modeling (Section 3) to fit the resulting data. Section 4 treats the wavelength dependent morphology of the SMG. Section 5 compares the derived mass to light () ratio for the PRG to ratios for galaxies at similar redshift, and Section 6 summarizes the results. We adopt a standard CDM cosmology ( km s-1 Mpc-1, , and ).
2 Observations and data
2.1 Herschel Space Observatory
Photometric observations of 3C 220.3 were carried out with the Herschel Space Observatory (Pilbratt et al. 2010) using the 70, 100, and 160 m channels of the instrument PACS (Poglitsch et al. 2010) on UT 2011 May 28 in scan-map mode with on-source time of 80 s at 70 and 100 m and 160 s at 160 m. SPIRE (Griffin et al. 2010) observations at 250, 350, and 500 m were made on UT 2012 November 5 in small-map mode with 111 s on-source time. Data reduction was performed within the Herschel Interactive Processing Environment (HIPE, Ott 2010) following standard procedures including source masking and high-pass filtering. Flux densities were measured for PACS with aperture photometry including corrections for aperture size. SPIRE photometry utilised the timeline source extractor implemented in HIPE. Because the source is bright in all filters, the photometric uncertainties are small, typically a few percent.
3C 220.3 was observed with the MIPS (Rieke et al. 2004) instrument on the Spitzer Space Telescope (Werner et al. 2004) with reported 70 and 160 m flux densities (Cleary et al. 2007) significantly lower than those from Herschel. To understand this discrepancy, we retrieved newly calibrated MIPS maps from the Spitzer archive and performed photometry with aperture corrections from the MIPS Instrument Handbook.111http://irsa.ipac.caltech.edu/data/SPITZER/docs/mips/ mipsinstrumenthandbook/50 The new 70 and 160 m Spitzer photometry yielded higher flux densities which now are consistent within 15% with the Herschel results. The Spitzer MIPS 24 m photometry agrees to within 4% with 22 m photometry from the Wide-field Infrared Survey Explorer (WISE, Wright et al. 2010).
For comparison with 3C 220.3, a sample of 12 PRGs was taken from the 3CR catalog. The sample (Westhues et al., in preparation) consists of galaxies with and radio and mid-infrared properties similar to those of 3C 220.3. The MIPS 24 m photometry of galaxies in the comparison sample is consistent with the WISE data.
2.2 Karl G. Jansky Very Large Array
The deepest radio image of 3C 220.3 to date, at = 6 cm by Mullin et al. (2006), shows the double-lobed morphology but not the unresolved core. With the aim of detecting the core, we observed 3C 220.3 with the Karl G. Jansky Very Large Array (JVLA) in its long-baseline A configuration on UT 2012 November 30 employing 25 antennae. The bandwidth was 2048 MHz centered at 9 GHz (X-band). Prime flux calibrators were 3C 48 and 3C 147, and the nearby radio source J1010+8250 served as phase calibrator. The total on-source integration time was 37 min.
2.3 Hubble Space Telescope
The HST archive contains two images of 3C 220.3 with WFPC2 in the broad band filter F702W taken on 1994 March 11 and 1995 May 19, each with an exposure time of 300 s. The reprocessed preview images now in the archive222 http://archive.stsci.edu/ clearly show an arc, which was not visible on the early map published by McCarthy et al. (1997).333McCarthy et al. (1997), reporting on early HST imaging of 3C radio galaxies, mentioned the possible association of 3C 220.3 with a gravitational arc, citing ”M. Dickinson, private communication”. While that claim now fortuitously turns out to have been correct, the comment was at the time meant to apply to 3C 220.1 (M. Dickinson, private communication). Dickinson has further confirmed that the ground-based imaging of 3C 220.3 available to him at that time was quite poor, and 3C 220.3 was one of the few targets omitted from his comprehensive 3C optical imaging survey (Dickinson 1994). The 3C 220.1 lensing arc is 9″ in radius, but the lens is an entire cluster (Ota et al. 2000, Comerford et al. 2006, Belsole et al. 2007). To improve the contrast further, we have retrieved, aligned, and coadded the two F702W images (Fig. 1), adjusting the positions of A and B to match those from the Keck AO (see Sect. 2.4).
Photometric calibration was derived by measuring the total 702 nm flux density in a circular aperture of 56 diameter, containing sources A and B and the entire arc, and scaling it to the total and band photometry of 3C 220.3 listed by the Sloan Digital Sky Survey (SDSS, Data Release 9)444http://www.sdss3.org/dr9/. The total magnitudes (in the AB system) are at 623 nm and at 764 nm, yielding the total 702 nm flux density listed in Table 1. The 702 nm flux densities of A and B separately are listed in Table 2.
2.4 Near-infrared imaging with Keck adaptive optics
The 3C 220.3 system was observed with the Keck II telescope on UT 2012 December 24 utilizing NIRC2 behind the adaptive optics bench. The laser guide star system was used in conjunction with an mag tip-tilt star located 23 from 3C 220.3. The wide camera was used, which provides a pixel scale of 00397 and a field of view of 40 on a side. We obtained nine dithered exposures in the band (2.124 m), each exposure consisting of four co-added frames of 30 s each.
The data were reduced using a Python pipeline that flat-fields the data, subtracts sky emission, aligns the images, and drizzles to create the final image. The last step corrects for distortions that create a non-uniform pixel scale. The final image (Fig. 1) used eight of the nine input images, giving a total exposure time of 960 s. The image center position was derived from three 2MASS point sources in the frame. With this astrometry, A is within 04 of the radio core position, and the final image coordinates were adjusted by this amount to match A to the radio core position (Fig. 1).
Photometric calibration was derived using an object (probably a compact galaxy) located on the Keck AO mosaic at RA = 09:39:34.18, Dec = +83:14:51.4 (J2000), and mag listed by 2MASS.
2.5 Spitzer/IRAC imaging
We observed 3C 220.3 on UT 2013 June 14 using the IRAC instrument (Fazio et al. 2004) of the Spitzer Space Telescope (Werner et al. 2004). Nine dithered exposures of 30 s each were secured at 3.6 m and at 4.5 m. The dithered images were combined and resampled to a pixel size of 03 using IRACproc (Schuster et al. 2006) and MOPEX.
3C 220.3 is clearly resolved at both 3.6 and 4.5 m. Approximate deconvolution gives full widths at half maximum surface brightness of 30 at 3.6 m and 34 at 4.5 m. These are comparable to the diameter of the Einstein ring (36). However, the limited angular resolution makes it not straightforward to distinguish the components seen on the KECK AO image, i.e., sources A and B and the knots and arc. The IRAC photometry of 3C 220.3 listed in Table 1 is consistent with that from WISE.
2.6 Submillimeter Array
SMA imaging of 3C 220.3 was obtained with Director’s Discretionary Time in the 2012B semester as part of program 2012B-S084. Observations were conducted in extended array configuration (maximum baseline length of 226 m) on UT 2013 January 11 in good weather conditions () for hours on-source integration time. Compact array observations (maximum baseline length of 76 m) were obtained on UT 2013 February 10, again in good weather conditions () for hours. Phase stability for both observing nights was good (phase errors between 10° and 20° rms). The SMA receivers provided 8 GHz of instantaneous bandwidth (considering both sidebands) and were tuned such that the upper sideband was centered on 302.927 GHz.
Calibration of the visibilities was performed using the Interactive Data Language (IDL) MIR package. The blazar 3C 84 was used as the primary bandpass calibrator and Titan for absolute flux calibration. The nearby quasars 0721+713 ( Jy, 136 from target) and 1048+717 ( Jy 120 from target) were used for phase and gain calibration. We checked the reliability of the phase-gain solutions using the quasar 1044+809 ( Jy, 32 from target).
The Multichannel Image Reconstruction, Image Analysis, and Display (MIRIAD) software package (Sault et al. 1995) was used to invert the visibilities and deconvolve the dirty map. Natural weighting was chosen to obtain maximum sensitivity and resulted in an elliptical Gaussian beam with a full-width half-maximum (FWHM) of 140117 and major axis position angle 146° east of north.
2.7 Visible Spectroscopy
2.7.1 Palomar
We observed 3C 220.3 for 1 hour using the Double Spectrograph on the Palomar 5 m Hale Telescope on UT 2013 February 12. The observations were obtained with three 1200 s exposures at a position angle of 31° and the 5500 Å dichroic, providing a wavelength coverage of 3200–8800 Å. Conditions were photometric, though the seeing was poor (2″). The observations used the 15-wide longslit, the 600/4000 blue grating (resolving power ), and the 600/10000 red grating (). We processed the data using standard techniques and flux calibrated the spectra using standard stars from Massey & Gronwall (1990) observed during the same night.
The Palomar observations failed to detect the arc but confirmed the redshift of 3C 220.3 at based on the detection of narrow C II] 2326, [O II] 3727, and [O III] 5007 emission lines, typical of powerful radio galaxies (McCarthy 1993, Stern et al. 1999). The only previously published redshift of 3C 220.3 to our knowledge was based on [O II] 3727 and [Ne V] 3346 emission with no figure available (Spinrad et al. 1985).555Jasper Wall kindly showed us a plot of another spectrum of 3C 220.3 taken with the 4 m William Herschel Telescope, La Palma, yielding based on a single emission line adopted to be [O II] 3727. This spectrum is mentioned at http://www-astro.physics.ox.ac.uk/sr/grimes.html. [Ne V] (redshifted to 5560Å) was not detected in our Palomar spectrum, likely owing to its proximity to the dichroic crossover.
2.7.2 Keck
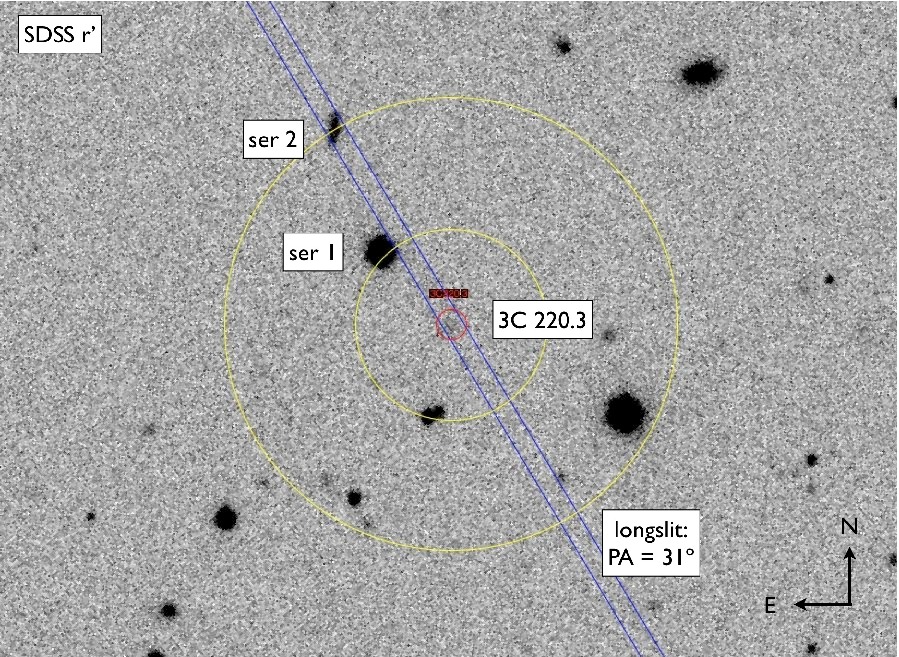
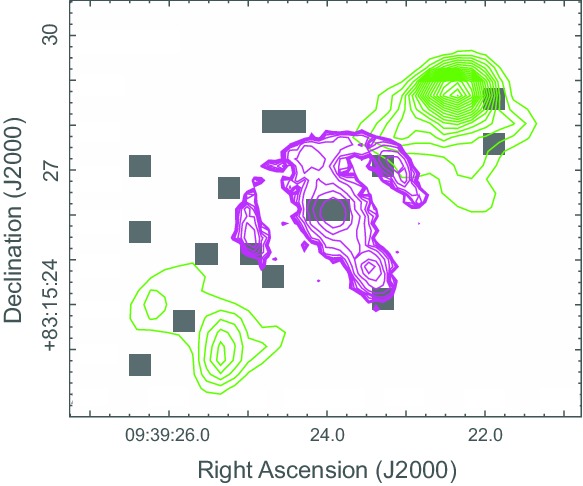
With the goal of measuring the arc redshift, we performed additional spectroscopy of 3C 220.3 with the Low Resolution Imaging Spectrometer (LRIS, Oke et al. 1995) at the Cassegrain focus of the Keck I telescope. We obtained three 1200 s observations at a position angle of 31∘. The observations used the 10-wide longslit, the 5600 Å dichroic, the 400/3400 blue grism (), and the 400/8500 red grating (). The position of the slit is illustrated in Fig. 2. Conditions were photometric with 15 seeing. We processed the data using standard techniques and flux calibrated the spectra using observations of G191-B2B, a standard star from Massey & Gronwall (1990), obtained during the same night.
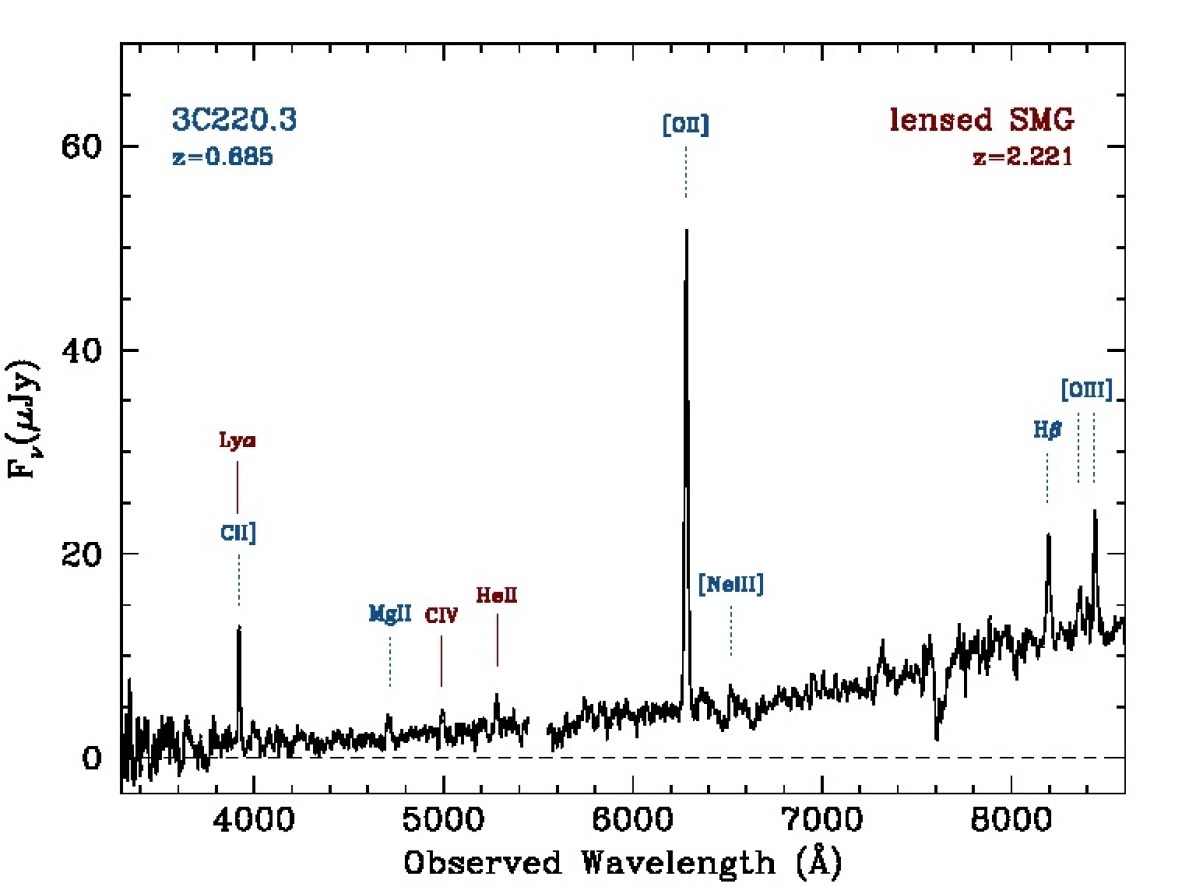
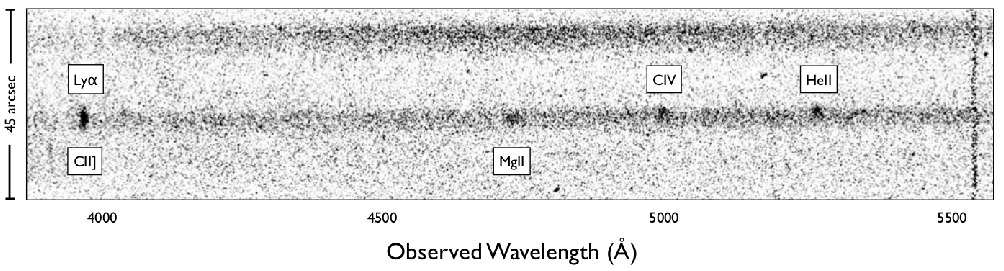
The Keck spectrum confirms the redshift of the radio galaxy, detecting the emission lines previously seen in the Palomar spectrum as well as weak, narrow [Mg II] 2800 and H emission (Fig. 3). More excitingly, the Keck spectrum reveals two additional narrow emission lines with a slight spatial offset from the primary continuum. These lines are associated with the arc (Fig. 4), and we identify the lines as C IV 1549 and He II 1640 at redshift . These lines are typical of radio galaxies and type-2 AGN, and the high C IV luminosity ( erg s-1) argues for a luminous AGN, i.e., a QSO (e.g., Stern et al. 2002).
In an odd coincidence, Ly for the lensed background source is shifted to observed 3916 Å, which coincides with C II] 2326 from the radio galaxy. The spatial location of this emission in the two-dimensional spectrum (Fig. 4) suggests that the emission at this wavelength predominantly coincides with the radio galaxy; Ly emission from the lensed, background SMG appears narrow and weak (e.g., relative to the C IV line for an average type-2 AGN), likely due to absorption and/or resonance scattering by the dust- and gas-rich SMG.
Examining the Keck spectra to uncover the redshift of source B provides a less certain result. The higher spectral dispersion red-arm data were binned spatially to 027 per pixel compared to 0135 per pixel for the blue arm. Based on both the [O II] 3727 and the H emission lines, it appears that source B is at nearly the same redshift as source A but blue-shifted by 5 Å (4 pixels).
2.8 Chandra X-ray Observations
3C 220.3 was observed with Chandra ACIS-S on UT 2013 January 21 for 10 ks. The total, broad-band (0.3-–8 keV) X-ray flux density of the system is erg cm-2 s-1, which yields a luminosity of erg s-1 if all photons originate at . The detection includes 16 photons (Fig. 5) with 1.8 expected from a smooth background. Photons are distributed across the system. It is not generally possible to identify the X-ray photons with specific structure(s), although 2 photons are aligned with the radio core (implying erg s-1). The observational upper limit of erg s-1 for extended, hot X-ray emitting gas is about a factor of ten below typical values for X-ray clusters (Pratt et al. 2009).
2.9 Spectral energy distribution
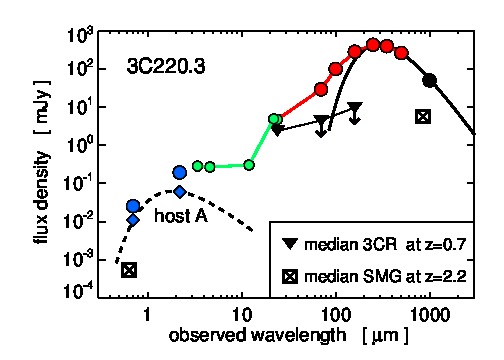
Figure 6 and Table 1 give the spectral energy distribution (SED) of the combined objects. The Herschel beam includes all flux from the SMG knots and arc and from the two lenses A and B, but the contributions of A and B are likely to be negligible. In the comparison sample of 12 Herschel-observed 3C objects, only three were detected with Herschel. Their SEDs peak at m with flux densities below 100 mJy and decline towards shorter and longer wavelengths. The remaining nine 3C radio galaxies are undetected at 70–160 m with upper limits well below the 3C 220.3 flux densities. Lens galaxy B is even less likely than A to contribute to the FIR flux density because it is 3 times fainter than A in the NIR and has a slightly bluer visible-NIR color (Table 2, and 4 for A and B, respectively). The small 70–160 m flux densities of the 12 comparison 3C objects and the non-detection of A and B at 1 mm imply that most of the 200 m flux comes from the SMG at .
The visible-to-850 m flux density ratio of the 3C 220.3 SMG is consistent with the median of 73 SMGs at (Chapman et al. 2005) (Fig. 6). The best-fit dust temperature K of the m dust emission (for a dust emissivity index and ) is typical for unlensed SMGs (Magnelli et al. 2012).666SED fitting with several dust components covering a range of temperatures does not result in a unique stable solution, but the temperature of the FIR-mm decline is a quite stable, widely used characteristic parameter. If the dust were associated with the radio source at , its temperature would be 20 K and its dust mass, , would be similar to the stellar mass, cooler and more massive than typically observed in AGN (30 K, ). Accounting for a total magnification factor derived from lens modeling (Sect. 3), the intrinsic (de-magnified) FIR luminosity of the SMG is L⊙.
3 Lens modeling
To derive the lens model of the 3C 220.3 system, we used the Keck AO image because it has higher signal-to-noise ratio and shows more details than the HST and SMA images (Fig. 1). The lens parameters derived from the Keck image were then used to model the HST and SMA images.
We first tried a model with a single lens centered on galaxy A, assuming object B is part of the lensed source. This failed because it leaves bright residuals at the B position. In other words, B is too bright relative to the other lensed features in the Keck image to be fully explained as part of the lensed image. Moreover, B is not seen in the SMA image. The (hypothetical) case that B is a low-luminosity foreground galaxy with mass too low to influence the lensing leaves bright residuals at the B position. The remaining possibility is that B is part of the lens. Therefore, our preferred model has two lenses centered on galaxies A and B.
3.1 Keck AO image
Lens models were derived from a fully Bayesian, grid-based modeling technique (Koopmans 2005, Vegetti & Koopmans 2009) that simultaneously solves for the parameters of the lensing galaxies and the surface brightness distribution of the background source . The Bayesian prior was expressed as the source regularization form with regularization level (Vegetti & Koopmans 2009). Because this prior is flat in and , the maximum of , that is the probability of the data given a lens mass model , determines the most probable a posteriori fit (see equation 35 of Vegetti & Koopmans 2009). The Bayesian approach takes into account the smoothness of the source via the regularization at the level (Suyu et al. 2006). For model fitting we have used the uncertainty map computed as the quadrature sum of the image read out noise and Poisson noise using the number of detected photons. Notably the fitting results are very similar (within a few percent) to those obtained when using a uniform uncertainty determined from clean background areas of the image.
To avoid that the model is affected by image pixels unrelated to the source, all model fitting was restricted to the ”smallest-possible” mask as shown in Fig. 7. The mask was set by smoothing the images, then making a S/N cut. This ensures that structure, that is present but below the noise level, is not cut off from the data. Thus, the mask is a compromise between being large enough to allow identification of possible extended residuals and being small enough to cover only the arc and the area around B, where the fourth counter-image is expected.
We here consider three scenarios. In case 1, object B is part of the lensed source; in case 2, B is a low-luminosity foreground galaxy with mass too small to influence the lensing; and in case 3, B is part of the lens. The lens modeling began with case 1, using a postage stamp image centered on the lens system but with the lensing galaxy (A) subtracted using analytic models. For cases 2 and 3 both galaxies (A and B) were subtracted. The surface brightness of the galaxies A and B is best fitted by PSF-convolved Sérsic (n1) profiles (and not by de Vaucouleurs profiles). Their parameters are listed in Table 2.
The lens mass distribution was modeled as an ellipsoid with a free power-law slope for the density profile. In general, such approximations provide good fits to describe the combined luminous and dark mass profiles (e.g., Treu & Koopmans 2004, Auger et al. 2009). The profiles were centered on the light distribution of A (or A and B), allowing for a small positional deviation. The parameters of the best fit single and double lens models are listed in Table 3.
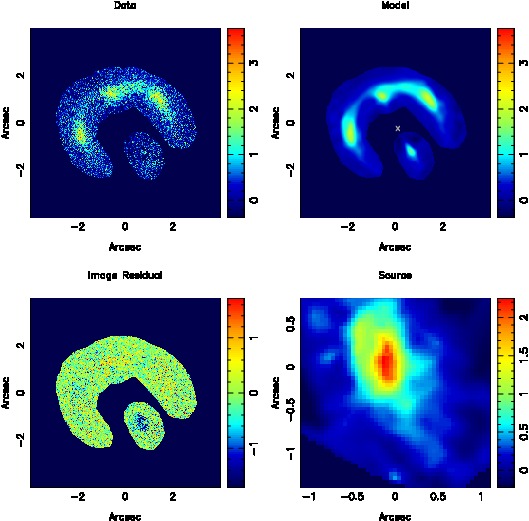
Case 1: Figure 7 shows that the positions of the three knots connected by the arc can roughly be fitted using the single lens A alone. However, the image residual (data minus model) contains not only a bright relict at the position of B but also negative features of the three knots and the arc (seen as blue arcs in the bottom left panel of Fig. 7). In other words, B is too bright relative to the other lensed features in the Keck image to be fully explained as part of the lensed image. In addition, the light profile of B is well fit by a smooth Sérsic profile that is unlike the complex structure of the three images along the arc, and finally the model requires the lensed source galaxy to be highly distorted. Overall case 1 is a poor fit to the data, and this is confirmed by the Bayesian evidence (Table 3).
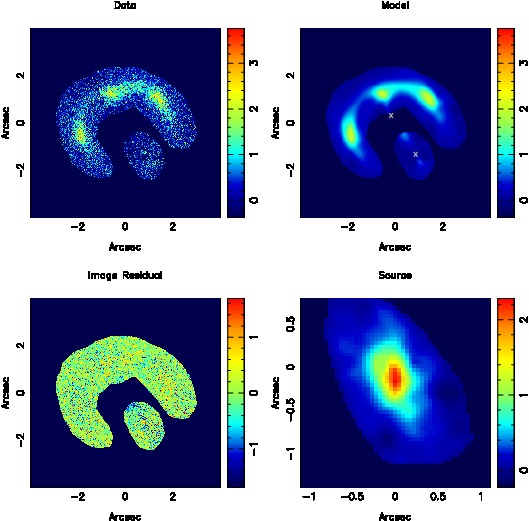
Case 2: Figure 8 shows that the three knots connected by the arc can be fitted, but there is a bright negative residual just at the B position because this model requires a counter-image of the arc having about 2/3 the flux of the three bright knots. Therefore, B should be seen in the SMA image, but it is not (Figs. 1 and 10). These discrepancies lead us to reject the single-lens model and consider B as part of the lens, consistent with its probable redshift (Sect. 2.7.2).
Case 3: Using two lenses significantly improves the modeling results.777The two-lens model includes the possibility that B is a lens but not necessarily at the same redshift as A, because any two-lens-plane system can be modeled to first order as a single lens plane with a rescaled Einstein radius (Keeton 2001). The Einstein radii are free parameters of the model, and therefore our results are independent of the true redshift of B. If its redshift is lower than assumed, its mass has to be higher, but all other model results are exactly the same. Figure 9 illustrates the consistency of the observed and modeled images and the featureless image residual all along the arc. The two-lens model predicts two additional faint images: a fourth image on the opposite side of the Einstein half-ring and a fifth (central) image. Their positions agree with two faint blobs in the Keck data after subtraction of a galaxy model for A and B and with faint features in the SMA map (Fig. 10). However, both images are close to the noise level and need to be confirmed with deeper optical/NIR data and a higher spatial resolution 1 mm map. The magnification factor of the two-lens model at 2.124 m is .
Visual inspection of the residual maps (data model, Figs. 7, 8 and 9) and the absence of B in the SMA image clearly favor the two-lens model. The statistical quantification (Table 3) agrees. The two-lens model has six extra free parameters allowing us to fit the data better. This is not an artifact of the higher number of free parameters, rather the Bayesian evidence automatically encodes Occam’s razor, and models with more free parameters are automatically penalized unless they are really required by the data. In essence, adding six extra parameters to the mass model improves the Bayesian evidence by , which corresponds to about 25- difference, and produces a source galaxy that looks “normal” (Fig. 9). If B were not important in the lensing, the model could have set its mass to zero, but this was not the result.888 We have used the Bayesian evidence to determine the best-fit lens model, but for comparison we also give here the more commonly used chi-square values. values were determined from the residual maps (data minus model) divided by the uncertainty map inside an area of 10912 pixels (Fig. 7) However when source plane pixels are regularised, it is not straightforward to calculate the number of degrees of freedom . The calculation here excludes the 50 50 source pixels in the computation of , which is therefore underestimated, thus overestimating the reduced . With 8 and 14 free parameters for the single- and two-lens models and 10898 respectively. The values of cases 1, 2, 3 are 14393, 12976, and 12642, respectively. With these underestimated , the values of cases 1, 2, 3 are 1.32, 1.19 and 1.16, respectively. In the limit of a large number of degrees of freedom, , has a standard deviation of , hence the values for case 2 and case 3 differ at the 2- level and are about 10 away from unity. The statistic suggests that either a more complex lens model may be needed, or more likely that has been underestimated, or that the noise map is underestimated by about 5-10%, which could quite easily be the case.
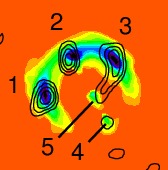
Both the single and double lens models require an external shear of 0.1 for lens A (Table 3), suggesting the presence of additional lensing components. While the marginally visible knot 5 (Fig. 10) could be the fifth central image, alternatively it could be a third lensing galaxy C. We checked for this posibility, running a lens model with three lenses centered on A, B and C. While C is still produced by the modeling as an extra image, a bit of mass is removed from B to C (Einstein radius of C = 0030), and the shear of lens A remains (=0.092). Also, the Bayesian evidence for the three lens model is poorer than for the two-lens model, and we do not use the three lens model further. Section 5 discusses the implications of the shear.
3.2 HST image
Figure 11 shows the results of applying the double lens model to the HST image. The image residuals are featureless, supporting the adequacy of the model.
3.3 SMA image
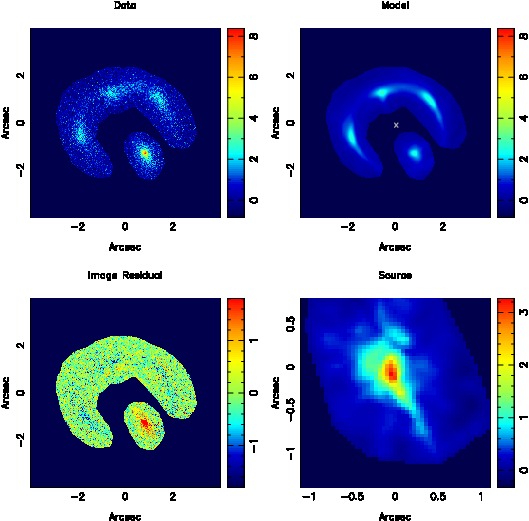
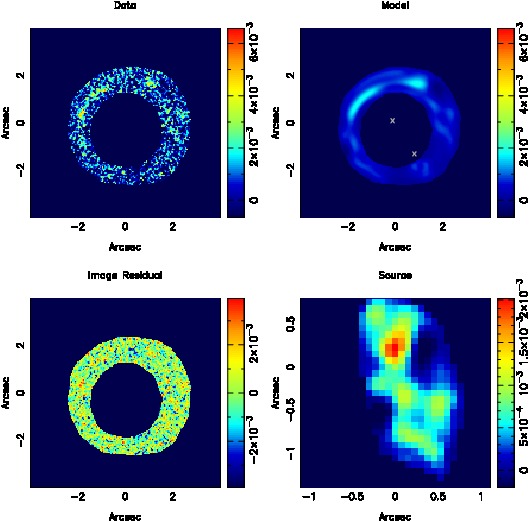
For interferometers such as the SMA, proper lens modeling requires the use of visibilities in the Fourier domain rather than surface brightness maps. We followed the technique outlined by Bussmann et al. (2012). Using the Gravlens software999http://redfive.rutgers.edu/keeton/gravlens/, we ray-traced the emission in the source plane to the image plane for a given lensing mass distribution and source morphology. This image plane surface brightness map was then used as input to MIRIAD’s uvmodel task, which computes the Fourier transform of an image and matches the resulting visibilities to the sampling of the observed SMA visibility dataset. We used the emcee software package (for details, see Foreman-Mackey et al. 2013) to perform a Markov chain Monte Carlo sampling of the posterior probability density function (PDF) of our model parameters.
We modeled the SMA data using the lens parameters of the two–lens model derived from the Keck AO data (Table 3) and a Sérsic profile to represent the morphology of the SMG in the source plane. The SMA data (having lower spatial resolution than the KECK AO data) do not justify a more complex model. The best-fit source has a Sérsic index , half-light radius , axis ratio , and .
The best-fit result is shown in Figure 12. Because the model fitting is performed in the Fourier domain and then transformed to the image domain, small residuals in the image domain are not surprising. Modeling the SMA data with and without shear results in equally good fits. The magnification factor at 1 mm is .
4 Reconstructed SMG morphologies
The difference in the observed morphologies of the SMG at observed visible, NIR, and mm wavelengths (Fig. 1) corresponds to morphological differences in the source at the respective restframe wavelengths. Fig. 13 shows the multi-color image of the SMG in the source plane as reconstructed from the modeling. Within astrometric errors, the peak of the dust emission (SMA 310 m restframe) coincides with the stellar light (Keck 680 nm restframe). However, compared to the main galaxy body of stars and dust, the bulk of the UV (218 nm restframe) emission is shifted by 4 kpc (metric distance at the source) towards the north. Marginal UV emission is also recognisable 4 kpc south of the galaxy body (Fig. 13, and bottom right panel of Fig. 11). These extended regions lie closer to the critical curves of the lens model and may be somewhat more magnified than the center of the stellar emission. However, if a strong UV nucleus were present within the compact dust emission, it should be visible in the observed HST image as bright knots similar to those in the SMA image. The HST image shows only the arc.
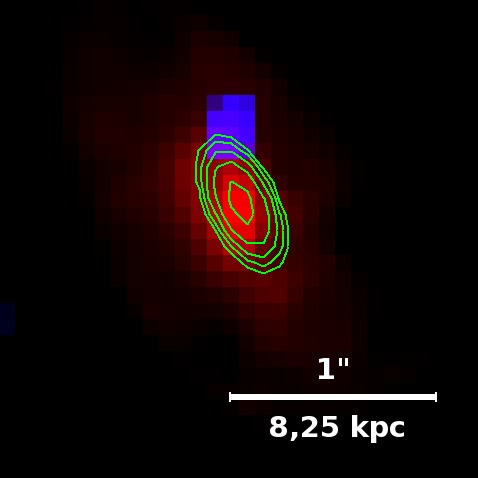
The offset of the UV emission from the galaxy body of the SMG suggests that the AGN responsible for the high excitation emission lines is located in the galaxy center but hidden from direct view at UV wavelengths. The (apparent) bipolar morphology of the UV emission is reminiscent of the ionisation cones seen in the nearby starburst galaxy M82 (Fig. 3.108 of Gil de Paz et al. 2007), in Seyfert galaxies (Schmitt et al. 2003), and in high redshift quasars (e.g., Cano-Díaz et al. 2012). One interpretation is that the SMG is breaking up its dust cocoon so that UV radiation from the obscured central region escapes through the opened channels and is scattered towards us.
A luminous AGN breaking up its dust cocoon is one interpretation of the so-called alignment effect in powerful radio galaxies at high redshift (Chambers et al. 1987, McCarthy et al. 1987). In those cases, the breakup is apparently caused by the high-energy particles that create the radio lobes. In contrast to such radio galaxies, the JVLA radio map of 3C 220.3 shows no indication for powerful radio activity in the SMG, either at the known position of lensed features (the arc and the three knots) or from extended lobes, which would be expected to be aligned with the UV emission (approximately north–south). While starburst winds may be able to blow holes into the dust cocoon of the SMG and to expel part of the gas (Tenorio-Tagle & Munoz-Tunon 1998), a wind from the hidden QSO may be more likely to be forming the open channels. Regardless of the mechanism, the in-progress breakup of the dust cocoon makes the 3C 220.3 SMG an excellent lensed laboratory to explore, with brightness magnification and at higher spatial resolution than possible for unlensed systems, the properties of a dust-enshrouded AGN at high redshift and its feedback on the star forming activity in the host.
5 The mass-to-light ratio of 3C 220.3
The double lens model (Table 3) gives total – baryonic and dark – masses for the lensing galaxies A and B. The calculated masses are M⊙ inside a cylinder of Einstein radius ( kpc at ), and M⊙ ( kpc). The statistical uncertainties (Table 3), as determined from the model residuals, do not account for possible systematic effects.
One systematic effect for the mass estimates is that the best-fit model requires an external shear of 0.1 for lens A (Table 3), suggesting the presence of additional lensing components. This may be consistent with the presence of the 2 residuals of modeling the SMA image (Fig. 12). In principle, such a component could be a dark matter halo encompassing A and B. On the other hand, our Chandra image shows no extended X-ray cluster gas (Fig. 5), arguing against explaining the shear by a common dark matter halo. More likely is that 3C 220.3 is located in a small group with one or more faint galaxies having escaped detection on our images so far (possibly masked by the lensed structures). A similar situation was reported for the gravitational lens CLASS B2045+265, where the initially inferred high mass-to-light ratio was reduced by a group of faint lensing satellites (Fassnacht et al. 1999, McKean et al. 2007). Therefore we consider the masses and as upper limits.101010 The single lens model of 3C 220.3 yields , which is a factor two higher than the sum of and in the two–component lens model. If the shear of the two component lens model is due to further not yet identified lensing galaxies, the mass sum may be reduced further.
To estimate the luminous mass of galaxies A and B inside the Einstein radius, only two filters (Table 2) provide adequate data. (The spectra show no stellar features.) Using the Starburst99 tool Version 6.0.4 (Leitherer et al. 1999)111111http://www.stsci.edu/science/starburst99/docs/default.htm and adopting a dominant old stellar population typical for radio galaxy hosts (age 3 Gyr and Salpeter IMF), we obtain stellar masses M⊙, and M⊙. The uncertainty of these estimates is about a factor of two, dominated by uncertainties in the photometry of A and B inside the Einstein radius (especially from the noisy HST image) and the unknown age of the stellar population. With these numbers, the ratio of dark-to-luminous mass (projected within the Einstein radius) lies in the range between 0.7 and 1.2, i.e., dark matter fractions of about 40% and 55% with large uncertainties (30%).
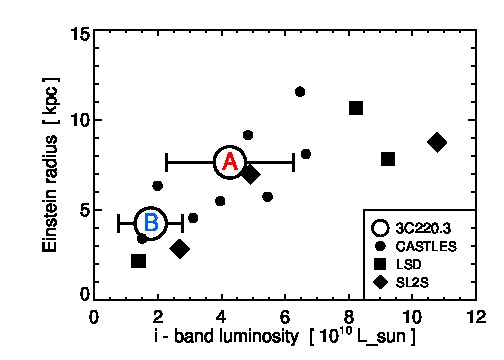
To check whether the radio galaxy 3C 220.3 is associated with an usually high amount of dark matter, suitable comparison data are required. A proper comparison sample should contain field galaxies of stellar mass and redshift similar to 3C 220.3. The best existing comparison samples are the CfA-Arizona Space Telescope LEns Survey of gravitational lenses (CASTLES121212Kochanek et al., http://www.cfa.harvard.edu/castles e.g., Lehár et al. 2000) and a few objects in the the Lenses Structure and Dynamics survey (LSD, Treu & Koopmans 2004) and the Strong Lenses in the Legacy Survey (SL2S, Ruff et al. 2011). Figure 14 shows the Einstein radius (converted to kpc) versus the -band luminosity of the CASTLES, LSD, and SL2S lensing galaxies in the redshift range , comparable to the redshift of 3C 220.3, and having lensed source redshift to ensure that it is sufficiently far from the lens. The -band luminosities of 3C 220.3 A and B were derived by interpolation of the HST and Keck photometry (Table 2). Assuming the Einstein radius traces total mass, the mass-to-light ratio of 3C 220.3 A and B, , is comparable to that of the CASTLES, LSD, and SL2S lenses, perhaps at the high end of their distribution. LSD and SL2S list dark matter fractions in the range (projected within the Einstein radius), encompassing the value of 3C 220.3.
6 Conclusions
The exceptional 3C 220.3 gravitational lensing system consists of a SMG (hosting a dust-enshrouded type-2 QSO) which is lensed by a powerful radio galaxy, i.e., a radio-loud type-2 quasar. The system permits determination of the total galaxy-scale mass for a powerful double-lobed radio galaxy that is not in a rich galaxy cluster. Comparison with available galaxy-scale lenses indicates an average to moderately high dark matter fraction, but the comparison with radio-quiet galaxies needs to be confirmed with future lens samples near the redshift of 3C 220.3. Further observations of 3C 220.3 with increased will allow a more accurate lens model, give a better stellar mass measurement for the lenses, and allow a more detailed reconstruction of the SMG morphology. They should also clarify whether other galaxies important to the lensing, as for example in a small group, exist.
The SMG fits the paradigm of a composite AGN/starburst galaxy in the early Universe. The available data indicate the breakup of the dust cocoon, which represents a fundamental transition phase in a violently star-forming galaxy. Deeper X-ray observations and (sub)-mm spectroscopy, both possible at high spatial resolution, will allow exploration of the break-up process and the kinematics of any related outflows in a high-redshift starburst-AGN.
References
- Auger et al. (2009) Auger, M. W., Treu, T., Bolton, A. S., et al. 2009, ApJ, 705, 1099
- Belsole et al. (2007) Belsole, E., Worrall, D. M., Hardcastle, M. J., & Croston, J. H. 2007, MNRAS, 381, 1109
- Bussmann et al. (2012) Bussmann, R. S., Gurwell, M. A., Fu, H., et al. 2012, ApJ, 756, 134
- Cano-Díaz et al. (2012) Cano-Díaz, M., Maiolino, R., Marconi, A., et al. 2012, A&A, 537, L8
- Chambers et al. (1987) Chambers, K. C., Miley, G. K., & van Breugel, W. 1987, Nature, 329, 604
- Chapman et al. (2005) Chapman, S. C., Blain, A. W., Smail, I., & Ivison, R. J. 2005, ApJ, 622, 772
- Cleary et al. (2007) Cleary, K., Lawrence, C. R., Marshall, J. A., Hao, L., & Meier, D. 2007, ApJ, 660, 117
- Comerford et al. (2006) Comerford, J. M., Meneghetti, M., Bartelmann, M., & Schirmer, M. 2006, ApJ, 642, 39
- Dickinson (1993) Dickinson, M. 1993, in Astronomical Society of the Pacific Conference Series, Vol. 51, Observational Cosmology, ed. G. L. Chincarini, A. Iovino, T. Maccacaro, & D. Maccagni, 434
- Dickinson (1994) Dickinson, M. E. 1994, PhD thesis, UNIVERSITY OF CALIFORNIA, BERKELEY.
- Fassnacht et al. (1999) Fassnacht, C. D., Blandford, R. D., Cohen, J. G., et al. 1999, AJ, 117, 658
- Fazio et al. (2004) Fazio, G. G., Hora, J. L., Allen, L. E., et al. 2004, ApJS, 154, 10
- Foreman-Mackey et al. (2013) Foreman-Mackey, D., Hogg, D. W., Lang, D., & Goodman, J. 2013, PASP, 125, 306
- Gil de Paz et al. (2007) Gil de Paz, A., Boissier, S., Madore, B. F., et al. 2007, ApJS, 173, 185
- Griffin et al. (2010) Griffin, M. J., Abergel, A., Abreu, A., et al. 2010, A&A, 518, L3
- Keeton (2001) Keeton, C. R. 2001, ApJ, 561, 46
- Koopmans (2005) Koopmans, L. V. E. 2005, MNRAS, 363, 1136
- Lehár et al. (2000) Lehár, J., Falco, E. E., Kochanek, C. S., et al. 2000, ApJ, 536, 584
- Leitherer et al. (1999) Leitherer, C., Schaerer, D., Goldader, J. D., et al. 1999, ApJS, 123, 3
- Lilly & Longair (1984) Lilly, S. J., & Longair, M. S. 1984, MNRAS, 211, 833
- Magnelli et al. (2012) Magnelli, B., Lutz, D., Santini, P., et al. 2012, A&A, 539, A155
- Massey & Gronwall (1990) Massey, P., & Gronwall, C. 1990, ApJ, 358, 344
- McCarthy (1993) McCarthy, P. J. 1993, ARA&A, 31, 639
- McCarthy et al. (1997) McCarthy, P. J., Miley, G. K., de Koff, S., et al. 1997, ApJS, 112, 415
- McCarthy et al. (1987) McCarthy, P. J., van Breugel, W., Spinrad, H., & Djorgovski, S. 1987, ApJ, 321, L29
- McKean et al. (2007) McKean, J. P., Koopmans, L. V. E., Flack, C. E., et al. 2007, MNRAS, 378, 109
- Mullin et al. (2006) Mullin, L. M., Hardcastle, M. J., & Riley, J. M. 2006, MNRAS, 372, 113
- Negrello et al. (2010) Negrello, M., Hopwood, R., De Zotti, G., et al. 2010, Science, 330, 800
- Oke et al. (1995) Oke, J. B., Cohen, J. G., Carr, M., et al. 1995, PASP, 107, 375
- Ota et al. (2000) Ota, N., Mitsuda, K., Hattori, M., & Mihara, T. 2000, ApJ, 530, 172
- Ott (2010) Ott, S. 2010, in Astronomical Society of the Pacific Conference Series, Vol. 434, Astronomical Data Analysis Software and Systems XIX, ed. Y. Mizumoto, K.-I. Morita, & M. Ohishi, 139
- Pilbratt et al. (2010) Pilbratt, G. L., Riedinger, J. R., Passvogel, T., et al. 2010, A&A, 518, L1
- Poglitsch et al. (2010) Poglitsch, A., Waelkens, C., Geis, N., et al. 2010, A&A, 518, L2
- Pratt et al. (2009) Pratt, G. W., Croston, J. H., Arnaud, M., & Böhringer, H. 2009, A&A, 498, 361
- Rieke et al. (2004) Rieke, G. H., Young, E. T., Engelbracht, C. W., et al. 2004, ApJS, 154, 25
- Ruff et al. (2011) Ruff, A. J., Gavazzi, R., Marshall, P. J., et al. 2011, ApJ, 727, 96
- Sault et al. (1995) Sault, R. J., Teuben, P. J., & Wright, M. C. H. 1995, in Astronomical Society of the Pacific Conference Series, Vol. 77, Astronomical Data Analysis Software and Systems IV, ed. R. A. Shaw, H. E. Payne, & J. J. E. Hayes, 433
- Schmitt et al. (2003) Schmitt, H. R., Donley, J. L., Antonucci, R. R. J., Hutchings, J. B., & Kinney, A. L. 2003, ApJS, 148, 327
- Schuster et al. (2006) Schuster, M. T., Marengo, M., & Patten, B. M. 2006, in Society of Photo-Optical Instrumentation Engineers (SPIE) Conference Series, Vol. 6270, Society of Photo-Optical Instrumentation Engineers (SPIE) Conference Series
- Smail & Dickinson (1995) Smail, I., & Dickinson, M. 1995, ApJ, 455, L99
- Spinrad et al. (1985) Spinrad, H., Marr, J., Aguilar, L., & Djorgovski, S. 1985, PASP, 97, 932
- Stern et al. (1999) Stern, D., Dey, A., Spinrad, H., et al. 1999, AJ, 117, 1122
- Stern et al. (2002) Stern, D., Moran, E. C., Coil, A. L., et al. 2002, ApJ, 568, 71
- Suyu et al. (2006) Suyu, S. H., Marshall, P. J., Hobson, M. P., & Blandford, R. D. 2006, MNRAS, 371, 983
- Tenorio-Tagle & Munoz-Tunon (1998) Tenorio-Tagle, G., & Munoz-Tunon, C. 1998, MNRAS, 293, 299
- Treu & Koopmans (2004) Treu, T., & Koopmans, L. V. E. 2004, ApJ, 611, 739
- Vegetti & Koopmans (2009) Vegetti, S., & Koopmans, L. V. E. 2009, MNRAS, 392, 945
- Werner et al. (2004) Werner, M. W., Roellig, T. L., Low, F. J., et al. 2004, ApJS, 154, 1
- White & Rees (1978) White, S. D. M., & Rees, M. J. 1978, MNRAS, 183, 341
- Wright et al. (2010) Wright, E. L., Eisenhardt, P. R. M., Mainzer, A. K., et al. 2010, AJ, 140, 1868
| observed wavelength | flux density | |
|---|---|---|
| m | mJy | |
| 0.702 | 0.0253 | 0.00 |
| 2.124 | 0.193 | 0.03 |
| 3.6 | 0.275 | 0.028 |
| 4.5 | 0.283 | 0.028 |
| 70. | 29.5 | 5 |
| 100. | 102 | 7 |
| 160. | 289 | 9 |
| 250. | 440 | 15 |
| 350. | 403 | 20 |
| 500. | 268 | 30 |
| 1000. | 51 | 12 |
| Lens | 702 nm | 2.124 m | Sérsic Index | axis ratio | PA [deg] | |
|---|---|---|---|---|---|---|
| A | 14.8 3.5 | 76.7 15.0 | 0.9 0.09 | 0.29 0.04 | 0.7 0.07 | 29 12 |
| B | 4.45 1.1 | 20.0 3.0 | 1.0 0.12 | 0.20 0.04 | 0.6 0.11 | 31 25 |
| (1) | (2) | (3) | (4) | (5) | (6) | (7) | (8) | (9) | (10) |
|---|---|---|---|---|---|---|---|---|---|
| Lens | Einstein | Lens position | PA | slope | Shear | Shear | Lens mass | ln Ev | |
| radius [] | [] | deg | s | strength | PA [deg] | 1011 M⊙ | |||
| single lens, case 1 | -10341 | ||||||||
| A | 1.67 | 0.043, -0.183 | 0.61 | 38.7 | 2.071 | 0.093 | 5.4 | 8.9 | |
| unc A | 0.09 | 0.007, 0.010 | 0.10 | 8 | 0.140 | 0.031 | 20 | 1.1 | |
| single lens, case 2 | -9660 | ||||||||
| A | 1.68 | 0.113, -0.324 | 0.27 | 30.8 | 2.310 | 0.146 | 13.3 | 9.0 | |
| unc A | 0.08 | 0.013, 0.028 | 0.16 | 12 | 0.230 | 0.029 | 24 | 1.0 | |
| double lens, case 3 | -9409 | ||||||||
| A | 1.02 | -0.174, 0.223 | 0.61 | 35.7 | 1.837 | 0.098 | 5.0 | 3.5 | |
| unc A | 0.07 | 0.010, 0.010 | 0.13 | 10 | 0.090 | 0.030 | 23 | 0.5 | |
| B | 0.61 | 0.861, -1.415 | 0.74 | 42.1 | 1.964 | 1.2 | |||
| unc B | 0.05 | 0.007, 0.008 | 0.12 | 15 | 0.150 | 0.2 |