Radiation background with the CMS RPCs at the LHC
Abstract
The Resistive Plate Chambers (RPCs) are employed in the CMS experiment at the LHC as dedicated trigger system both in the barrel and in the endcap. This note presents results of the radiation background measurements performed with the 2011 and 2012 proton-proton collision data collected by CMS. Emphasis is given to the measurements of the background distribution inside the RPCs. The expected background rates during the future running of the LHC are estimated both from extrapolated measurements and from simulation.
keywords:
Resistive Plate Chambers (RPCs); Radiation Background; Rates; CMS; LHC1 Introduction
Three years (2010-2012) of proton-proton (pp) running at the Large Hadron Collider (LHC) have provided the opportunity to extensively study the radiation background and therefore to obtain a very detailed knowledge of the background distribution in the Muon system of the Compact Muon Solenoid (CMS) [1, 2] detector. The measurements presented in this note have been performed with 2011 and 2012 runs of proton-proton collisions at a center-of-mass energy of 7 TeV, and at 8 TeV, respectively, The maximal instantaneous luminosity reached cm-2 s-1 in 2012. Previous results with CMS 2010 data at 7 TeV are reported in [3].
Background studies play a decisive role with respect to the performance of the existing detector, as well as to the design of the upgraded Muon system for the High Luminosity running of the LHC (HL-LHC). In general, background radiation levels are an important consideration in the overall performance of the Muon system, and are carefully monitored. Any background source, including low energy neutrons or photons, electrons and positrons, punch-through hadrons, low momentum primary and secondary muons, and beam-induced background (particles produced in the interaction of the beams with collimators, residual gas, and beam pipe components), could affect the muon trigger performance and pattern recognition of muon tracks. In particular, spurious hits due to noise or to radiation background could promote low transverse-momentum muons to higher momentum. In addition, excessive radiation levels can cause aging of the detectors. Furthermore, the expected radiation levels during the HL-LHC can contribute to drive the choice of the most suitable technology for the detector upgrade. Reliable estimates of the expected hit rates are therefore essential.
2 The CMS RPCs at the LHC
CMS is one of the six experiments currently operating at the LHC. The central feature of the general-purpose CMS detector is a superconducting solenoid, of 6 m internal diameter, providing a field of 3.8 T. Muons with pseudorapidity in the range are measured in gas-ionization detectors embedded in the steel return yoke, with detection planes made of three technologies: Drift Tube (DT) chambers, Cathode Strip Chambers (CSC) and Resistive Plate Chambers (RPC).
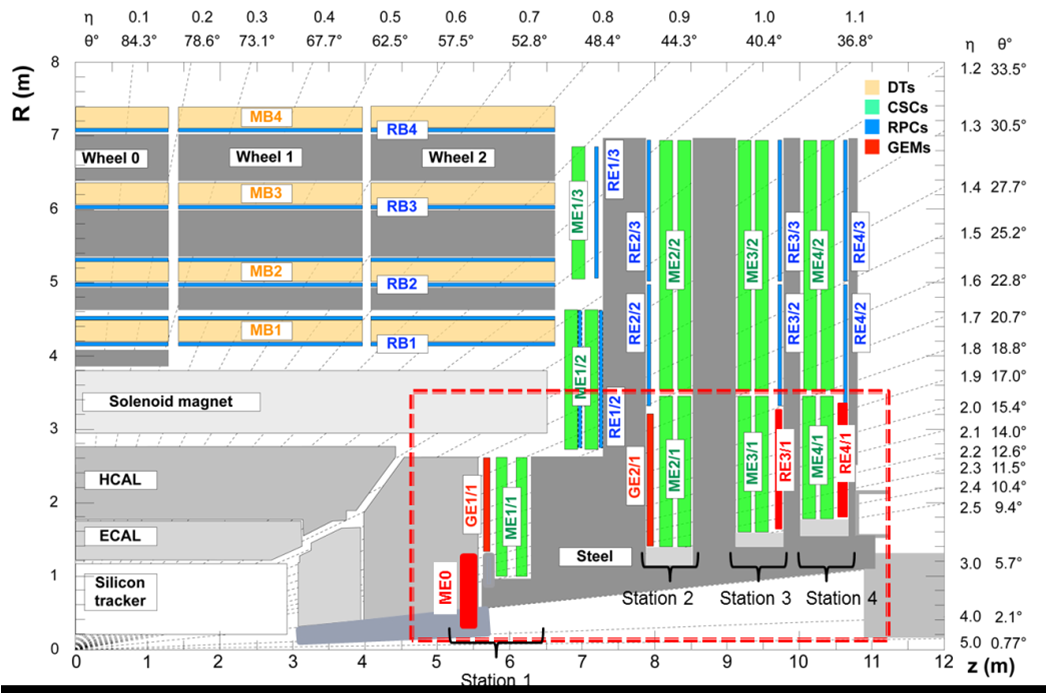
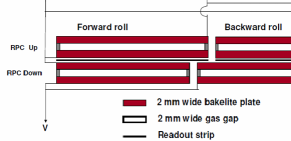
The RPC [4, 5] detectors are implemented in CMS as a dedicated trigger system, in both the barrel and the endcap regions. Figure 1 shows a schematic view of one quarter of the CMS detector in the R-z plane (Fig. 1, left) and the layout of a double-gap barrel chamber (Fig. 1, right). Two gas gaps, of 2 mm each, are formed by two parallel phenolic-melaminic laminate (bakelite) electrodes, with one single plane of copper readout strips in-between. The two gaps feature 2 mm thickness and have a bulk resistivity of the order of cm. High Voltage (HV) is applied to the outer graphite-coated surface of the bakelite plates. The chambers are equipped with front-end boards, each one connected to 16 strips.
The barrel RPC system consists of five wheels, installed at 0.8 and m, subdivided into 12 azimuthal sectors, each one equipped with six radial layers of RPCs. The radial layers are referred to in the following as RB1, RB2, RB3 and RB4 (two RB1 and two RB2 layers exist, for a total of six radial layers). Six endcap disks, three on the positive and three on the negative endcap side, are divided into 36 azimuthal sectors, with two radial rings (labeled R2 and R3) in each one. They assure a full coverage up to 1.6, as shown in Fig. 1. The fourth endcap disks, one on each side, are being installed during the 2014 shutdown and were not present during the 2010-2012 data taking period. The innermost rings (R1) will be installed during a future shutdown.
In total, 480 barrel chambers and 432 endcap chambers were installed in the 2010-2012 data taking period, adding up to 68136 barrel strips and 41472 endcap strips, respectively, and covering a total surface of about 3000 m2. The CMS RPCs work in saturated avalanche mode and use a three-component, non-flammable gas mixture composed of 95.2% C2H2F4 (R134a), 4.5% iC4H10 (isobutane) and 0.3% SF6. After mixing, water vapor is added in order to maintain the relative humidity at constant values of 40%-50% and to allow for constant bakelite resistivity. The strip pitch dimensions are between 2.28 and 4.10 cm in the barrel and between 1.95 and 3.63 cm in the endcap.
The RPCs have performed very well, with more than 98% of the channels operational. They were responsible for the loss of less than 1% of CMS running time. The fraction of recorded pp collision data certified good by the RPCs was above 99%.
In 2011 (2012), CMS has recorded 5.2 (21.8) fb-1of data out of 5.7 (23.3) fb-1delivered by the LHC, for an efficiency of 91 (about 94) %. An average of 98% of the CMS subdetector channels were operational and in the readout. Roughly 93% of the recorded data have been certified as “golden” for all physics analyses. Only certified runs have been used for the background studies.
3 Background measurement technique
The RPC hit rate is measured at the strip level during LHC pp collision runs. The strip rate is calculated by using the incremental counts of the RPC trigger Link Boards. The incremental counts are taken during typical time intervals of the order of 100 s. The resulting rates are then averaged over the total runtime and normalized to the strip area. The instantaneous luminosity is averaged over the same runtime. Normalized rates in Hz/cm2 are shown in this paper.
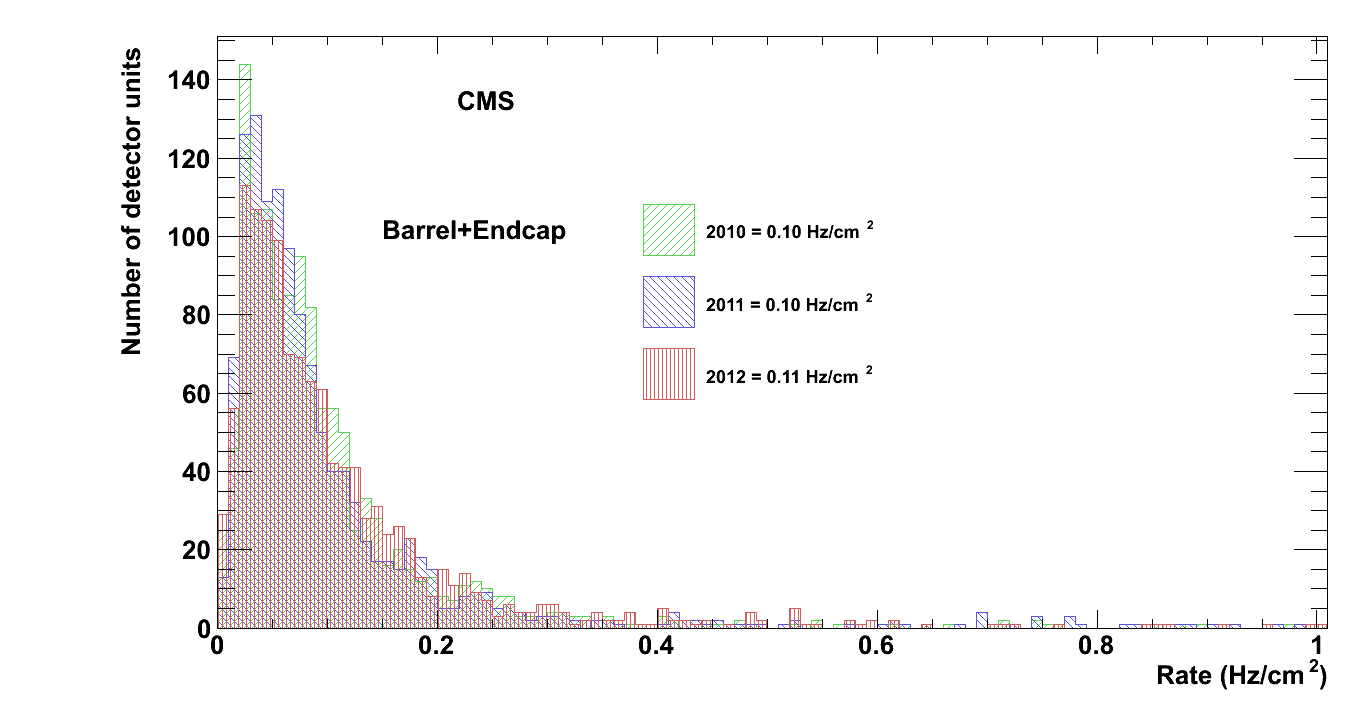
It is worth noting that no trigger selection is applied at this stage, resulting in an inclusive measurement of the radiation background rates. The offset level due to the intrinsic noise is estimated (if present) for each run and each chamber separately through a linear extrapolation to the value corresponding to zero instantaneous luminosity, which is subtracted from the chamber rate. The average noise rate measured during 2010-2012 cosmic runs is of the order of 0.1 Hz/cm2, as shown in Fig. 2 (left), i.e. much lower than the average background rates shown in Section 4.
4 Background measurement results
4.1 Linear dependence on instantaneous luminosity
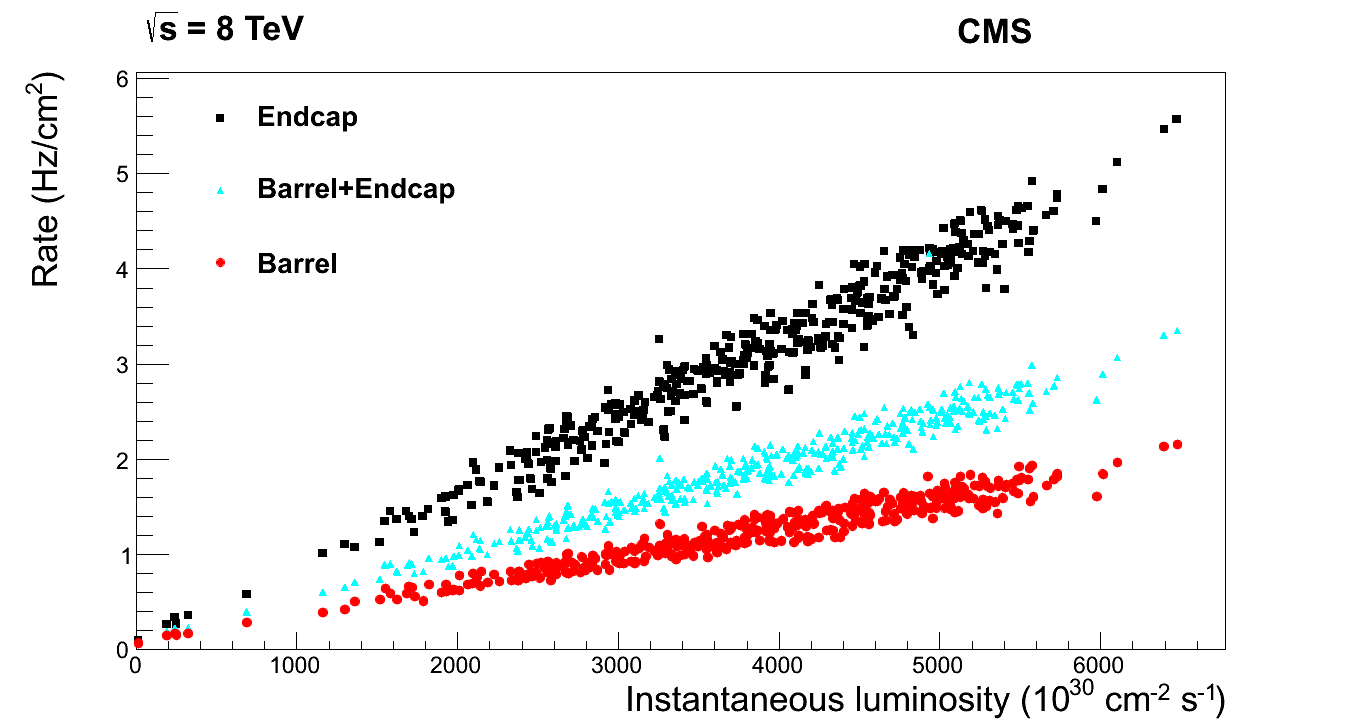
A linear relationship has been observed between the measured RPC hit rate and the LHC instantaneous luminosity, for several orders of magnitude of the instantaneous luminosity, from cm-2 s-1 in 2010, to almost cm-2 s-1 in 2012. The linear relationship holds for every single chamber, with correlation coefficient greater than 95% in more than 80% of the chambers, and also for larger detector parts (layers, rings, disks, wheels, etc.), as displayed in the following Figures showing the measured rate as a function of the luminosity.
No deviation from linearity has been observed in the 2010-2012 range of the LHC luminosity, therefore excluding, in this range, phenomena which could give rise to power-law dependence relationships with exponent different from 1. Extrapolations from the present measurements to larger luminosity values have thus been performed linearly and are reported in Section 5. Figure 2 (right) shows the average background rates measured in the RPC detector as a function of the instantaneous luminosity. Larger average rates are measured in the endcap, which spans a higher region.
4.2 Background as a function of and plus-minus asymmetry
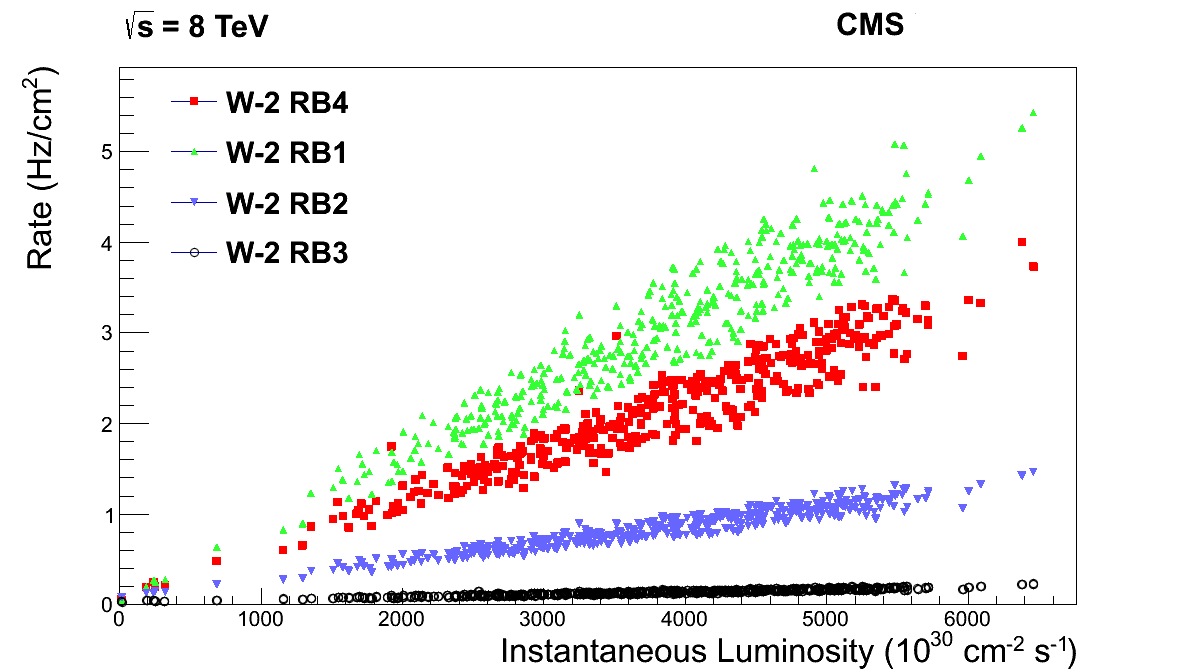
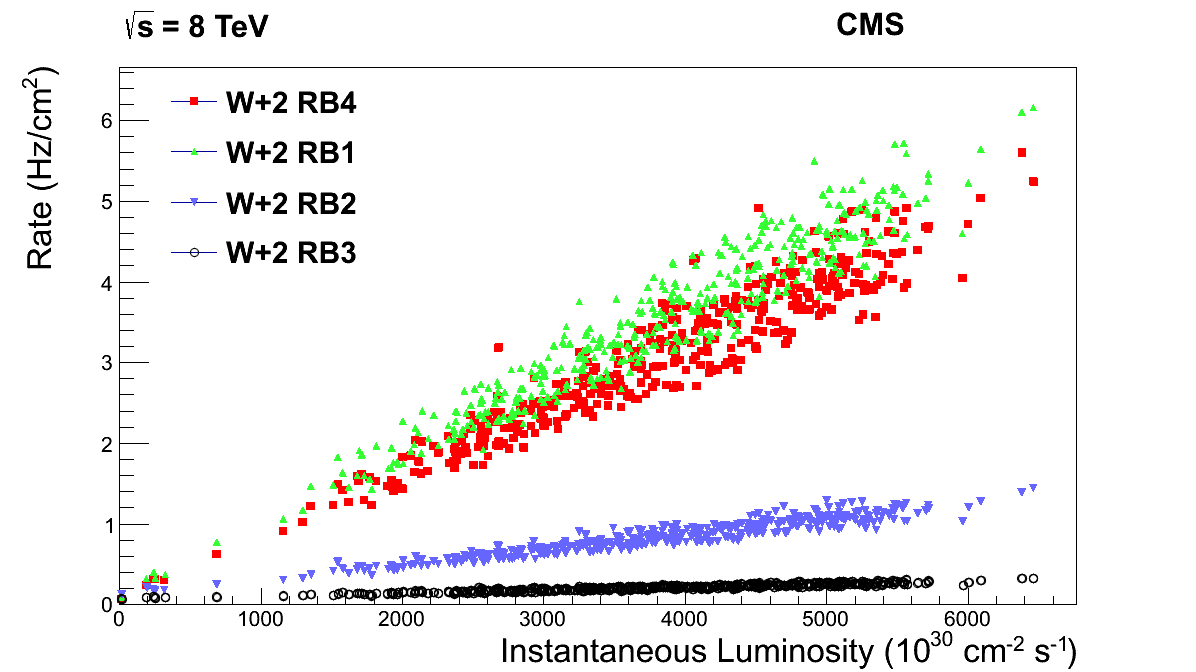
In the central region the rates increase as the chambers are further along z from the interaction point (IP), with the largest rates observed in the outermost wheels and (Fig. 3), which are the ones most exposed to the slow neutron gas permeating the cavern. The asymmetry between the two external wheels, with larger rate measured on the positive side () with respect to the negative side (), might be due to lower density of the neutron gas on the negative side because of the presence of the CMS main shaft (through which the detector was lowered from the surface into the cavern).
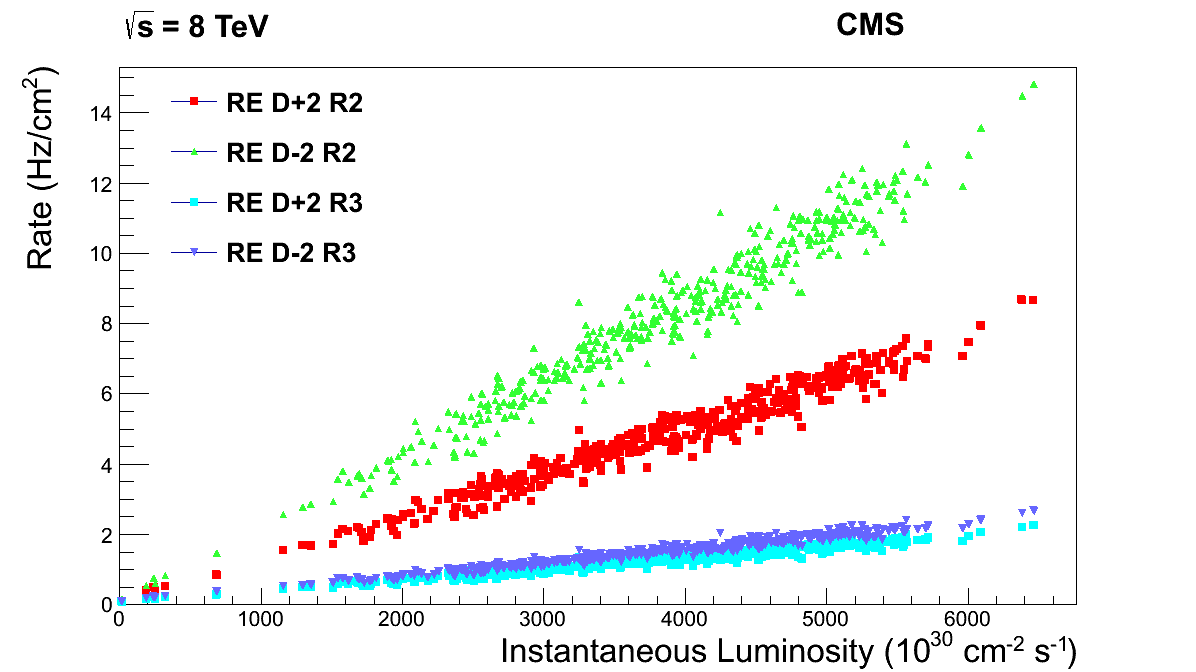
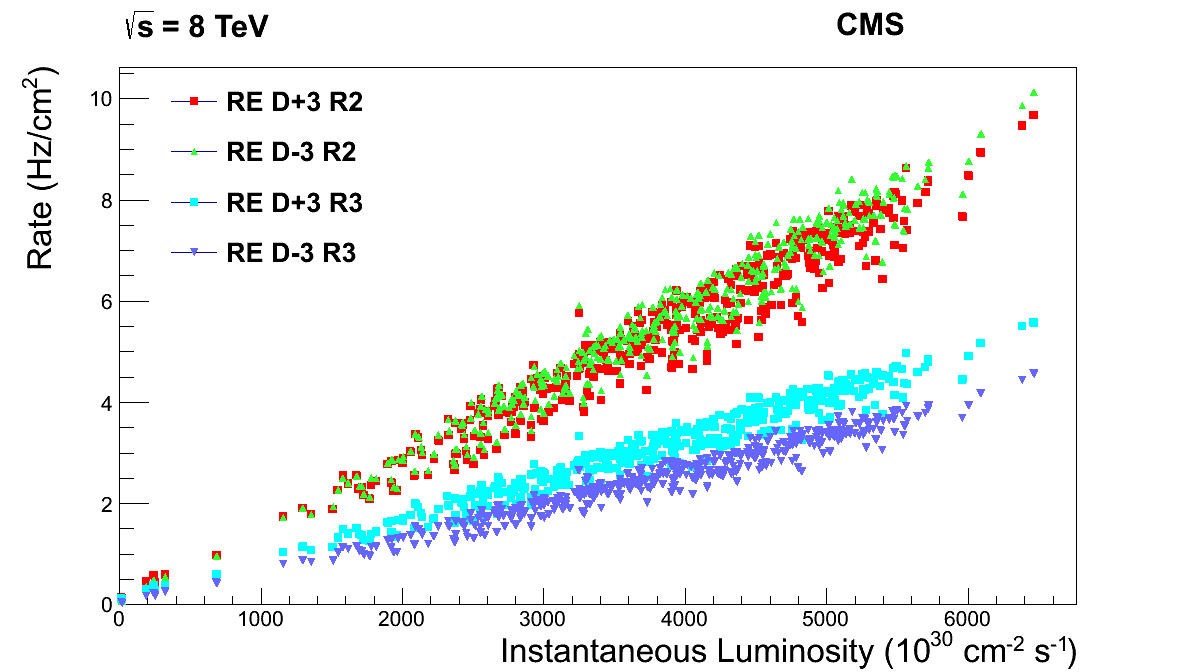
The same pattern is observed at high (Fig. 4), with higher rate as increases, i.e. in the chambers located further away from the IP. Both the inner (R2) and the outer (R3) rings of the six endcap disks show an increasing background as increases.
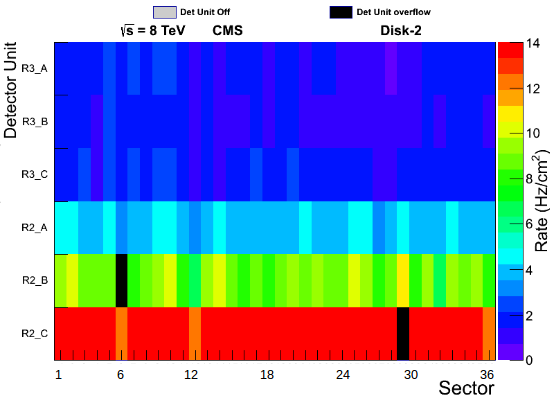
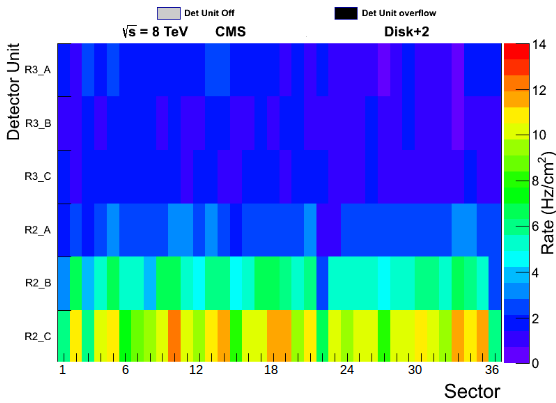
It is interesting to note the asymmetry between the rings R2 of the negative (labeled “D-2 R2”) and the positive (labeled “D+2 R2”) second disk of the endcap, due to missing shielding tiles on the negative endcap yoke supporting the disk D-2.
4.3 Background as a function of
The background behavior as a function of is different in the barrel and in the endcap, somehow reflecting the different types of background sources near the beamline and on the outside of CMS.
In the barrel (Fig. 3), the largest background is observed both in the inner layers (RB1), and in the outer layers (RB4). The innermost chambers are exposed to particle leakage from the hadron calorimeter, and from the gap between the barrel and the endcap of the calorimeters, while the barrel outermost chambers are mostly exposed to the surrounding radiation background from slow neutrons. Chambers located in the central layers RB2 and RB3 are protected by the steel of the barrel wheels and therefore detect much lower rates.
In the endcap (Fig. 4), the highest rates are detected in the inner rings (rings R2 of all endcap disks). The radial rings R2 are the closest to the beamline. The background rates decrease along as the distance from the beamline increases. The outer (R3) chambers show a smaller increase in rate with luminosity relative to the inner (R2) chambers.
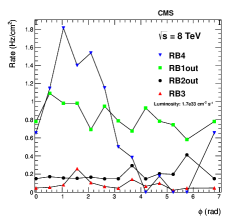
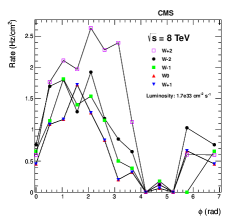
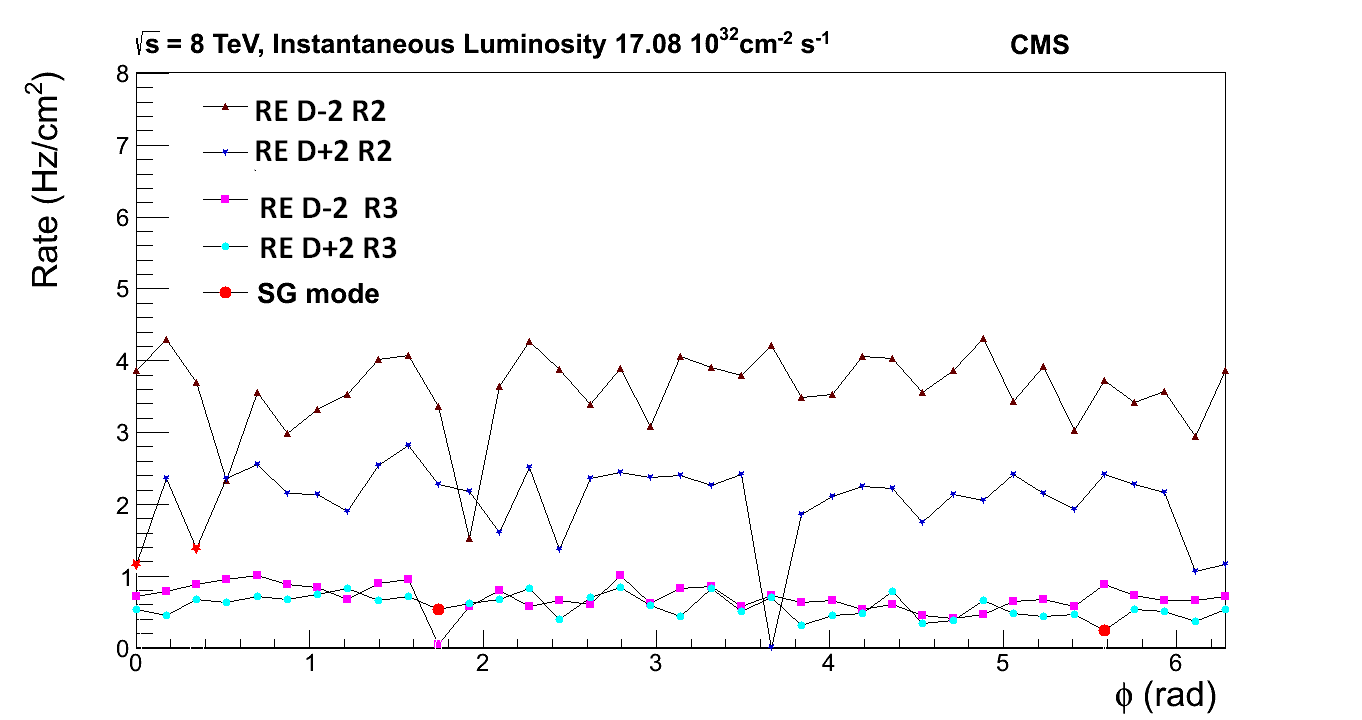
4.4 Background as a function of and azimuthal asymmetry
A strong azimuthal dependence of the background has been observed in the outer barrel layers (RB4) of all barrel wheels (Fig. 5), while in the inner layers the background distribution is symmetrical. In RB4 the rate ratio between the top and the bottom sectors is approximately a factor 20. The top-bottom asymmetry is explained by the non-symmetric features of the -otherwise symmetric- CMS detector: the concrete and steel flooring and the wheel and disk supports.
No evidence of -asymmetry is observed in the endcap (Fig. 5), most likely because the endcap chambers are located in between steel disks, while the barrel outer top chambers (RB4, top sectors from 3 to 5) are more exposed to the surrounding background.
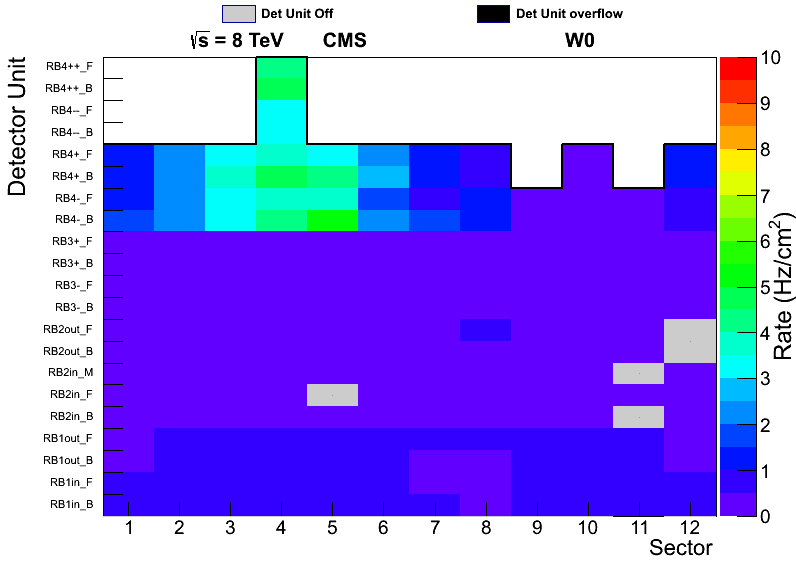
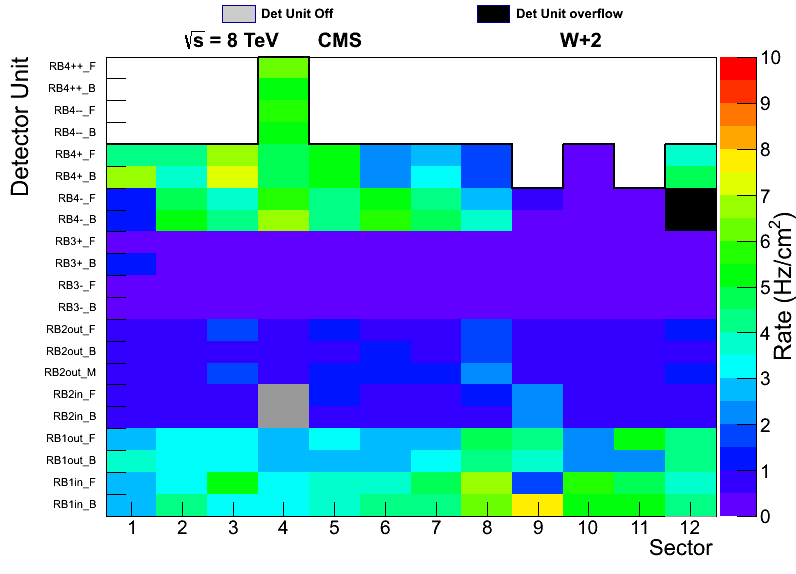
4.5 Background distribution: summary maps
The background measurement results described in details in the previous sections are also visually summarized in the two-dimensional plots shown in Figs. 6 and 7. In the barrel, larger rates are measured in the top (3,4,5) sectors of RB4, and in the internal radial layer RB1, independently of the sector. In the endcap, the rates are higher close to the beamline. The maps show no evidence of asymmetry in the endcap.
4.6 Comparison with the CMS CSCs and DTs
Similar features have been measured also by the CSCs and DTs, including the linear dependence on the LHC instantaneous luminosity and the typical patterns of the radiation background distributions. A comparison with 2010 data among the three detectors of the CMS Muon system was performed in [3].
5 Extrapolation to higher luminosities
Based on the linear relationship between measured rates and instantaneous luminosity, the RPC rates can be linearly extrapolated to higher luminosity values.
The extrapolation to higher beam energy (from 7 or 8 TeV of the present pp data to 14 TeV) can be performed by rescaling by an approximate total factor of 1.5, due to larger cross section and particle multiplicity: the pp inelastic cross section increases from 73.5 mb [6] at 7 TeV to 80 mb [7] at 14 TeV; a factor accounts for the increased particle multiplicity, scaling as square root of the energy.
At a peak luminosity of (or ) cm-2 s-1, and at the center-of-mass energy of 14 TeV, the expected average rates are of the order of 4 (20) Hz/cm2 in the barrel and 12 (60) Hz/cm2 in the endcap. The maximum rates in the most exposed regions of the RPCs are within a factor 5 with respect to the quoted average rates, and are therefore well within the RPC rate capability, which is of the order of 1 KHz/cm2 [8]
6 Comparison with simulation
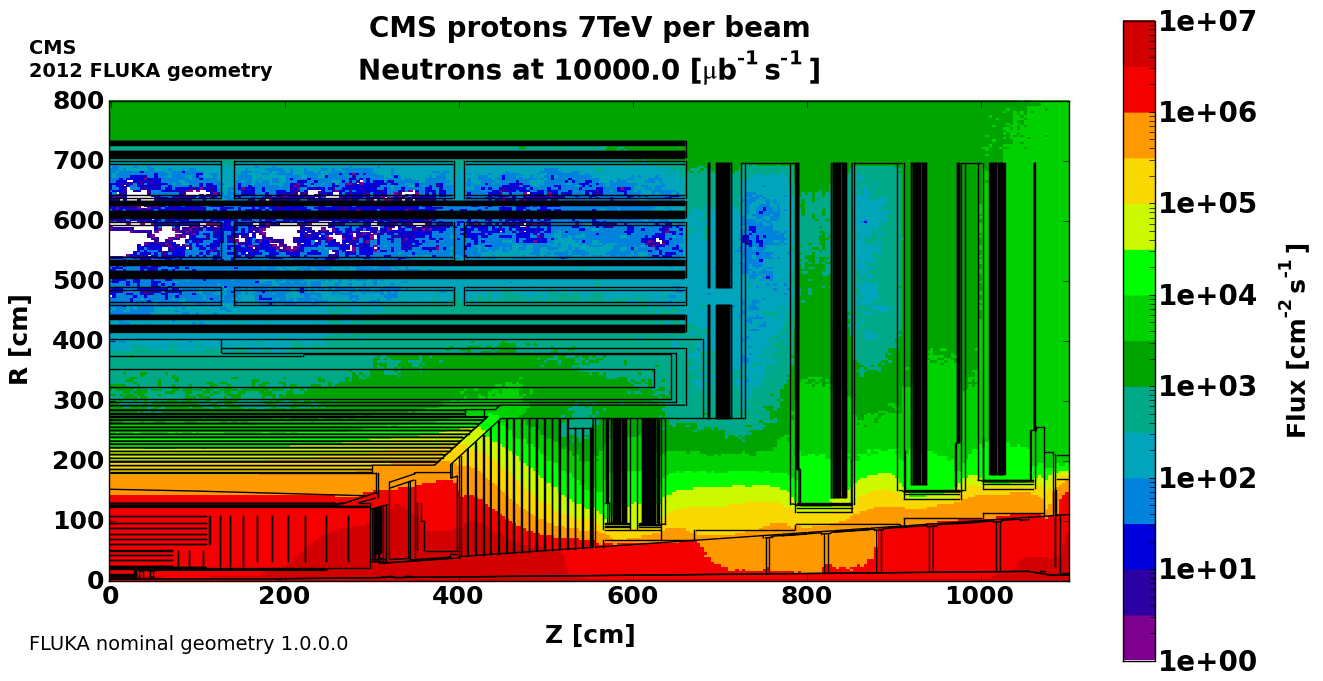
Comparisons with FLUKA [9] simulations have shown that the simulation describes well the typical patterns of the radiation background inside the RPCs. Figure 8 (left) shows, as an example, the neutron flux inside the Muon system. As measured in the data, the flux is expected to be high in the RB1 and RB4 barrel layers, and in the endcap at high . The reference luminosity of cm-2 s-1 is assumed.
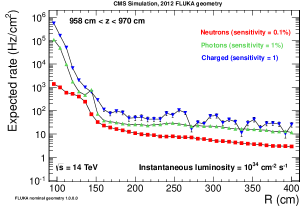
Flux and rate estimates from simulation can be used in the high regions -not covered by the present Muon system- where additional RPC chambers will be installed in a future shutdown. In order to provide estimates of the expected rates, the FLUKA flux values have been rescaled by the following average sensitivity values [10] from previous simulations and test beam measurements: 0.001 for neutrons, 0.01 for photons, and 1 for charged particles. Neutrons, photons, and charged particles account for almost 100% of the particles produced in primary pp interactions. In total, a rate of a few tens of Hz/cm2 is expected at low R and high values, i.e. in the region closest to the beamline (Fig. 8, right).
7 Conclusions
Detailed studies of the radiation background have been performed, which have lead to an accurate understanding of the background distribution inside the CMS Muon system. Comparisons with simulations have shown reasonable agreement between the measurements and the expected rates. Extrapolations to high-luminosity scenarios predict background levels within the RPC rate capability.
Acknowledgements.
Acknowledgments of support of all CMS are given in Ref. [3]. The authors would like to thank the RPC2014 organizers and the colleagues of the CMS Muon system.References
- [1] CMS Collaboration, The Compact Muon Solenoid, Technical Proposal, CERN/LHCC 94-38 (1994).
- [2] CMS Collaboration, The CMS Experiment at the CERN LHC, \jinst32008S08004.
- [3] CMS Collaboration, The performance of the CMS muon detector in proton-proton collisions at TeV at the LHC, \jinst82013P11002.
- [4] M. Abbrescia et al., Cosmic ray tests of double-gap resistive plate chambers for the CMS experiment, Nucl. Instr. Meth. A 550 (2005) 116.
- [5] CMS Collaboration, Performance Study of the CMS Barrel Resistive Plate Chambers with Cosmic Rays, \jinst52010T03017, and references therein.
- [6] Totem Collaboration, First measurement of the total proton-proton cross section at the LHC energy of TeV, EPL, 96 (2011) 21002.
- [7] T. Pierog et al., EPOS LHC: test of collective hadronization with LHC data, 2013, arXiv:1306.0121.
- [8] M. Abbrescia, The dynamic behavior of Resistive Plate Chambers, Nucl. Instr. Meth. A 533 (2004) 7.
- [9] Fluka team, www.fluka.org. Matplotlib team, www.matplotlib.org. Citations and credits therein.
- [10] S. Altieri et al., RPC sensitivity simulation, Nucl. Instr. Meth. A 456 (2000) 99. S. Altieri et al. Simulation of Resistive Plate Chamber sensitivity to neutrons, Nucl. Instr. Meth. A 461 (2001) 57.