A multi-level soft frequency reuse technique for wireless communication systems
Abstract
A multi-level soft frequency reuse (ML-SFR) scheme and a resource allocation methodology are proposed for wireless communication systems in this letter. In the proposed ML-SFR scheme, there are 2N power density limit levels, achieving better interference pattern and further improving the cell edge and overall data rate, compared to the traditional 2-level SFR scheme. The detailed design of an 8-level SFR scheme is demonstrated. Numeral results show that the cell edge spectrum efficiency is increased to 5 times of that of reuse 1 and the overall spectrum efficiency is improved by 31%. ML-SFR can be utilized in the current 4G system and would be a candidate key technology for future 5G systems.
Index Terms:
Multi-level soft frequency reuse, inter cell interference coordination, interference pattern, LTE, 5G.I Introduction
Soft frequency reuse (SFR) [1, 2] has become one of most important enablers for wireless systems, especially orthogonal frequency division multiplexing (OFDM) based ones, to achieve high data-rate communications. It has been extensively explored under the subject of inter cell interference coordination (ICIC) in 3GPP LTE [3]. It is also adopted by the Wimax standard, however given another name fractional frequency reuse [4], a term originally meaning a specific configuration of directional antennas [5], and later used by [6] to represent reuse partitioning [7, 8].
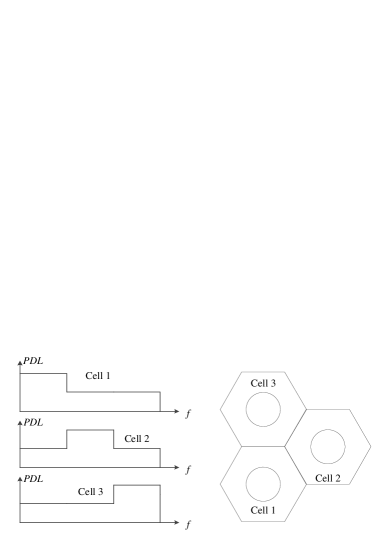
In an example SFR configuration, as illustrated in Fig. 1, the whole bandwidth is divided into three parts, in which one part, called primary band, has a higher power density upper limit (PDL) than the other two, called secondary bands. The primary bands of adjacent cells are orthogonal to and do not interfere with each other.
SFR is closely related to resource allocation, or specifically scheduling in LTE system [9, 10, 11]. In fact, SFR defines a network-level framework for resource allocation in each cell. Due to the constrains of SFR, a cell edge UE can only be allocated resources in the primary band while a cell centre UE can access the whole bandwidth. Because the primary bands of adjacent cells are orthogonal to each other, severe interference is avoided at cell edge, improving the cell edge data rate compared to the reuse 1 system [1, 2]. SFR can be straightforwardly extended to the time domain to make a soft time reuse scheme [12], or enhanced inter cell interference coordination (eICIC) in 3GPP [13].
An important parameter for SFR is the ratio expressed by
| (1) |
It has been pointed out in [2] that when increases, the cell edge capacity decreases and the cell centre capacity increases, and vise versa. It is clear that when all the traffic happens at the cell edge/centre, should be 0/1. However, when the traffic is uniformly distributed, the optimal value for is still an open problem. Another question is, since the widely accepted two-PDL-level SFR (SFR-2) scheme can improve the cell edge data rate, could more PDL levels help to further improve the performances? Even there are some tentative moves in [10] and [11], no substantial progress has been made on this topic.
In this letter, a multi-level soft frequency reuse (ML-SFR) technique is proposed, in which the whole frequency band is divided into several parts. On each part, a SFR-2 scheme with its specific value is employed, based on the discovery that the optimal value is closely related to UE position. The closer a UE is to the cell edge, the larger transmit power it requires, and the lower interfering power from adjacent cells it can endure, corresponding to a larger value. A resource allocation methodology based on ML-SFR is proposed. ML-SFR and the proposed resource allocation methodology further optimize the interference pattern and improve the cell-edge and overall data rate, compared to SFR-2.
The rest of this letter is organized as follows. Section II gives the problem formulation. A ML-SFR scheme and a resource allocation methodology are proposed in Section III and Section IV, respectively. Section V demonstrates the detailed design of an 8-level SFR (SFR-8) scheme and numerical results. Section VI concludes this letter.
II Problem Formulation
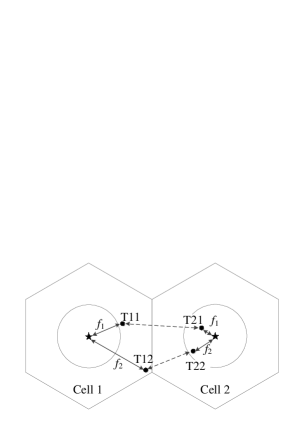
Let us have a look at an interference pattern of the SFR-2 scheme, illustrated in Fig. 2. There are two UEs in the cell edge area of Cell 1, denoted as T11 and T12, communicating with their base station using frequency and in the primary band, either in downlink or uplink. There are two UEs in the cell centre area of Cell 2, denoted as T21 and T22, communicating with their base station also on frequency and . According to the SFR definition, and should be in the secondary band of Cell 2. So, the interference pattern is, T11 interferes with T21 and T12 interferes with T22, as shown in Fig. 2.
In this example, T12 and T22 are more far away from their base station than T11 and T21, respectively, so requiring bigger transmit power. In such a case, switching the communication resources for T21 and T22 will make a better interference pattern. Since T12 is more vulnerable than T11, it is appropriate to pair it with T21, which has smaller interfering power than T22. With such a pattern, the UE at the most cell edge can achieve higher data rate at the cost of lower data rate of the UE at the most cell centre. This is desirable for operators since user complains can be effectively reduced by increasing the data rate of the most vulnerable UEs.
However, SFR-2 can not provide enough constraints to always realize the better interference pattern. In a 2-cell scenario as in Fig. 2, the better pattern can be achieved by the chance of 50% via random resource allocation. In a 7-cell scenario, one central cell plus 6 surrounding cells, the chance of random allocation to realize the optimal pattern falls to . In order to optimize the interference pattern, a multi-level soft frequency reuse is presented, as follows.
III Multi-level soft frequency reuse
In a ML-SFR scheme, the whole frequency band is divided into parts on each of which a separate SFR-2 scheme is employed. In Cell , the PDLs of the primary and secondary bands of part are denoted as and respectively, satisfying
| (2) |
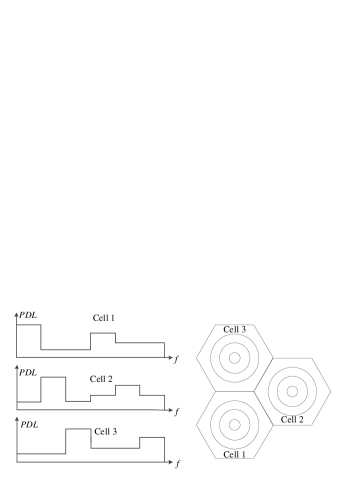
A SFR-4 scheme is shown in Fig. 3. It is worth noticing the specific PDL setting in which the highest PDL pairs with the lowest, the second highest pairs with the second lowest, and so on.
In a SFR-2 scheme, the whole cell is quantized into two areas, cell centre and cell edge. This is a relatively coarse framework for resource allocation. In a ML-SFR scheme, there are totally PDL levels, dividing the whole cell into areas and making a more refined framework.
IV Resource allocation based on multi-level soft frequency reuse
Resource allocation happens at the instance of call access in voice communication systems like GSM. In LTE system, it happens periodically in the process of data transmission, called scheduling. Similar to SFR-2, ML-SFR also defines a network-level framework for resource allocation in each cell.
It is obvious a band with higher PDL have a larger coverage. Generally, a UE can be assigned the resources in the frequency band that covers it. However, we suggest the methodology of allocating resources to a UE in the bands with the possible smallest coverage to optimize the system performances.
First of all, a coverage area is determined for each of the frequency bands according to their PDLs. The relationship between the PDL and coverage is an implementation problem which operators would optimize based on the realistic scenarios. Each UE reports its position to the base station and a list including the bands covering the UE is created. When allocating resources to a UE, the allocator search the band with the smallest coverage in the list for available resources. If there are not enough available resources, then search the band with the second smallest coverage, and so on, till enough resources are found or a negative conclusion is drawn.
Let us revisit the example in Fig. 2 assuming a SFR-4 scheme is used. Suppose and belong to the primary bands of Cell 1 and has a smaller PDL than , then according to the definition of ML-SFR, they belong to the secondary bands of Cell 2 and has a greater PDL than . If there is enough separation in distance between the UEs in Fig. 2, a list including the bands with the coverage in ascending order could be established for each UE as in Tab. I. Then the resource assigned to each UE is the first frequency in the list, achieving the better interference pattern aforementioned.
| UE | T11 | T12 | T21 | T22 |
|---|---|---|---|---|
| List |
From this example we can also learn the rationality of the suggested resource allocation methodology. If T11 is assigned with the larger coverage than , there will no resources left for T12 while is still spare.
It is worth noticing that ML-SFR and the suggested resource allocation methodology can be employed in any cellular systems without the need of standardization works. From the above discussion we can learn that UE’s position is the only measurement needed by the base station to implement ML-SFR, which is already realized by all cellular systems to support handover function. Commonly, a UE measures the received power of a beacon signal send by the base station and reports it back as the indication of its distance to the base station. In LTE, the common reference signal (CRS) plays the role of the beacon signal.
In LTE, a common way to employ SFR-2 on one carrier is to choose a part of subcarriers as primary band and others as secondary bands. ML-SFR can be implemented in the similar way by dividing a carrier into more parts. However, since CRS and physical downlink control channel (PDCCH) are distributed throughout the whole carrier and are transmitted with full power [14], they will interfere the primary bands of adjacent cells and impair the gain of ML-SFR.
In order to overcome the CRS and PDCCH interference problem, an alternative way is to use multiple carriers, each carrier as a band with its specific PDL. Then the power of CRS and PDCCH on each carrier can be reduced along with the traffic channels. A drawback for an operator with limited spectrum is the limited peak data rate, because adopting the multi-carrier solution means one wideband carrier is divided into several narrowband carriers and a LTE UE can only transmit data on one carrier. In LTE-A, with the deployment of carrier aggregation [13] , one UE can transmit data on several component carriers, the peak data rate problem can be solved.
V Design of Multi-level soft frequency reuse
Consider a cellular network including 13 cells with radius , as shown in Fig. 4. We assume a ML-SFR scheme is used, the primary band of Cell 0 is also the primary band of Cell 7-12, and the secondary band of Cell 1-6.
A UE is placed in Cell 0 and its position is limited on the straight line between the base station and point A, the intersection of Cell 0,1, and 6. Denote the distance between the UE and its base station as
| (3) |
where is a coefficient within .
Let us consider the downlink and assume be the transmit power density of the base station of Cell , expressed by
| (4) |
where is the power density of white noise in the UE receiver. Assume the bandwidth is , then the power of noise in the UE receiver is
| (5) |
Denote the distance between the base station of Cell and the UE as and path loss model as , then the received power of the UE from its serving cell is
| (6) |
the interference power from other cells is
| (7) |
Let
| (8) |
| (9) |
meaning the transmit power of all primary bands is , and that of all secondary bands is , then
| (10) |
Suppose the intra-cell interference is effectively eliminated, as in the OFDM systems, according to Shannon’s law of channel capacity, the maximum spectrum efficiency in a flat fading channel can be expressed as
| (11) |
which is a function of and .
| (dBm/Hz) | -169 |
|---|---|
| (dBm/MHz) | 50/20 |
| (km) | 1 |
| Path loss(dB) |
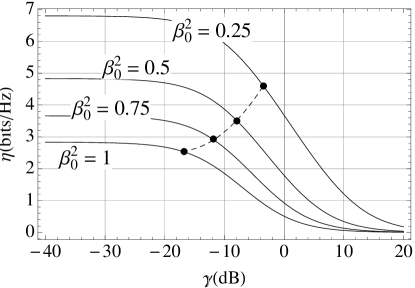
We use the parameters in Tab. II and depict as a function of with =0.25, 0.5, 0.75 and 1 in Fig. 5 for a flat fading channel. We can see the curves go down when increases due to the increase of inter cell interference.
In engineering application, there may be different options for parameter. In our example shown by the ascending line in Fig. 5, the spectrum efficiency for is selected as about 90% of the highest value, and higher spectrum efficiency is selected for smaller values. The results of values are about -17dB, -12.5dB, -8dB, -3dB, based on which a SFR-8 scheme is designed, with the normalized PDL gain of each level shown in Tab. III.
| Level | 1 | 2 | 3 | 4 | 5 | 6 | 7 | 8 |
|---|---|---|---|---|---|---|---|---|
| Gain(dB) | 0 | -2.4 | -4.8 | -7.3 | -9.7 | -12.1 | -14.6 | -17 |
With such parameters, the spectrum efficiency as a function of of each level of SFR-8, together with SFR-2 and reuse 1 are depicted in Fig. 6 for a flat fading channel. The value for SFR-2 is chosen as -6dB.
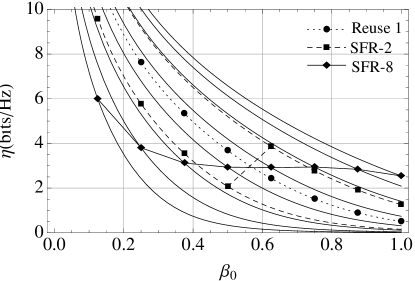
Consider eight positions with , an example resource allocation could be represented by the dots in Fig. 6. For the reuse 1 scheme, high spectrum efficiency can be achieved in cell center, while at cell edge (), it is only 0.51bps/Hz. SFR-2 improves the cell edge efficiency by 147% to 1.26bps/Hz, at the cost of decrease of efficiency in cell centre. SFR-8 realizes a more flat curve and further increases the cell edge efficiency to 2.54bps/Hz, 5 times of that of reuse 1.
| 1/8 | 2/8 | 3/8 | 4/8 | 5/8 | 6/8 | 7/8 | 1 | ||
| Reuse 1 | 1 | 1.80 | 2.71 | 3.88 | 5.62 | 8.50 | 13.7 | 23.2 | 40.6 |
| SFR-2 | 1 | 0 | 0 | 0 | 0 | 0 | 3.45 | 11.9 | 18.0 |
| 2 | 2.37 | 3.94 | 6.41 | 11.0 | 20.2 | 22.7 | 0 | 0 | |
| T | 2.37 | 3.94 | 6.41 | 11.0 | 20.2 | 26.2 | 11.9 | 18.0 | |
| SFR-8 | 1 | 0 | 0 | 0 | 0 | 0 | 0 | 0 | 8.33 |
| 2 | 0 | 0 | 0 | 0 | 0 | 0 | 5.50 | 2.83 | |
| 3 | 0 | 0 | 0 | 0 | 0 | 2.83 | 5.50 | 0 | |
| 4 | 0 | 0 | 0 | 0 | 0 | 8.33 | 0 | 0 | |
| 5 | 0 | 0 | 0 | 0 | 14.0 | 2.65 | 0 | 0 | |
| 6 | 0 | 0 | 0 | 14.5 | 2.11 | 0 | 0 | 0 | |
| 7 | 0 | 0 | 14.3 | 2.40 | 0 | 0 | 0 | 0 | |
| 8 | 4.52 | 11.2 | 0.96 | 0 | 0 | 0 | 0 | 0 | |
| T | 4.52 | 11.2 | 15.2 | 16.9 | 16.1 | 13.8 | 11.0 | 11.2 | |
To achieve a fair comparison, we assume users are distributed on eight circles with , and require the sum data rate on each circle is same. For every scheme, we perform resource allocation to maximize this sum data rate. The result of resource allocation in percentage is shown in Tab. IV. We can see 40.6% of resources are allocated to cell edge users for reuse 1 due to the very low spectrum efficiency. With the improvement of cell edge efficiency, this percentage decreases to 18% for SFR-2 and 11.2% for SFR-8 and the overall spectrum efficiency is increased. With such resource allocation, the overall spectrum efficiency is 1.654 bps/Hz for reuse 1, while this value is 1.817 bps/Hz for SFR-2 and 2.168 bps/Hz for SFR-8, increased by 9.85% and 31% based on reuse 1, respectively.
VI Conclusions
The proposed multi-level soft frequency reuse scheme is a generalization and refinement of SFR-2. ML-SFR and the suggested resource allocation methodology can achieve better interference pattern than SFR-2, further improving the cell-edge and overall data rate. It can be used in the current LTE system and would be a candidate key technology for future 5G systems.
References
- [1] X. Yang, “A method of realizing soft frequency reuse in the wireless communication system and the device thereof,” CN1783861/EP1811699, Huawei, Dec. 2004.
- [2] ——, “Soft frequency reuse scheme for UTRAN LTE,” Huawei, 3GPP R1-050507, TSG-RAN1 #41, Athens, Greece, May 2005.
- [3] R. Zhang and L. Hanzo, “Wireless cellular networks,” IEEE Vehicular Technology Magazine, vol. 5, no. 4, pp. 31–39, Dec. 2010.
- [4] “Mobile WiMAX-Part I: A technical overview and performance evaluation,” Wimax forum, Tech. Rep., Aug. 2006.
- [5] S. Faruque, “High capacity cell planning based on fractional frequency reuse with optimum trunking efficiency,” in Proc. IEEE Veh. Technol. Conf., vol. 2, May 1998, pp. 1458–1460.
- [6] A. Khandekar and A. Agrawal, “Rate prediction in fractional reuse systems,” US Patent 11/168904, QUALCOMM Incorporated, June 2005.
- [7] S. W. Halpern, “Reuse partitioning in cellular systems,” in Proc. IEEE 33rd Veh. Technol. Conf., May 1983, pp. 322–327.
- [8] M. Sternad, T. Ottosson, A. Ahln, and A. Svensson, “Attaining both coverage and high spectral efficiency with adaptive OFDM downlinks,” in Proc. IEEE Veh. Technol. Conf., Orlando, Florida, Oct. 2003.
- [9] X. Mao, A. Maaref, and K. H. Teo, “Adaptive soft frequency reuse for inter-cell interference coordination in SC-FDMA based 3GPP LTE uplinks,” in Proc. IEEE Global Telecommun. Conf., Dec. 2008, pp. 1–6.
- [10] M. Bohge, J. Gross, and A. Wolisz, “Optimal power masking in soft frequency reuse based OFDMA networks,” in Proc. of European Wireless Conf., Alborg, Denmark, May 2009.
- [11] K. Doppler, C. Wijting, and K. Valkealahti, “Interference aware scheduling for soft frequency reuse,” in Proc. IEEE VTC Spring, April 2009, pp. 1–5.
- [12] X. Yang, “Method and system for implementing soft time reuse in wireless communication system,” CN1859054B/US7796567, Huawei, Apr. 2005.
- [13] “Evolved universal terrestrial radio access (E-UTRA) and Evolved universal terrestrial radio access (E-UTRAN), Overall description, stage 2,” 3rd Generation Partnership Project (3GPP), TS 36.300 v10.11.0, Sep. 2013.
- [14] S. Sesia, I. Toufik, and M. Baker, LTE-The UMTS Long Term Evolution: From Theory to Practice. John Wiley & Sons Ltd., 2009.