2014 \SetVolume50 \ReceivedDateMay 23, 2014 \AcceptedDateJune 9, 2014
Fourier Decomposition of RR Lyrae light curves and the SX Phe population in the central region of NGC 3201
Presentamos el análisis de una serie temporal de imágenes CCD de la región central del cúmulo globular NGC 3201. El objetivo principal de este trabajo es la descomposición de Fourier de las curvas de luz de las estrellas RR Lyrae y su empleo en la determinación de la metalicidad del cúmulo y de su distancia. De esta manera hemos obtenido, para la metalicidad, el valor medio [Fe/H] (estadístico) (sistemático), y para la distancia, kpc (estadístico) (sistemático). La metalicidad y la distancia estimados a partir de dos estrellas RRc son consistentes con los anteriores. Debido a la presencia de enrojecimiento diferencial, derivamos valores individuales de para las estrellas RR Lyrae analizando sus curvas de color . El valor promedio encontrado es . Una exploración de las curvas de luz de las estrellas en la región de las blue stragglers condujo al descubrimiento de tres nuevas variables SX Phe. La relación periodo-luminosidad de las estrellas SX Phe se empleó para obtener una determinación independiente de la distancia al cúmulo y de los enrojecimientos individuales. La distancia calculada fue de 5.0 kpc.
Abstract
CCD time-series observations of the central region of the globular cluster NGC 3201 were obtained with the aim of performing the Fourier decomposition of the light curves of the RR Lyrae stars present in that field. This procedure gave the mean values, for the metallicity, of [Fe/H] (statistical) (systematical), and for the distance, kpc (statistical) (systematical). The values found from two RRc stars are consistent with those derived previously. The differential reddening of the cluster was investigated and individual reddenings for the RR Lyrae stars were estimated from their curves. We found an average value of . An investigation of the light curves of stars in the blue stragglers region led to the discovery of three new SX Phe stars. The period-luminosity relation of the SX Phe stars was used for an independent determination of the distance to the cluster and of the individual reddenings. We found a distance of 5.0 kpc
keywords:
globular clusters: individual: NGC 3201 – stars: variables: RR Lyrae – stars: variables: SX Phe0.1 Introduction
NGC 3201 (C1015461 in the IAU nomenclature) is a nearby (4.9 kpc) and very extended globular cluster with a very sparse central region. These characteristics have contributed to making it the subject of intensive and successful searches for variable stars over the past one hundred years. Despite its proximity, the cluster has considerable differential reddening (e.g., von Braun & Mateo 2001, Piotto et al. 2002; Layden & Sarajedini 2003), which is not unexpected given its position near the Galactic plane (, ). It is rich in variable stars; the 2012 update to the Catalogue of Variable Stars in Globular Clusters (CVSGC, Clement et al. 2001) lists 121 variables contained approximately within half a square degree around the cluster center, among them: 86 RR Lyrae stars, 13 SX Phoenicis, 8 Long Period Variables, 3 eclipsing binaries, and 11 non-variables previously suspected of variability. The first 56 variables in the cluster were found by Woods (1919) on a few Harvard plates obtained in 1916 at the Boyden Station of Harvard Observatory near Arequipa, Peru. A few variables, now numbered V57–V61, were added by Bailey (1922) from deep-exposure (2- and 4-hour) plates also at Arequipa. Continuing these efforts, Dowse (1940) announced the discovery of 25 more variables, V62–V86, on 60 new plates. Star V87 was discovered by Wright (1941) during an investigation of variable star periodicities, also on Arequipian plates. No further variable search was undertaken until 24 years later when Wilkens (1965) discovered variables V88–V96. Up to then, the large majority of variables were of the RRab type, four were RRc, and a few others would turn out to be non-variable in later more precise studies. Stars V97–V100 were found from photometric and photographic data by Lee (1977). More than twenty years later, already in the CCD era, von Braun & Mateo (2002) found the eclipsing binary V101 and other short-period variables in the field of the cluster, mostly eclipsing binaries and one RR Lyrae which they argued were not cluster members. The first group of SX Phe stars, V102–V112, was identified by Mazur et al. (2003). Layden & Sarajedini (2003) (LS03) detected low-light variations in some bright red giants (V113–V118), and discovered another eclipsing binary (V119) and two probable SX Phe stars (V120 and V121).
The present investigation is the first one that uses the difference image analysis (DIA) technique on NGC 3201. The virtues of DIA as a powerful tool to discover short-period variable stars, or unveil small amplitude variations in Blazhko RR Lyrae stars in the densely populated central regions of globular clusters, have been shown in several papers in the recent literature (e.g. Arellano Ferro et al. 2013a, 2012; Bramich et al. 2011; Figuera Jaimes et al. 2013; Kains et al. 2013, 2012 and references therein). We applied this method to the central regions of NGC 3201 on a set of data obtained under average-to-mediocre seeing conditions; in spite of this, our photometry led to clean light curves for the great majority of the RR Lyrae stars and allowed the discovery of three new SX Phe as shall be described later.
The principal aim of the present paper is to offer a new time-series V and I CCD photometry that allows the refining of the periods of the variables as well as the Fourier decomposition of the light curves of the RR Lyrae population to estimate its iron content [Fe/H] and distance independently; we also want to compare the cluster distance obtained via the SX Phe Period-Luminosity (P-L) relation to estimates derived with other methods. In the process we shall discuss the peculiarities of several stars of the cluster population of variables.
The layout of the paper is as follows: In Sect. 2 we describe the observations, data reductions, and transformation of our photometry to the standard system. In Sect. 3 the distribution of the variable stars in the Color-Magnitude diagram (CMD) is presented and three new SX Phe stars are announced. The RR Lyrae are identified, their periods are refined, and their light curves are presented. In Sect. 4 the individual reddenings of RR Lyrae stars are calculated and the Fourier decomposition of their light curves is performed to estimate their metallicity, luminosity, mass, and radius. The distribution of the RR Lyrae stars on the Bailey diagram (Amplitude versus Period) is discussed. In Sect. 5 we address the P-L relation for SX Phe stars and comment on the implied cluster distance. Sect. 6 summarizes our results.
0.2 Observations and reductions
0.2.1 Observations
The Johnson-Kron-Cousins and observations used in the present work were obtained on March 19–22, 2013, with the 2.15-m telescope of the Complejo Astronómico El Leoncito (CASLEO), San Juan, Argentina. The estimated seeing varied between and 2.8 arcsec, with a tendency to increase as each night progressed. The detector was a Roper Scientific back-illuminated CCD of pixels with a scale of 0.15 arcsec/pix and a field of view (FoV) of approximately arcmin2. Our data consist of 143 and 146 images.
0.2.2 Difference Image Analysis (DIA)
Image data were calibrated using bias and flat-field correction procedures. We used DIA to extract high-precision time-series photometry in the field of NGC 3201. As in previous papers, we used the DanDIA111DanDIA is built from the DanIDL library of IDL routines available at http://www.danidl.co.uk pipeline for the data reduction process (Bramich et al. 2013), which includes an algorithm that models the convolution kernel matching the PSF of a pair of images of the same field as a discrete pixel array (Bramich 2008).
A brief summary of the DanDIA pipeline can be found e.g., in the paper by Arellano Ferro et al. (2013a), while a detailed description of the procedure and its caveats are available in the paper by Bramich et al. (2011), to which the interested reader is referred for the relevant details.

We also used the methodology developed by Bramich & Freudling (2012) to solve for the magnitude offset that may be introduced into the photometry by the error in the fitted value of the photometric scale factor corresponding to each image. The magnitude offset due to this error can reach up to mmag in a few cases, but it is generally of the order of mmag. This correction improved the quality of the light curves, particularly for the brightest stars.
0.2.3 Transformation to the VI standard system
From the high number of standard stars of Stetson (2000)222http://www3.cadc-ccda.hia-iha.nrc-cnrc.gc.ca/
community/STETSON/standards
in the large field of NGC 3201, 85 were identified in the
FoV of our images with and in the ranges 12.6–18.6 mag and
– mag,
respectively. These were used to transform our instrumental system into the
Johnson-Kron-Cousins photometric system (Landolt 1992). The standard minus the
instrumental magnitude differences show a mild dependence on the color as displayed
in Fig. 1. The transformation equations are of the form:
| (1) | |||||
| (2) | |||||
0.3 Variable Stars in NGC 3201
The variable stars in our FoV are listed in Table 1 along with their mean magnitudes, amplitudes, and periods derived from our photometry. The coordinates listed in columns 10 and 11 are taken from the CVSGC, and were calculated by Samus et al. (2009) and Mazur et al. (2003). We found them to be accurate and no attempt to recalculate them was made. We include them here for the sake of completeness.


| Variable | Variable | (LS03) | HJDmax | (this work) | RA | Dec | ||||
|---|---|---|---|---|---|---|---|---|---|---|
| Star ID | Type | (mag) | (mag) | (mag) | (mag) | (d) | () | (d) | (J2000.0) | (J2000.0) |
| V1 | RRab | 14.841 | 13.887 | 0.951 | 0.560 | 0.6048761 | 6373.5087 | 0.604811(4) | 10:17:42.82 | 46:26:37.8 |
| V2 | RRab | 14.839 | 14.002 | 1.081 | 0.653 | 0.5326722 | 6373.5922 | 0.532621(5) | 10:17:39.98 | 46:26:37.9 |
| V5 | RRab | – | – | 1.231 | – | 0.511550 | 6373.4929 | 0.501345(4) | 10:17:41.28 | 46:25:06.3 |
| V8 | RRab | 14.760 | 13.884 | 0.475 | 0.303 | 0.6286573 | 6371.7232 | 0.628568(5) | 10:17:30.75 | 46:26:19.3 |
| V9 | RRab | 14.834 | 14.034 | 0.820 | 0.485 | 0.525530 | 6374.7383 | 0.525397(4) | 10:17:32.28 | 46:26:12.6 |
| V11 | RRc | 14.808 | 14.136 | 0.49 | 0.312 | 0.299049 | 6373.5632 | 0.299134(3) | 10:17:27.55 | 46:22:55.6 |
| V12 | RRab | – | – | – | – | 0.4955547 | 6373.5087 | 0.497369(4) | 10:17:29.03 | 46:22:55.8 |
| V13 | RRab | 14.883 | 14.070 | 0.894 | 0.603 | 0.5752145 | 6371.7280 | 0.574822(5) | 10:17:22.03 | 46:23:11.2 |
| V14 | RRab | 15.009 | – | 1.130 | – | 0.5092945 | 1216.7563 | 0.508941(5) | 10:17:22.42 | 46:22:31.5 |
| V17 | RRab | 14.820 | 13.960 | 0.840 | 0.566 | 0.565590 | 6371.5406 | 0.565844(5) | 10:17:38.29 | 46:25:07.2 |
| V18 | RRab Bl: | 14.812 | 13.983 | 0.732 | 0.494 | 0.539655 | 6373.7508 | 0.540442(5) | 10:17:39.40 | 46:25:07.0 |
| V21 | RRab | 14.858 | 13.979 | 0.723 | 0.446 | 0.566628 | 6371.7429 | 0.566754(5) | 10:17:46.23 | 46:22:29.4 |
| V22 | RRab | 14.753 | 13.897 | 0.833 | 0.503 | 0.6059882 | 6373.7086 | 0.605843(5) | 10:17:27.64 | 46:25:38.0 |
| V23 | RRab | 14.818 | 13.951 | 0.771 | 0.501 | 0.586775 | 6372.7320 | 0.586776(5) | 10:17:32.64 | 46:25:31.1 |
| V25 | RRab Bl: | 14.787 | 14.029 | 0.633 | 0.468 | 0.514804 | 6373.6127 | 0.514696(3) | 10:17:46.15 | 46:21:52.1 |
| V28 | RRab Bl: | 14.885 | 13.981 | 0.981 | 0.57–0.77 | 0.580025 | 6373.6570 | 0.579506(5) | 10:17:43.50 | 46:25:30.4 |
| V35 | RRab | 14.771 | 13.912 | 0.619 | 0.400 | 0.6155244 | 6371.5674 | 0.615523(5) | 10:17:36.29 | 46:22:43.2 |
| V36 | RRab | 14.751 | 14.051 | 0.655 | 0.341 | 0.484178 | 6373.6570 | 0.479576(5) | 10:17:27.01 | 46:24:53.0 |
| V37 | RRab | 14.785 | 13.932 | 0.746 | 0.476 | 0.575740 | 6372.6919 | 0.575145(4) | 10:17:30.69 | 46:25:55.7 |
| V38 | RRab | 14.836 | – | 0.734 | – | 0.509090 | 6373.4900 | 0.509405(5) | 10:17:31.42 | 46:25:41.1 |
| V39 | RRab | 14.879 | – | 1.244 | – | 0.483233 | 6373.4900 | 0.482872(5) | 10:17:41.23 | 46:23:49.7 |
| V40 | RRab | 14.854 | 13.948 | 0.403 | 0.279 | 0.643820 | 6373.6100 | 0.643744(4) | 10:17:28.00 | 46:23:35.9 |
| V44 | RRab | 14.803 | 13.933 | 0.687 | 0.411 | 0.6107344 | 6373.6991 | 0.610663(4) | 10:17:40.08 | 46:23:36.7 |
| V45 | RRab | 14.974 | 14.089 | 1.002 | 0.629 | 0.537460 | 6373.6127 | 0.538058(4) | 10:17:49.29 | 46:25:14.6 |
| V49 | RRab | 14.760 | 13.946 | 0.896 | 0.586 | 0.581020 | 6371.6775 | 0.580957(4) | 10:17:33.63 | 46:22:13.4 |
| V50 | RRab Bl: | 14.832 | 14.020 | 0.916 | 0.582 | 0.542178 | 6373.6745 | 0.542347(5) | 10:17:36.10 | 46:24:14.0 |
| V73 | RRab Bl | 14.816 | 14.061 | 1.06–1.38 | 0.740 | 0.519965 | 6373.5991 | 0.519538(5) | 10:17:25.20 | 46:23:15.2 |
| V76 | RRab | 14.821 | – | 0.623 | – | 0.526680 | 6373.4900 | 0.526736(4) | 10:17:31.29 | 46:25:23.6 |
| V77 | RRab | 14.693 | 13.891 | 1.079 | 0.529 | 0.567644 | 6373.5303 | 0.567393(7) | 10:17:36.13 | 46:25:36.1 |
| V80 | RRab | 14.650 | 13.910 | 0.810 | 0.618 | 0.589960 | 6373.5108 | 0.588706(7) | 10:17:43.07 | 46:24:16.8 |
| V90 | RRab | 14.753 | 13.935 | 1.081 | 0.58–0.66 | 0.606105 | 6373.6680 | 0.606387(6) | 10:17:34.95 | 46:24:33.3 |
| V92 | RRab | 14.736 | 13.934 | 1.083 | 0.557 | 0.539585 | 6373.5534 | 0.539528(6) | 10:17:22.70 | 46:25:11.0 |
| V98 | RRc | 14.759 | 14.053 | 0.38–0.46 | 0.243 | 0.335647 | 6373.5322 | 0.336259(5) | 10:17:25.14 | 46:25:20.0 |
| V100 | RRab | 14.813 | – | 0.986 | – | 0.548920 | 6373.4900 | 0.548513(6) | 10:17:36.14 | 46:24:27.9 |
| V102 | SX Phe | 17.164 | 16.574 | 0.060 | – | 6374.7421 | 0.045398(18) | 10:17:43.50 | 46:21:53.4 | |
| V103 | SX Phe | 17.424 | 16.804 | 0.054 | – | – | 6373.6570 | 0.037241(62) | 10:17:32.10 | 46:22:37.9 |
| V104 | SX Phe | 17.457 | 16.800 | 0.038 | – | – | 6371.7233 | 0.037510(73) | 10:17:36.60 | 46:23:03.4 |
| V105 | SX Phe | 17.506 | 16.894 | 0.060 | – | – | 6374.7621 | 0.037496(10) | 10:17:42.60 | 46:24:19.5 |
| V106 | SX Phe | 16.883 | 16.291 | 0.034 | – | – | 6371.6818 | 0.043552(13) | 10:17:36.00 | 46:24:38.2 |
| V107 | SX Phe | 16.982 | 16.307 | 0.126 | – | – | 6374.7503 | 0.040476(97) | 10:17:42.50 | 46:24:49.1 |
| V108 | SX Phe | 16.325 | 15.551 | 0.236 | – | – | 6373.6897 | 0.067349(55) | 10:17:40.20 | 46:25:07.8 |
| V109 | SX Phe | 17.176 | 16.498 | 0.302 | – | – | 6373.5394 | 0.054259(41) | 10:17:36.00 | 46:25:40.2 |
| V110 | SX Phe | 16.603 | 15.965 | 0.249 | – | – | 6372.5672 | 0.050137(19) | 10:17:48.10 | 46:25:53.4 |
| V117 | SR | – | – | – | – | – | – | – | 10:17:33.45 | 46:24:34.6 |
| V119 | EA | 16.218 | 15.45 | 0.04 | 0.04 | – | 6372.6511 | 1.2759 | 10:17:44.98 | 46:25:13.3 |
| V120 | SX Phe | 16.677 | 16.114 | 0.367 | – | – | 6372.6006 | 0.088162(46) | 10:17:38.30 | 46:25:38.0 |
| V121 | SX Phe | 17.312 | 16.475 | 0.127 | – | – | 6373.5602 | 0.037369(18) | 10:17:36.58 | 46:24:43.2 |
| V122a | SX Phe | 18.107 | 17.324 | 0.053 | – | – | 6371.7700 | 0.067279(48) | 10:17:40.15 | 46:25:12.7 |
| V123a | SX Phe | 17.480 | 16.804 | 0.058 | – | – | 6374.7657 | 0.034895(8) | 10:17:48.12 | 46:25:32.2 |
| V124a | SX Phe | 17.245 | 16.607 | 0.022 | – | – | 6372.6720 | 0.040128(32) | 10:17:30.22 | 46:26:09.1 |
anewly found in this work.
0.3.1 The Color-Magnitude diagram
The CMD of the cluster is shown in Fig. 2, where the location of the known and the newly discovered variables is marked. Individual stars are discussed in the following section. The red-dashed area is an arbitrarily defined blue stragglers region were SX Phe variables are expected to be found. Indeed, examination of the light curves of all stars in this region confirmed the nature of all previously known SX Phe stars and led to the discovery of three more (see § 0.3.3). The finding chart of all variables in Table 1 is in Fig. 3. Given the differential nature of the reddening in front of the cluster we made no attempt to deredden the CMD. An interesting and successful exercise of this procedure may be found in LS03.
0.3.2 RR Lyrae stars
A comparison of the intensity-weighted means and (Table 1) and those of LS03 for 27 RR Lyrae stars in common indicates that, on average, our values are 0.02 mag fainter and the values are 0.004 mag brighter, i.e., well within photometric errors. Therefore, the periods of the RR Lyrae stars were calculated by combining the data from LS03 obtained in 1999, with our photometry using the string-length method (Burke, et al. 1970; Dworetsky 1983). The 14 year time-base allows a precise determination of the periods. In Table 1 the new periods and epochs are listed, and for comparison the periods of LS03 are included as well. The and light curves of RRab and RRc stars are shown in Figs. 4 and 6 respectively, having been phased by using our refined periods and the epochs listed in Table 1. In the light curves, observations from different nights are plotted with different colors for clarity; data from LS03 are also plotted in light gray. We can see that the LS03 light curves and ours match very well and are properly phased with the new periods. Later in this paper, when dealing with the Fourier decomposition, we shall exclusively use our data except in a few cases where data from LS03 nicely complete a light curve not properly covered otherwise, e.g., V14, V38, or V39. Plotting both data sets unveils long-term amplitude modulations of the Blazhko type not easily evident in our four-night light curves. These probable Blazhko variables, V18, V25, V28, V50, and V73 are labeled “Bl” or “Bl:” in Table 1.


0.3.3 SX Phe stars
Since our photometry spans only four nights and the seeing was not particularly good, we refrained from performing the statistical approach we followed in previous papers (e.g., Arellano Ferro et al. 2013a,b; Figuera Jaimes et al. 2013) to identify new variable stars in our light curve collection. Instead, we examined the light curves of all stars lying on the blue straggler region shown in the CMD of Fig. 2. This procedure allowed us to recover all known or suspected SX Phe stars in the CVSGC, as well as to find three new ones, which we labeled V122, V123, and V124. These stars will be discussed in detail later in this paper. The light curves of the 14 currently known SX Phe stars in the cluster are shown in Fig. 7 and were phased with main periods calculated with period04 (Lenz & Breger 2005). The ephemerides and amplitudes of the main frequencies are listed in Table 1.
The appearance of many of the light curves strongly suggests the presence of multiple excited modes. In fact, as reported in the discovering paper (Mazur et al. 2003), several frequency modes can be identified in the majority of these SX Phe stars (see their Table 3) and therefore we were motivated to carry out an independent search of active modes in them. Although our photometry did not permit the detection of the many secondary frequencies reported by Mazur et al. (2003), we could confirm the principal frequencies and, in some stars, we were able to find secondary frequencies which led to the identification of the modes. Our frequency findings are given in Table 2.
Variables V120 and V121 are labeled as “SXP?” in the 2012 CVSGC. This classification comes most likely from Table 8 of LS03, where these stars (776 and 941 respectively) are labeled as “ Scuti?”. Given their frequencies in Table 2 and their position in the blue stragglers region, we confirm the SX Phe character of both stars. We also performed a frequency analysis of the new SX Phe stars V122, V123, and V124. In stars V103, V106, and V108 two frequencies were detected and identified with the radial fundamental and first overtone modes, exhibiting ratios very close to the predicted value of 0.783 (see Santolamazza et al. 2001; Jeon et al. 2003; Poretti et al. 2005). One of the pulsating modes of V107 seems to be non-radial.

| Variable | Mode id.b | ||||||
|---|---|---|---|---|---|---|---|
| (d-1) | (mag) | (d) | |||||
| V102 | 17.164 | 0.581 | 0.30 | 22.027 | 0.060 | 0.045398(18) | :F |
| V103 | 17.423 | 0.611 | 0.23 | 26.852 | 0.054 | 0.037241(11) | :F |
| 34.367 | 0.045 | 0.029097(8) | :1O; =0.781 | ||||
| V104 | 17.457 | 0.656 | 0.23 | 26.659 | 0.038 | 0.037510(43) | F |
| V105 | 17.506 | 0.586 | 0.23 | 26.670 | 0.060 | 0.037496(10) | F |
| V106 | 16.883 | 0.588 | 0.11 | 22.961 | 0.034 | 0.043552(13) | :F |
| 29.240 | 0.023 | 0.034200(39) | :1O; =0.785 | ||||
| V107 | 16.982 | 0.667 | 0.23 | 24.706 | 0.126 | 0.040476(97) | :F |
| 25.245 | 0.081 | 0.039610(33) | :non-radial | ||||
| V108 | 16.325 | 0.754 | 0.11 | 14.848 | 0.236 | 0.067349(55) | :F |
| 19.073 | 0.122 | 0.052430(92) | :1O; =0.778 | ||||
| V109 | 17.176 | 0.643 | 0.29 | 18.430 | 0.302 | 0.054259(41) | :F |
| V110 | 16.603 | 0.624 | 0.23 | 19.945 | 0.249 | 0.050137(19) | :F |
| V120 | 16.677 | 0.548 | 0.33 | 11.342 | 0.367 | 0.088162(46) | :F |
| V121 | 17.312 | 0.832 | 0.23 | 26.760 | 0.127 | 0.037369(18) | :F |
| V122 | 18.107 | 0.787 | – | 14.863 | 0.053 | 0.067279(48) | :F |
| V123 | 17.480 | 0.700 | 0.23 | 28.658 | 0.058 | 0.034895(8) | :F |
| V124 | 17.245 | 0.634 | 0.23 | 24.920 | 0.022 | 0.040128(32) | :F |
aSee 0.5 for a discussion on the individual reddenings; bF: Fundamental mode; 1O: First overtone

0.3.4 Comments on individual variables
In this section we only discuss those variable stars that deserve particular comments.
V5, V11, V12, V13, V39, V76, V77, V80, V98, V100. As mentioned before, in the reported observations the seeing appears to worsen along the night. This led to additional scatter in the light curves of these stars due to contamination by neighbouring stars, particularly near the minima. We thus either neglected as much as possible or did not include them in the further analysis (e.g., stars V5 and V12).
V14. Our phase coverage for this light curve is incomplete, and as a result, our values of and are biased. We therefore used the values from LS03 to plot the star in the CMD and included LS03 data to complete the light curve in order to perform Fourier decomposition.
V25 and V36. The shapes of the light curves of these stars are peculiar, showing very small amplitude for their period. In the case of V25, the addition of the LS03 light curve hints at the presence of amplitude modulations. For star V36, LS03 data are very scattered and do not follow our light curve. These stars will stand out as peculiar in the Bailey diagram discussed later (§ 0.4.1).
V117. The light curve of this star, which is the brightest of the cluster in our FoV, noticeably degraded after the post-calibration process described in § 0.2.2, which seems to have failed in this particular case. Hence, the light curve shown in Fig. 8 was not post-calibrated. The intra-night variations are likely not real but originated in the seeing variations. The real variation is reflected as a gradual dimming over the four nights.
V119. Fig. 9 shows the light curve of this eclipsing binary phased with a period of 1.2759 days. With our data it is not possible to distinguish between this period and another of 0.595941 days.
0.4 Physical parameters of RR Lyrae stars
The shape of the light curve of a RR Lyrae star carries information of some of its physical parameters of astrophysical relevance such as [Fe/H], log, and log . These can be calculated by means of the Fourier decomposition of the light curve, which is performed by fitting it with a series model of the form:
| (3) |
where is the magnitude at time , is the period, and is the epoch. A linear minimization routine is used to derive the best fit values of the amplitudes and phases of the sinusoidal components. From the amplitudes and phases of the harmonics in Eq. 3, the Fourier parameters, defined as , and , are computed.


It has been shown that semi-empirical calibrations can correlate the above Fourier parameters with the physical quantities of interest. Although numerous calibrations exist in the literature, in previous papers we have argued in favour of those developed by Jurcsik & Kovács (1996) and Kovács & Walker (2001) for the iron abundance and absolute magnitude of RRab stars, and those of Morgan, Wahl & Wieckhorts (2007) and Kovács (1998) for RRc stars. The effective temperature was estimated using the calibration of Jurcsik (1998). These calibrations and their zero points have been discussed in detail in Arellano Ferro et al. (2013a).
Due to the presence of differential reddening, before estimating the distance to the cluster from its RR Lyrae stars it is necessary to individually correct their magnitudes. We estimated the individual color excesses using the method originally proposed by Sturch (1966), and further investigated by Blanco (1992), Mateo et al. (1995), and Guldenschuh et al. (2005). Guldenschuh et al. (2005) concluded that, for RRab stars, the intrinsic color between phases 0.5 and 0.8 is mag. We have already successfully applied this method to the RR Lyrae stars of another cluster with heavy differential reddening, NGC 6333 (Arellano Ferro et al. 2013a). In the case of the present work, however, we noted that in several of the RRab light curves in Fig. 4 the bump appears in phases smaller than 0.8, so we restricted the calculation of and to the 0.5–0.7 range. Then we calculated . The resulting reddenings for the RRab stars are listed in column 10 of Table 3. Values of for stars with scanty or peculiar data in the above phase range (e.g., V50, V77, and V80) are marked with a colon, and for them we instead adopted the mean reddening value in subsequent calculations. The same approach was followed by LS03 and their values are listed in their Table 6. A comparison of both sets of reddenings for the 14 stars in common reveals that, with a scatter of 0.03 mag, our values are on average 0.03 mag smaller. The average of our reddenings is , which compares well with the value of LS03 for stars within 2 arcmin of the cluster center.
The value of and the Fourier light-curve fitting parameters for 24 RRab and 2 RRc stars with no apparent signs of amplitude modulations (see Fig. 4) are listed in Table 3. These Fourier parameters and the above mentioned calibrations were used in turn to calculate the physical parameters listed in Table 4. The absolute magnitude was converted into luminosity with ). The bolometric correction was calculated using the formula given by Sandage & Cacciari (1990). We adopted mag.
Before the iron calibration of Jurcsik & Kovács (1996) for RRab stars can be applied to the light curves, a “compatibility condition parameter” should be calculated. For the definition of see the works of Jurcsik & Kovács (1996) and Kovács & Kanbur (1998). These authors advise to consider only light curves for which . The values of for each of the RR Lyrae stars are also listed in Table 3. Most of them fulfill the criterion and, in order to maintain the size of our sample reasonable, we did not exclude stars V1–V14, which have values marginally larger than 3.0. This practice has been followed by some previous authors (e.g. Arellano Ferro et al. 2013a; Kains et al. 2013, Cacciari et al. 2005). Stars V25 and V36 show large uncertainties in their Fourier coefficients as well as large values of , so they were not considered in the calculation of physical quantities.
| Variable | |||||||||||
| ID | ( mag) | ( mag) | ( mag) | ( mag) | ( mag) | ||||||
| RRab | |||||||||||
| V1 | 14.841(2) | 0.331(2) | 0.171(2) | 0.106(2) | 0.065(2) | 4.030(19) | 8.277(30) | 6.204(45) | 0.301 | 7 | 5.2 |
| V2 | 14.839(2) | 0.357(3) | 0.171(2) | 0.144(2) | 0.083(2) | 3.721(18) | 7.906(24) | 5.951(36) | 0.247 | 10 | 3.1 |
| V8 | 14.760(1) | 0.173(1) | 0.085(1) | 0.049(1) | 0.017(1) | 3.962(19) | 8.474(29) | 6.645(72) | 0.214 | 9 | 7.6 |
| V9 | 14.834(2) | 0.318(3) | 0.092(3) | 0.030(3) | 0.016(2) | 3.864(28) | 8.122(46) | 5.872(67) | 0.201 | 7 | 3.8 |
| V13 | 14.883(4) | 0.296(2) | 0.148(2) | 0.109(2) | 0.063(2) | 3.953(21) | 8.285(31) | 6.302(43) | 0.186 | 9 | 4.9 |
| V14 | 15.009(3) | 0.400(4) | 0.186(4) | 0.134(5) | 0.095(3) | 3.761(33) | 7.910(47) | 5.824(74) | 0.223 | 9 | 5.4 |
| V17 | 14.820(2) | 0.291(3) | 0.132(3) | 0.095(3) | 0.064(2) | 3.918(26) | 8.262(37) | 6.433(54) | 0.224 | 7 | 1.4 |
| V21 | 14.858(1) | 0.267(1) | 0.115(1) | 0.080(1) | 0.047(1) | 3.991(11) | 8.374(17) | 6.484(26) | 0.239 | 7 | 1.2 |
| V23 | 14.818(1) | 0.268(2) | 0.132(2) | 0.091(2) | 0.055(2) | 4.012(17) | 8.283(25) | 6.478(37) | 0.222 | 7 | 1.3 |
| V25 | 14.787(5) | 0.278(4) | 0.107(5) | 0.062(4) | 0.033(6) | 3.882(55) | 8.179(137) | 6.289(260) | – | 10 | 12.1 |
| V35 | 14.771(1) | 0.228(1) | 0.104(1) | 0.065(1) | 0.034(1) | 4.068(15) | 8.482(23) | 6.980(39) | 0.215 | 7 | 1.2 |
| V36 | 14.751(4) | 0.280(6) | 0.093(6) | 0.037(5) | 0.016(5) | 3.712(52) | 7.773(139) | 5.102(312) | – | 8 | 9.4 |
| V37 | 14.785(1) | 0.312(1) | 0.121(1) | 0.067(1) | 0.039(1) | 4.063(9) | 8.353(14) | 6.392(24) | 0.228 | 7 | 2.2 |
| V38 | 14.836(1) | 0.303(2) | 0.133(2) | 0.077(2) | 0.039(2) | 3.818(18) | 8.068(30) | 5.963(52) | 0.18: | 9 | 1.6 |
| V39 | 14.879(2) | 0.430(3) | 0.193(3) | 0.150(3) | 0.101(3) | 3.804(20) | 7.899(27) | 5.839(36) | 0.228 | 9 | 1.0 |
| V40 | 14.854(1) | 0.162(1) | 0.060(1) | 0.033(1) | 0.012(1) | 4.182(19) | 8.611(31) | 7.287(68) | 0.235 | 5 | 2.7 |
| V45 | 14.974(3) | 0.372(5) | 0.140(5) | 0.115(5) | 0.081(5) | 3.915(43) | 8.095(57) | 5.952(81) | 0.249 | 10 | 2.6 |
| V49 | 14.760(1) | 0.355(2) | 0.139(2) | 0.090(2) | 0.058(2) | 4.049(16) | 8.180(24) | 5.978(36) | 0.213 | 7 | 2.3 |
| V50 | 14.832(2) | 0.318(4) | 0.135(3) | 0.104(3) | 0.076(4) | 3.841(34) | 8.018(46) | 6.025(62) | 0.18: | 10 | 1.0 |
| V76 | 14.821(2) | 0.249(3) | 0.112(3) | 0.058(3) | 0.029(3) | 3.964(31) | 8.427(54) | 6.828(80) | 0.200 | 8 | 1.9 |
| V77 | 14.693(2) | 0.254(2) | 0.153(2) | 0.097(2) | 0.052(3) | 4.490(23) | 9.115(37) | 7.200(60) | 0.19: | 8 | 2.5 |
| V80 | 14.650(2) | 0.241(3) | 0.137(3) | 0.101(2) | 0.063(3) | 4.187(27) | 8.539(39) | 6.626(55) | 0.17: | 8 | 2.3 |
| V90 | 14.753(2) | 0.332(4) | 0.191(4) | 0.139(4) | 0.085(4) | 3.986(30) | 8.153(44) | 5.986(65) | 0.213 | 9 | 2.5 |
| V100 | 14.813(2) | 0.324(3) | 0.152(2) | 0.128(2) | 0.078(2) | 3.911(23) | 7.999(29) | 5.886(43) | 0.210 | 9 | 1.9 |
| RRc | |||||||||||
| V11 | 14.802(1) | 0.235(2) | 0.060(2) | 0.027(2) | 0.015(2) | 4.589(40) | 3.111(77) | 1.891(158) | 0.23 | 4 | |
| V98 | 14.759(2) | 0.191(1) | 0.018(1) | 0.010(1) | 0.001(1) | 4.826(102) | 3.711(187) | 4.653(742) | 0.23 | 4 | |
| Star | [Fe/H]ZW | log | log | D (kpc) | |||
|---|---|---|---|---|---|---|---|
| RRab | |||||||
| V1 | 1.589(28) | 0.523(3) | 3.806(9) | 1.691(1) | 4.75 | 0.69(7) | 5.66(1) |
| V2 | 1.665(23) | 0.628(4) | 3.809(8) | 1.649(2) | 4.89 | 0.71(7) | 5.25(1) |
| V8 | 1.487(25) | 0.627(1) | 3.800(10) | 1.649(1) | 4.94 | 0.62(8) | 5.34(1) |
| V9 | 1.436(43) | 0.590(4) | 3.814(10) | 1.664(2) | 5.30 | 0.71(9) | 4.81(2) |
| V13 | 1.468(29) | 0.608(3) | 3.808(8) | 1.657(1) | 5.40 | 0.66(7) | 5.064(1) |
| V14 | 1.572(44) | 0.607(6) | 3.815(11) | 1.657(2) | 5.52 | 0.73(9) | 5.115(2) |
| V17 | 1.452(35) | 0.616(4) | 3.808(9) | 1.653(2) | 5.03 | 0.67(7) | 5.01(1) |
| V21 | 1.348(16) | 0.631(1) | 3.809(7) | 1.647(1) | 4.98 | 0.65(6) | 5.02(1) |
| V23 | 1.511(23) | 0.610(3) | 3.805(8) | 1.656(1) | 5.06 | 0.66(6) | 5.12(1) |
| V35 | 1.435(22) | 0.595(1) | 3.801(8) | 1.662(1) | 5.03 | 0.66(6) | 5.27(1) |
| V37 | 1.419(13) | 0.549(1) | 3.809(7) | 1.680(1) | 5.08 | 0.69(6) | 5.09(1) |
| V38 | 1.425(28) | 0.672(3) | 3.814(9) | 1.631(1) | 4.93 | 0.68(7) | 4.72(2) |
| V39 | 1.484(25) | 0.628(4) | 3.818(8) | 1.649(2) | 5.11 | 0.73(7) | 4.58(1) |
| V40 | 1.422(29) | 0.608(1) | 3.796(10) | 1.657(1) | 5.05 | 0.64(8) | 5.41(1) |
| V45 | 1.504(54) | 0.580(7) | 3.813(11) | 1.668(3) | 5.30 | 0.70(9) | 4.87(2) |
| V49 | 1.595(23) | 0.513(3) | 3.809(8) | 1.695(1) | 5.22 | 0.71(7) | 5.53(1) |
| V50 | 1.594(43) | 0.627(5) | 3.809(10) | 1.649(2) | 5.02 | 0.69(8) | 5.30(2) |
| V76 | 1.153(51)a | 0.692(4) | 3.812(11) | 1.623(2) | 5.03 | 0.65(9) | 4.81(2) |
| V77 | 0.660(35)a | 0.657(3) | 3.820(10) | 1.637(1) | 4.65 | 0.55(6) | 5.03(1) |
| V80 | 1.282(37)a | 0.646(4) | 3.808(9) | 1.642(2) | 4.58 | 0.61(7) | 5.14(2) |
| V90 | 1.711(41) | 0.547(6) | 3.805(10) | 1.681(2) | 5.12 | 0.68(8) | 5.66(2) |
| V100 | 1.638(27) | 0.629(4) | 3.809(8) | 1.648(2) | 5.09 | 0.68(7) | 5.34(1) |
| Weighted mean | 1.483(6) | 0.604(1) | 3.808(2) | 1.658(1) | 5.00 | 0.67(2) | 5.12(1) |
| 0.098 | 0.045 | 0.005 | 0.016 | 0.22 | 0.03 | 0.25 | |
| RRc | |||||||
| V11 | 1.46(14) | 0.574(2) | 3.868(1) | 1.670(1) | 5.04 | 0.57(1) | 4.15(4) |
| V98 | 1.55(37) | 0.590(4) | 3.864(1) | 1.664(2) | 4.91 | 0.50(1) | 4.78(12) |
| Weighted mean | 1.47(12) | 0.576(1) | 3.867(1) | 1.667(2) | 5.03 | 0.56(1) | 4.21(4) |
| 0.06 | 0.011 | 0.003 | 0.016 | 0.09 | 0.05 | 0.45 | |
aValue not considered in the average.
The resulting physical parameters of the RR Lyrae stars are summarized in Table 4. The mean values given in the bottom of the table are weighted by the statistical uncertainties. Also listed are the corresponding distances. Given the period, luminosity, and temperature for each RR Lyrae star, its mass and radius can be estimated from the equations: (van Albada & Baker 1971), and = respectively. The masses and radii given in Table 4 are expressed in solar units.
0.4.1 Bailey diagram and Oosterhoff type
The Bailey diagram is a plot of the period versus the amplitude for RR Lyrae stars; it offers insight on the Oosterhoff type of a globular cluster and helps to identify possible peculiar amplitude stars for a given period. The Bailey diagram of M3 is usually used as a reference for OoI clusters (see Fig. 4 of Cacciari et al. 2005). Fig. 10 displays the corresponding distribution of the RR Lyrae stars in NGC 3201 with a good light curve coverage. The continuous and segmented lines in the top diagram represent, respectively, the mean distributions of non-evolved and evolved stars in M3 according to Cacciari et al. (2005). In recent papers we compared these loci with the distributions of RR Lyrae stars in the OoII clusters NGC 5024 (Arellano Ferro et al. 2011, Fig. 7), NGC 6333 (Arellano Ferro et al. 2013a, Fig. 17), and NGC 7099 (Kains et al. 2013, Fig. 10). We, like Cacciari et al. (2005), found that the amplitudes of RRab stars follow the loci of the candidate evolved stars in M3, i.e., the segmented line; as for the RRc stars, however, we differ from Cacciari et al. (2005) in that the distributions in the OoII clusters NGC 5024 and NGC 6333 do not follow the defined trend in M3 RRc stars but are rather scattered, and that their distribution is altered by the presence of Blazhko-like amplitude modulations, particularly in the case of NGC 5024 (Arellano Ferro et al. 2012). It is clear from this figure that the RRab and RRc stars in NGC 3201 follow the trend found in M3, which identifies NGC 3201 as being of the type OoI. In Arellano Ferro et al. (2011) the distribution of amplitudes in the OoII cluster NGC 5024 was also defined and is shown as a black segmented line in the bottom panel of Fig. 10. It has the eqution:
| (4) | |||||
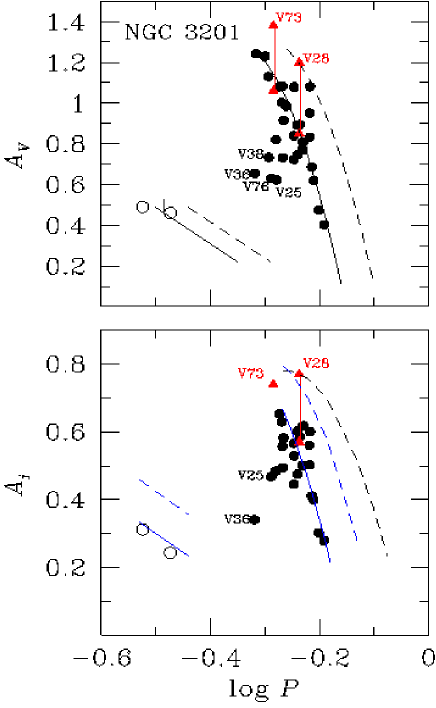
Also in the bottom panel of Fig. 10 the distribution of the amplitudes of RRab and RRc stars in NGC 3201 is shown. The blue locus are those calculated by Kunder et al. (2013) for the OoI clusters for the RRab and RRc stars (solid lines) and for the OoII clusters (segmented lines). Their OoI locus represents well the distribution in NGC 3201. We note the difference in the locus of OoII clusters proposed by Kunder et al. (2013) and the one observed by Arellano Ferro et al. (2011; 2013a) in NGC 5402 and NGC 6333 respectively.
0.5 SX Phe stars: The Period-Luminosity relation
The Period-Luminosity relation for SX Phe stars (PLSX) has recently been calibrated by several authors, notably Poretti et al. (2008) and McNamara (1997) for Galactic and extragalactic Scuti and SX Phe stars. In globular clusters the PLSX has been studied by Jeon et al. (2003) and Arellano Ferro et al. (2011) for NGC 5024, and McNamara (2000) for Cen. The calibrations of Arellano Ferro et al. (2011) for the fundamental mode of SX Phe stars in NGC 5024 in the V and I filters are of the form:
| (5) |
and
| (6) |
These calibrations have been used to calculate the distance to globular clusters with SX Phe stars independently of their RR Lyrae population (e.g., Arellano Ferro et al. 2013a;b).
In the top panel of Fig. 11 the distribution of the SX Phe stars is shown in the plane. To deredden them we adopted the mean reddening estimated for the RR Lyrae stars in § 0.3.2, . The continuous line corresponds to the calibration for the fundamental mode of Eq. 5 scaled to the distance of 5.0 kpc, obtained from the 22 RRab stars in Table 4 (see § 0.4).
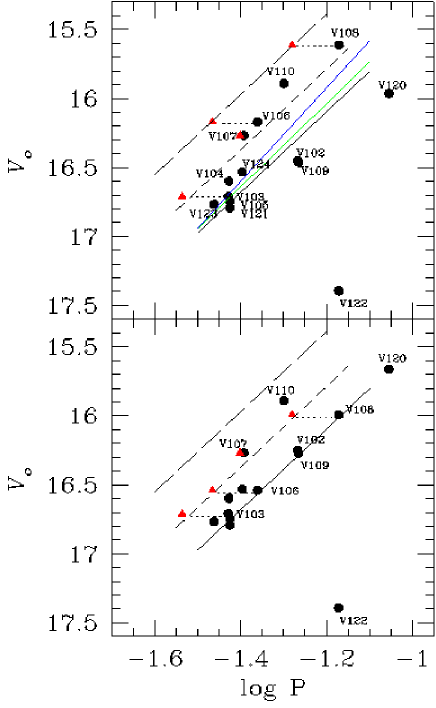
The dotted and dashed lines correspond to the locus of the first and second overtones assuming the ratios 0.783 and 0.571 (see Santolamazza et al. 2001 or Jeon et al. 2003; Poretti et al. 2005). It is clear that the distribution of SX Phe stars shows scatter, which is most likely due to differential reddening. However, we note that the group around V103 matches the fundamental mode rather well. It is also worth paying attention to the position of the three double-mode stars V103, V106, and V108, for which we also plotted the first overtone period with red triangles. In these stars we detected the fundamental and first overtone frequencies, identified as such from their ratio (§ 0.3.3). To reconcile the positions of the stars with the pulsation loci, one may assume a slightly different reddening for each star. In this way we obtained the bottom panel of Fig. 11, and the procedure was as follows. The two double-mode stars V106 and V108 were shifted to the fundamental mode line by modifying their reddening to in both cases. Note that the corresponding first overtone mode, represented by the red triangles, also matches well the first overtone locus for these double-mode stars. Small reddening adjustments were also applied to stars V102, V109, and V120. The estimated reddening values for all SX Phe stars are listed in the 4th column of Table 2. Star V122 is much too faint for its period, and an unacceptable large value of the reddening would be required to bring it to the fundamental locus. For these reasons, we believe that this SX Phe star is not a cluster member.
We note at this point that the slopes of the and P–L relations for NGC 3201 seem consistent with those observed in NGC 5024 (Arellano Ferro et al. 2011) and also with the slopes observed in NGC 5024 by Jeon et al. (2003) (green line in Fig. 11) and in NGC 288 (Arellano Ferro et al. 2013b). The slope found by Cohen & Sarajedini (2012) for the fundamental mode is a little steeper (blue line in Fig. 11). Both Jeon et al.’s (2003) and Cohen & Sarajedini’s (2012) calibrations are consistent with our distance determination of 5.0 kpc; however, if these calibrations are preferred, the individual reddenings of the SX Phe discussed above would have to be slightly modified.
| Variable | Filter | HJD | ||||||||
|---|---|---|---|---|---|---|---|---|---|---|
| Star ID | (d) | (mag) | (mag) | (mag) | (ADU s-1) | (ADU s-1) | (ADU s-1) | (ADU s-1) | ||
| V1 | 2456371.52286 | 15.126 | 16.348 | 0.001 | 6014.959 | 4.635 | 3115.105 | 3.956 | 0.9966 | |
| V1 | 2456371.52599 | 15.137 | 16.359 | 0.001 | 6014.959 | 4.635 | 3157.769 | 3.334 | 1.0006 | |
| ⋮ | ⋮ | ⋮ | ⋮ | ⋮ | ⋮ | ⋮ | ⋮ | ⋮ | ⋮ | |
| V1 | 2456371.51722 | 14.053 | 15.830 | 0.002 | 6831.708 | 7.004 | 2176.444 | 9.449 | 1.0030 | |
| V1 | 2456371.51972 | 14.017 | 15.793 | 0.002 | 6831.708 | 7.004 | 2018.446 | 9.645 | 1.0047 | |
| ⋮ | ⋮ | ⋮ | ⋮ | ⋮ | ⋮ | ⋮ | ⋮ | ⋮ | ⋮ | |
| V2 | 2456371.52286 | 14.457 | 15.685 | 0.001 | 2795.928 | 4.714 | 2514.549 | 4.843 | 0.996 | |
| V2 | 2456371.52598 | 14.477 | 15.706 | 0.001 | 2795.928 | 4.714 | 2424.449 | 3.992 | 1.0006 | |
| ⋮ | ⋮ | ⋮ | ⋮ | ⋮ | ⋮ | ⋮ | ⋮ | ⋮ | ⋮ | |
| V2 | 2456371.51722 | 13.687 | 15.466 | 0.002 | 4060.533 | 7.058 | 2464.694 | 11.144 | 1.0030 | |
| V2 | 2456371.51972 | 13.799 | 15.578 | 0.002 | 4060.533 | 7.058 | 1827.676 | 11.074 | 1.0047 | |
| ⋮ | ⋮ | ⋮ | ⋮ | ⋮ | ⋮ | ⋮ | ⋮ | ⋮ | ⋮ |
We may conclude that the SX Phe stars indicate a distance to the cluster consistent with that derived by the Fourier decomposition of the RRab stars, i.e., 5.0 kpc, and that by invoking adequate values for the differential reddening of these stars it can be argued that their main frequency corresponds to the fundamental mode, and that V103, V106, and V108 are double-mode radial pulsators.
0.6 Summary of results
We have presented the results of the Fourier decomposition of RR Lyrae stars and the frequency analysis of SX Phe stars in the central parts of the globular cluster NGC 3201, based on difference image analysis of a CCD time-series.
The differential reddening of the cluster was addressed and individual reddenings for the RRab stars were estimated from curves using the method outlined and calibrated most recently by Guldenschuh et al. (2005). We found an average from a sample of 18 RRab stars with adequate phase coverage. In the calculation of the distance, however, we used the individual reddenings.
Iron abundance and distance were calculated from the light curve Fourier decomposition of 22 RRab and 2 RRc stars contained in the FoV of our images without obvious signs of amplitude modulation. We found, for the RRab stars, a mean iron abundance [Fe/H] (systematical uncertainty) and a mean distance of kpc (systematical). For the RRc stars the results were, respectively: [Fe/H] and kpc (both are also systematical uncertainties). Since these results come from independent calibrations for the RRab and RRc stars, they can be considered as two independent determinations of metallicity and distance. The iron abundance in the scale of Carretta et al. (2009), transformed using the equation:
| (7) | |||||
is [Fe/H]. To the best of our knowledge no previous estimates of [Fe/H] from Fourier decomposition of the RR Lyrae light curves exist for this cluster. Other estimates of [Fe/H] include: and calculated by LS03 from their and CMDs, (Rutledge et al. 1997), and (Zinn & West 1984). Within the uncertainties, our metallicity [Fe/H] is in good concordance with these published values.
The calculation of the cluster distance by LS03 was made via the globular cluster and [Fe/H] correlation (e.g., Chaboyer 1999) for RR Lyrae stars, and yielded kpc for [Fe/H]. This is in good agreement with the result of our RR Lyrae Fourier decomposition. LS03 also calculated the cluster distance based on two SX Phe stars, #752 and #1019 (in their numeration) which, judging from their mean magnitudes and periods, very likely correspond to variables V110 and V109, respectively. They used the PLSX calibration of Petersen & Hog (1998) and derived a distance of kpc. Our own calculation is based on a larger number of SX Phe, a more complete mode identification for most of them, some assumptions on the differential reddening, and the use of a different P-L calibration (see § 0.5). It was shown that, in the P-L distribution of SX Phe stars, both the fundamental and the first overtone modes loci are consistent with the average distance kpc found from the RR Lyrae stars.
Finally, we discovered three new SX Phe stars, numbered V122, V123, and V124. Very likely, star V122 is not a cluster member but a background object. Three clear radial double-mode SX Phe stars have been identified, i.e., V103, V106, and V108. Star V107 seems to be a double-mode star with a non-radial component.
APENDIX A
Our and photometry for all variable stars in the FoV of our images is only available in electronic form. Here, in Table 5, we show only a portion of it for guidance regarding its form and content.
We warmly thank Dr. Daniel Bramich for allowing us the use DanDIA and for guiding our reduction process, as well as for useful and opportune comments. We are thankful to our referee Christine Clement for her constructive suggestions and comments. AAF acknowledges Roberto Figuera Jaimes for his valuable help in the first stages of the data reduction. We are indebted to the CONACyT (México) and MINCyT (Argentina) for financial support through the interchange project 188769 (MX/12/09). AAF acknowledges the support from DGAPA-UNAM grant through project IN104612, to the European Southern Observatory (Garching), and to the Observatorio Astronómico of the Universidad Nacional de Córdoba (Argentina) for warm hospitality during the different stages of this work. We have made an extensive use of the SIMBAD and ADS services, for which we are thankful.
References
- (1) Arellano Ferro, A., Bramich, D.M., Figuera Jaimes, R., et al., 2013a, MNRAS, 434, 1220
- (2) Arellano Ferro, A., Bramich, D.M., Giridhar, S., et al., 2013b, AcA, 63, 429
- (3) Arellano Ferro, A., Bramich, D. M., Figuera Jaimes, R., Giridhar, S., Kuppuswamy, K., 2012, MNRAS, 420, 1333
- (4) Arellano Ferro, A., Figuera Jaimes, R., Giridhar, Sunetra, Bramich, D. M., Hernández Santisteban, J. V., Kuppuswamy, K., 2011, MNRAS, 416, 2265
- (5) Bailey, S.I., 1922, Harvard Circ., 234, 1
- (6) Blanco, V. M., 1992, AJ, 104, 734
- (7) Bramich D. M., 2008, MNRAS, 386, L77
- (8) Bramich, D. M.; Horne, K.,; Albrow, M. D., et al., 2013, MNRAS, 428, 2275
- (9) Bramich D. M., Figuera Jaimes R., Giridhar S., Arellano Ferro A., 2011, MNRAS, 413, 1275
- (10) Bramich, D.M., Freudling, W., 2012, MNRAS, 424, 1584
- (11) Burke E.W., Rolland W.W., and Boy W.R., 1970, Journal of the Royal Astronomical Society of Canada, 64, 353
- (12) Cacciari C., Corwin T. M., Carney B. W., 2005, AJ, 129, 267
- (13) Carretta, E., and Bragaglia, A., Gratton, R., D’Orazi, V., and Lucatello, S., 2009, A&A, 508, 695
- (14) Clement, C.M., Muzzin, A., Dufton, Q., Ponnampalam, T., Wang, J., Burford, J., Richardson, A., Rosebery, T., Rowe, J., Sawyer-Hogg, H., 2001, AJ, 122, 2587.
- (15) Cohen, R.e., Sarajedini, A., 2012, MNRAS, 419, 342
- (16) Chaboyer, B., 1999, in Post-Hipparcos cosmic candles, ed. A. Heck & F. Caputo (Dordrecht: Kluwer), p. 111
- (17) Dowse, M., 1940, Harvard Bull., 913, 17
- (18) Dworetsky, M.M., 1983, MNRAS, 203, 917
- (19) Figuera Jaimes, R., Arellano Ferro, A., Bramich, D. M., Giridhar, S., Kuppuswamy, K., 2013, A&A, 556, A20
- (20) Guldenschuh, K. A., Layden, A. C., Wan, Y., et al. 2005, PASP, 117, 721
- (21) Jeon, Y.-B., Lee M.G., Kim S.-L, Lee H., 2003, AJ, 125, 3165
- (22) Jurcsik, J., 1998, A&A, 333, 571
- (23) Jurcsik, J., Kovács G., 1996, A&A, 312, 111
- (24) Kains N., Bramich D. M., Arellano Ferro A., et al., 2013, A&A, 555, 36
- (25) Kains N., Bramich D. M., Figuera Jaimes R., Arellano Ferro A., Giridhar S., Kuppuswamy K., 2012, A&A, 548, 92
- (26) Kovács, G., 1998, Mem. Soc. Astron. Ital., 69, 49
- (27) Kovács, G., Kanbur, S.M., 1998, MNRAS, 295, 834
- (28) Kovács, G., Walker, A.R., 2001, A&A, 371, 579
- (29) Kunder, A., Stetson, P.B., Catelan, M., Walker, A.R., Amigo, P., 2013, AJ, 145, 33
- (30) Landolt, A.U., 1973, AJ, 78, 959
- (31) Layden, A.C., Sarajedini, A. 2003, AJ, 125, 208 (LS03)
- (32) Lenz, P., Breger M., 2005, Communications in Asteroseismology, 146, 53
- (33) Lee, S.-W., 1977, A&A Supp., 28, 409
- (34) McNamara D. H., 2000, PASP, 112, 1096
- (35) McNamara D. H., 1997, PASP, 109, 1221
- (36) Mateo, M., Udalski, A., Szymanski, M., Kaluzny, J., Kubiak, M., Krzeminski, W. 1995, AJ, 109, 588
- (37) Mazur, B., Krzemiński, W., Thompson, I. B., 2003, MNRAS, 340, 1205
- (38) Morgan, S.M., Wahl, J.N., Wieckhorst, R.M., 2007, MNRAS, 374, 1421
- (39) Petersen, J.O., Hog, E., 1998, A&A, 331, 989
- (40) Piotto G., King, I.R., Djorgovski, S. G. et al., 2002 A&A, 391, 945
- (41) Poretti E., Clementini, G., Held, E. V., et al., 2008, ApJ, 685, 947
- (42) Poretti E., Suárez, J. C., Niarchos, P. G., et al., 2005, A&A, 440, 1097
- (43) Rutledge, G. A., Hesser, J. E., Stetson, P. B., 1997, PASP, 109, 907
- (44) Samus, N. N., Kazarovets, E. V., Pastukhova, E. N., Tsvetkova, T. M., Durlevich, O. V., 2009, PASP, 121, 1378
- (45) Sandage, A., Cacciari, C., 1990, ApJ, 350, 645
- (46) Santolamazza, P., Marconi, M., Bono, G., Caputo, F., Cassisi, S., Gilliland, R.L., 2001, ApJ, 554, 1124.
- (47) Stetson, P.B., 2000, PASP, 112, 925
- (48) Sturch, C., 1966, ApJ, 143, 774
- (49) van Albada, T. S., Baker, N., 1971, ApJ, 169, 311
- (50) von Braun, K., Mateo, M., 2001, AJ, 113, 264
- (51) Wilkens, H., 1965, Asociación Argentina de Astronomía, Bols. 8,9 & 10, p66.
- (52) Woods, I.E., 1919, Harvard Circ., 216, 1
- (53) Wright, F.W., 1941, Harvard Bull., 915, 2
- (54) Zinn, R., West, M. J., 1984, ApJS, 55, 45