Supramolecular structures in monohydroxy alcohols: Insights from shear-mechanical studies of a systematic series of octanol structural isomers
Abstract
A recent study [Gainaru et al. PRL. 112, 098301 (2014)] of two supercooled monohydroxy alcohols close to the glass-transition temperature showed that the Debye peak, thus far mainly observed in the electrical response, also has a mechanical signature. In this work, we apply broadband shear-mechanical spectroscopy to a systematic series of octanol structural isomers, -methyl-3-heptanol (with ranging from 2 to 6). We find that the characteristics of the mechanical signature overall follow the systematic behavior observed in dielectric spectroscopy. However, the influence from the molecular structure is strikingly small in mechanics (compared to roughly a factor 100 increase in dielectric strength) and one isomer clearly does not conform to the general ordering. Finally, the mechanical data surprisingly indicate that the size of the supramolecular structures responsible for the Debye process is nearly unchanged in the series.
Liquids forming supramolecular structures are currently receiving a great deal of attention Lou et al. (2013); Griffin et al. (2013); Wang et al. (2014); Gainaru et al. (2014a); Böhmer, Gainaru, and Richert (2014). In this communication, we present shear-mechanical spectroscopy results on monohydroxy alcohols (i.e., alcohols containing only a single OH group). A monohydroxy alcohol is one of the simplest systems showing pronounced formation of supramolecular structures and has been studied intensively in the past mainly by dielectric spectroscopy (dating back 100 years), but also by x-ray and neutron scattering, and calorimetry (see recent extensive review by Böhmer et al. [Böhmer, Gainaru, and Richert, 2014] and earlier compilation of classical results Ref. Böttcher and Bordewijk, 1980, Sec. IX-c.1). Only few studies of the mechanical properties of monohydroxy alcohols exist Lyon and Litovitz (1956); Litovitz and McDuffie (1963); Kono, Litovitz, and McDuffie (1966); Emery et al. (1978); Behrends and Kaatze (2001); Jakobsen et al. (2008); Gainaru et al. (2014a, b), but recent results Gainaru et al. (2014a, b) show that valuable information about the supramolecular structures can be obtained by mechanical spectroscopy.
Dielectric spectra for supercooled viscous monohydroxy alcohols close to the glass-transition temperature show two pronounced anomalies: Firstly, the dielectric constant (in the static limit) is different from what is expected from the dipole moment of the molecules — in most cases it is much larger, but in some cases smaller. Secondly, the dielectric spectrum shows a distinct feature at lower frequencies than the main (alpha) structural relaxation. In many cases, this feature is dominating, and — contrary to the structural relaxation in most molecular liquids — is described by a single exponential relaxation. This spectral feature thus follows the Debye-model prediction, and is therefore often termed the “Debye-peak” or “Debye-process”.
It is generally agreed (dating back to at least the seminal work by Kirkwood Kirkwood (1939) and later by W. Dannhauser Dannhauser (1968a, b)) that these two dielectric anomalies are related to supramolecular structures in the liquid. The primary supramolecular structure is believed to be linear (un-branched) chains, including rings and dimers. However, the microscopic details of how these structures give rise to the observed dynamic anomalies are far from settled, with different models competing, e.g. Refs. Gainaru et al., 2010; Singh and Richert, 2012; Singh, Alba-Simionesco, and Richert, 2013.
Until recently, it was commonly accepted that the process leading to the Debye-peak only showed a signature in dielectric spectroscopy, what lead to many speculative arguments for why a signal was absent in e.g. shear-mechanics and specific heat Huth et al. (2007); Lou et al. (2013); Böhmer, Gainaru, and Richert (2014). This conventional belief was challenged, however, when Gainaru et al. [Gainaru et al., 2014a] very recently demonstrated the existence of a shear-mechanical low-frequency feature in the spectra of two monohydroxy alcohols (2-ethyl-1-hexanol and 4-methyl-3-heptanol) close to the glass-transition temperature. Applying two high resolution shear-mechanical techniques enabled an identification of a low-frequency (i.e., sub alpha peak-frequency) crossover from an intermediate behavior to a terminal viscous behavior. This spectral feature is interpreted to originate from the same supramolecular structures responsible for the dielectric Debye process, and is identical to what is observed for short chain polymers Gray, Harrison, and Lamb (1977); Ferry (1980). Furthermore, it has been shown that also NMR Gainaru et al. (2010), dynamic light scattering Wang et al. (2014), and quasi-elastic neutron scattering Sillrén et al. (2014) is sensitive to the Debye-process and similar results have been seen in mechanical studies of supramolecular polymers Lou et al. (2013) and high temperature alcohols Behrends and Kaatze (2001). Altogether, this suggests that the Debye-process is a “normal” relaxation phenomenon in the liquid, and not solely connected to the dielectric properties, opening the route for many new experiments which could provide valuable information on liquids containing hydrogen bonded supramolecular structures.
In this work we present mechanical studies utilizing the broadband technique applied in Ref. Gainaru et al., 2014a on a series of structural octanol isomers: -methyl-3-heptanol (M3H), with =2–6 (see Fig. 3a). The aim is to investigate to what extent the dielectric behavior carries over to the mechanical response and to investigate what can be learned from mechanical spectroscopy about the size and morphology of the supramolecular structures. Our analysis is purely phenomenological and model-free, taking the simplest possible approach hence avoiding unjustified assumptions.
Studies of octanol isomers date back to the very early days of dielectric measurements Smyth and Stoops (1929) with the work in the 1960’s of Dannhauser and Johari Dannhauser (1968a, b); Johari and Dannhauser (1969a, b) being the most thorough, but has also been the subject of more recent investigations Singh and Richert (2012); Singh, Alba-Simionesco, and Richert (2013); Bauer et al. (2013); Gainaru et al. (2014b).
The -methyl-3-heptanol system is interesting because the position of the methyl group provides a tunable steric hindrance for the hydrogen binding process, and thus a possible handle to changing the supramolecular structures. In dielectric spectra (as shown in Fig. 3a), this is manifested as a systematic increase in the intensity of the Debye peak from a very weak, almost non-existing, low-frequency feature in 3M3H to a dominant peak in 6M3H (this is often represented as a variation in the Kirkwood factor Kirkwood (1939), ). This systematic variation is attributed to a change in size and morphology of the supramolecular structures, from a ring dominated morphology (with small Debye-process and ) to a chain dominated morphology (with dominant Debye-process and ) Dannhauser (1968b); Singh and Richert (2012); Singh, Alba-Simionesco, and Richert (2013). However, it is hard, if not impossible, to assign a quantitative microscopic model based only on dielectric data, as stated by, e.g., Dannhauser Dannhauser (1968b): “An attempt to make the forgoing conclusions quantitative requires the introduction of a specific molecular model”.
We measured the complex frequency-dependent shear modulus () over a frequency range of – utilizing a unique broadband shear-mechanical technique known as the “Piezoelectric shear-modulus gauge” (PSG) technique Christensen and Olsen (1995). The technique also provides the complex, frequency-dependent shear viscosity as according to general response theory. The conventional static viscosity, here denoted by , is defined as the zero-frequency limit of the real part of the frequency-dependent viscosity, .
The PSG technique is optimized for measuring on very stiff systems (in the M-G range) over a wide frequency range. The shear-mechanical alpha relaxation of a glass-forming liquid can thus be followed all the way to the glass-transition temperature.
Corresponding dielectric spectra were measured in tandem with the mechanical data under identical experimental conditions to allow for a direct comparison.
The five octanol isomers were used as received 111Details of samples used: 2M3H from Alfa Aesar (90% purity). 3M3H,4M3H,5M3H from Sigma Aldric. 6M3H from TCI. 4M3H shear mechanical data reproduce the results from the study published in Gainaru et al., 2014a, the dielectric data was taken during that study.. For each sample a broad temperature and frequency scan was made down to temperatures where the mechanical alpha loss peak is at approximately .222The presented data can be obtained from the “Glass and Time: Data repository,” see http://glass.ruc.dk/data.
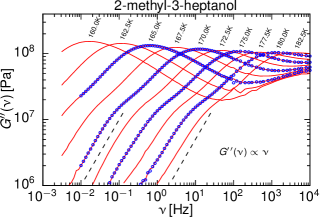
Figure 1 shows the imaginary part of the shear modulus for 2M3H at different temperatures. On the low-frequency side of the alpha peak, a clear crossover from one intermediate power law to a terminal power law of — characteristic of viscous behavior — is seen for all temperatures. We refer to this as the crossover to pure viscous behavior. This behavior complies with the observations in Refs. Gainaru et al., 2014a, b, interpreted as short chain polymer-like dynamics.
The loss-peak frequencies determined as function of temperature for all the isomers are shown on Fig. 2. The direct access to the characteristic time scale of the alpha relaxation is one of the big advantages of using broadband mechanical spectroscopy on monohydroxy alcohols. The alpha time scale in the dielectric data can only be estimated through somewhat questionable model fits due to the presence of the Debye peak.
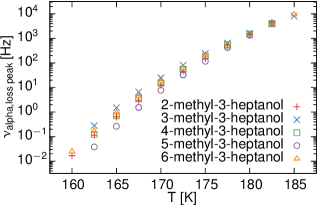
The alpha time scale of the different isomers follow each other rather closely. At 182.5 the alpha time scales are practically identical, with the alpha loss peak at 4 k. At the lowest temperature where data exists for all 5 liquids (162.5 ) they differ less than a factor of 10 after having changed orders of magnitude. No clear trend, with respect to molecular configuration, in the ordering of alpha time scales at low temperatures is observed.
In the following we will focus on a close analysis of the data set from 182.5 , where a unique possibility exists for studying the influence of the molecular geometry on the mechanical crossover to pure viscous behavior, while keeping the alpha relaxation time and temperature constant.
Figure 3a and 3b show the dielectric and shear-mechanical loss for all five liquids at 182.5 . The dielectric data, qualitatively, reproduce results from the literature Dannhauser (1968a, b); Singh, Alba-Simionesco, and Richert (2013); Singh and Richert (2012) showing that the Debye peak intensifies and shifts to lower frequencies when the methyl group is moved away from the hydroxyl group while the alpha peak position is unchanged, i.e., a strong dependence of the Debye process on the molecular geometry.
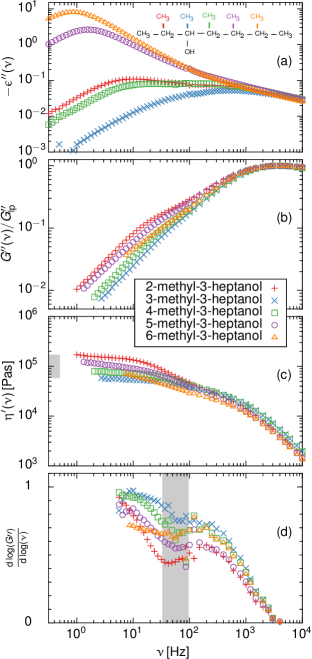
Comparing Fig. 3a and 3b, the alpha relaxation in the mechanical data is shifted to higher frequencies than in the dielectric data. It is a common feature for molecular viscous liquids that the shear-mechanical alpha relaxation is shifted to higher frequencies compared to dielectric spectroscopy (see, e.g., Refs. Jakobsen, Niss, and Olsen, 2005; Niss, Jakobsen, and Olsen, 2005; Jakobsen et al., 2008, 2011 and references therein). In addition, we now observe that the crossover to pure viscous behavior is also shifted to higher frequencies compared to the dielectric Debye peak. Thus, the overall shear mechanical relaxation is faster than the dielectric, not just the alpha relaxation. That different response functions relax on different time scales is no surprise Jakobsen et al. (2012), but it is interesting that all visible processes are faster in shear mechanics than in dielectric relaxation.
The shape of the shear-mechanical relaxation on the low-frequency side of the alpha peak depends on the molecular geometry. The separation between the alpha relaxation and the crossover frequency mimics the order from the dielectric spectra. However, it is clear that 2M3H, which from a dielectric point of view is close to 4M3H (as one would expect based on the molecular geometry), behaves much more like 5M3H in the mechanics with a surprisingly pronounced and temporally separated mechanical crossover signal.
Figure 3c shows the calculated frequency dependent viscosity for the 5 liquids. Again, we observe increasing viscosity with increasing separation of the methyl and hydroxyl group. But also in this signal 2M3H is contradicting the general trend by having a relatively large viscosity compared to 4M3H and even 5M3H.
Figure 3d show the logarithmic derivative of the mechanical loss, , which is simply the slope of the curves in Fig. 3b. This representation of the data is specifically well suited to reveal power law behavior in the spectra and thus shows the crossover to the terminal viscous behavior much clearer than the raw data. As expected from the raw data, the curves display a two step behavior going down in frequency: from 0 (at the alpha peak frequency) approaching 1 at low frequencies (equivalent to the final viscous behavior where ). In the one extreme case, 3M3H, almost no intermediate plateau is observed due to the very small separation between the alpha relaxation and the terminal viscous behavior. In the other extreme case, 6M3H, the terminal behavior is outside the accessible range of the technique and only the intermediate plateau is observed. This is also seen in the viscosity data (Fig. 3c) where the plateau — signaling the onset of pure viscous flow — is not reached within the frequency window and resolution available here.
Comparing the mechanical and dielectric data, it is striking that the difference between the isomers is relatively small in the mechanical data compared to the huge difference in dielectric strength. Likewise the influence on the temporal separation between the alpha and Debye relaxation seems smaller in the mechanical signal. The striking increase in dielectric constant with change in molecular geometry can be attributed to a change in both size and morphology of the supramolecular structures, but dielectric spectroscopy is not able to directly distinguish between the two effects. In the following, we investigate the apparent size of the supramolecular structures determined from the mechanical data.
The relation between effective volume, , and characteristic time scale of an object in a viscous environment (with viscosity ) at a given temperature is in general given by:
| (1) |
This result can be obtained from simple dimension analysis, and several models predict such a relation, e.g., the Debye model Debye (1929) and the Rouse model prediction for the slowest Rouse mode in polymer melts Ferry (1980) (, where is the molecular weight and is the density of the polymer). In Ref. Gainaru et al., 2014a the Rouse prediction was used to estimate the length of the expected chain-like structures in 2-ethyl-1-hexanol and a reasonable result was found with a chain consisting of alcohol molecules.
In the following we apply the general formulation in Eq. 1 to evaluate whether the mechanical data suggest a growing size of the supramolecular structures in the M3H octanol isomer series.
Equation 1 predicts (assuming a constant geometrical prefactor and constant temperature) that for any pair of isomers, and , we have:
| (2) |
where is the time for the crossover to viscous behavior. A growing size should thus result in a which changes more than expected from just the changes in viscosity.
For the present case the small separation between the pure viscous behavior and the alpha relaxation makes it difficult to estimate without unjustified model assumptions Roland et al. (2004); Gainaru et al. (2014b). In order to overcome this problem, we calculated the expected change in based purely on viscosity increase (i.e., assuming ).
The viscosity change between the two extremes where viscosity is well defined (3M3H and 2M3H) is a factor three (indicated in Fig. 3c by the grey shaded area on the -axis). The corresponding expected change in has been indicated by the grey shaded area in Fig. 3d. Surprisingly the observed change in crossover frequency between the four liquids 2M3H – 5M3H is clearly captured in the shaded area (independent on how the crossover frequency is defined).
This shows that the volume of the supramolecular structure does not change significantly between the four isomers (under the assumption of a constant geometry factor in Eq. 1), as the observed change in separation between the alpha relaxation and the crossover to terminal viscous behavior can be explained purely by the increase in viscosity.
Furthermore, there are good reasons to assume that the isomers have the same density at the measuring temperature; they have the same density at room temperature and are expected to have roughly the same expansion coefficient Dannhauser (1968b). Under this assumption, the result above directly translates to an unchanged number of molecules participating in one supramolecular structure. This finding supports the idea that the dominating mechanism for the extremely large increase in the dielectric Debye strength is a change in geometry of the supramolecular structures, as was suggested from Kirkwood analysis of dielectric data Dannhauser (1968b); Singh and Richert (2012); Singh, Alba-Simionesco, and Richert (2013).
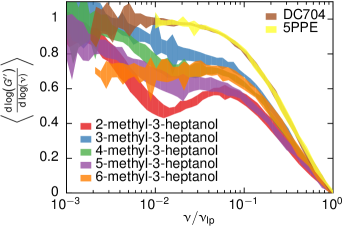
In order to show the generality of the observations from the data set taken at the logarithmic derivative data at all temperatures were averaged using a scaled frequency axis (). Figure 4 shows the result of this procedure and also includes data for two van der Waals bonded liquids for comparison. The generality of the results is clear, which also means that the overall shape of the mechanical relaxation curves is not too temperature dependent (otherwise the curves would be very smeared out).
In general, the systematic behavior found in dielectric spectroscopy of these liquids is not as clear in the mechanical response. The separation between the mechanical alpha and Debye process (and corresponding viscosity contribution) increases with increasing separation of the methyl group and the hydroxyl group. However, 2M3H is an exception; in dielectric spectroscopy it is close to 4M3H with a small Debye peak as expected, but in mechanics it has a very large and well separated Debye signal somewhere between 5M3H and 6M3H. The temperature dependence of the mechanical alpha time scale (or, equivalently, the fragility index) does not follow a specific ordering in contrast to what was found for the dielectric alpha Singh, Alba-Simionesco, and Richert (2013).
The observation of a clear mechanical signal from the supramolecular structures establishes that the process leading to the dielectric Debye peak is not exclusively related to dielectric properties, but a general relaxation phenomenon in monohydroxy alcohols. Therefore one would expect that an equivalent signal exists in other response functions, e.g., specific heat. The lack of present observation could very well be due to limited resolution as was the case of earlier mechanical investigations (e.g., in Ref. Jakobsen et al., 2008).
The mechanical data suggests that the size of the supramolecular structures when going from 3M3H – 4M3H – 5M3H – 2M3H is unchanged, in contrast to a factor 100 increase in dielectric strength. We conclude that the change in dielectric strength is dominated by changes in geometry of the supramolecular structures and not a growing chain length.
Acknowledgements.
The centre for viscous liquid dynamics “Glass and Time” is sponsored by the Danish National Research Foundation via grant DNRF61References
- Lou et al. (2013) N. Lou, Y. Wang, X. Li, H. Li, P. Wang, C. Wesdemiotis, A. P. Sokolov, and H. Xiong, Macromolecules 46, 3160 (2013).
- Griffin et al. (2013) P. J. Griffin, J. R. Sangoro, Y. Wang, A. P. Holt, V. N. Novikov, A. P. Sokolov, Z. Wojnarowska, M. Paluch, and F. Kremer, Soft Matter 9, 10373 (2013).
- Wang et al. (2014) Y. Wang, P. J. Griffin, A. Holt, F. Fan, and A. P. Sokolov, J. Chem. Phys. 140, 104510 (2014).
- Gainaru et al. (2014a) C. Gainaru, R. Figuli, T. Hecksher, B. Jakobsen, J. C. Dyre, M. Wilhelm, and R. Böhmer, Phys. Rev. Lett. 112, 098301 (2014a).
- Böhmer, Gainaru, and Richert (2014) R. Böhmer, C. Gainaru, and R. Richert, Phys. Rep. (2014), 10.1016/j.physrep.2014.07.005, (in press).
- Böttcher and Bordewijk (1980) C. J. F. Böttcher and P. Bordewijk, Theory of electric polarization 2: Dielectrics in time-dependent fields., 2nd ed. (Elsevier, 1980).
- Lyon and Litovitz (1956) T. Lyon and T. A. Litovitz, J. Appl. Phys. 27, 179 (1956).
- Litovitz and McDuffie (1963) T. A. Litovitz and G. E. McDuffie, J. Chem. Phys. 39, 729 (1963).
- Kono, Litovitz, and McDuffie (1966) R. Kono, T. A. Litovitz, and G. E. McDuffie, J. Chem. Phys. 45, 1790 (1966).
- Emery et al. (1978) J. Emery, S. Gasse, R. A. Pethrick, and D. W. Phillips, Adv. Mol. Relax. Int. Pr. 12, 47 (1978).
- Behrends and Kaatze (2001) R. Behrends and U. Kaatze, J. Phys. Chem. A 105, 5829 (2001).
- Jakobsen et al. (2008) B. Jakobsen, C. Maggi, T. Christensen, and J. C. Dyre, J. Chem. Phys. 129, 184502 (2008).
- Gainaru et al. (2014b) C. Gainaru, M. Wikarek, S. Pawlus, M. Paluch, R. Figuli, M. Wilhelm, T. Hecksher, B. Jakobsen, J. C. Dyre, and R. Böhmer, Colloid. Polym. Sci. 292, 1913 (2014b).
- Kirkwood (1939) J. G. Kirkwood, J. Chem. Phys. 7, 911 (1939).
- Dannhauser (1968a) W. Dannhauser, J. Chem. Phys. 48, 1918 (1968a).
- Dannhauser (1968b) W. Dannhauser, J. Chem. Phys. 48, 1911 (1968b).
- Gainaru et al. (2010) C. Gainaru, R. Meier, S. Schildmann, C. Lederle, W. Hiller, E. A. Rössler, and R. Böhmer, Phys. Rev. Lett. 105, 258303 (2010).
- Singh and Richert (2012) L. P. Singh and R. Richert, Phys. Rev. Lett. 109, 167802 (2012).
- Singh, Alba-Simionesco, and Richert (2013) L. P. Singh, C. Alba-Simionesco, and R. Richert, J. Chem. Phys. 139, 144503 (2013).
- Huth et al. (2007) H. Huth, L. M. Wang, C. Schick, and R. Richert, J. Chem. Phys. 126, 104503 (2007).
- Gray, Harrison, and Lamb (1977) R. W. Gray, G. Harrison, and J. Lamb, Proc. R. Soc. Lond. A 356, 77 (1977).
- Ferry (1980) J. D. Ferry, Viscoelastic properties of polymers, 3rd ed. (John Wiley & Sons, INC., 1980).
- Sillrén et al. (2014) P. Sillrén, A. Matic, M. Karlsson, M. Koza, M. Maccarini, P. Fouquet, M. Götz, T. Bauer, R. Gulich, P. Lunkenheimer, A. Loidl, J. Mattsson, C. Gainaru, E. Vynokur, S. Schildmann, S. Bauer, and R. Böhmer, J. Chem. Phys. 140, 124501 (2014).
- Smyth and Stoops (1929) C. P. Smyth and W. N. Stoops, JACS 51, 3330 (1929).
- Johari and Dannhauser (1969a) G. P. Johari and W. Dannhauser, J. Chem. Phys. 51, 1626 (1969a).
- Johari and Dannhauser (1969b) G. P. Johari and W. Dannhauser, J. Chem. Phys. 50, 1862 (1969b).
- Bauer et al. (2013) S. Bauer, H. Wittkamp, S. Schildmann, M. Frey, W. Hiller, T. Hecksher, N. Olsen, C. Gainaru, and R. Böhmer, J. Chem. Phys. 139, 134503 (2013).
- Christensen and Olsen (1995) T. Christensen and N. B. Olsen, Rev. Sci. Instrum. 66, 5019 (1995).
- Note (1) Details of samples used: 2M3H from Alfa Aesar (90% purity). 3M3H,4M3H,5M3H from Sigma Aldric. 6M3H from TCI. 4M3H shear mechanical data reproduce the results from the study published in \rev@citealpnumGainaru2014, the dielectric data was taken during that study.
- Note (2) The presented data can be obtained from the “Glass and Time: Data repository,” see http://glass.ruc.dk/data.
- Jakobsen, Niss, and Olsen (2005) B. Jakobsen, K. Niss, and N. B. Olsen, J. Chem. Phys. 123, 234511 (2005).
- Niss, Jakobsen, and Olsen (2005) K. Niss, B. Jakobsen, and N. B. Olsen, J. Chem. Phys. 123, 234510 (2005).
- Jakobsen et al. (2011) B. Jakobsen, K. Niss, C. Maggi, N. B. Olsen, T. Christensen, and J. C. Dyre, J. Non-Cryst. Solids 357, 267 (2011).
- Jakobsen et al. (2012) B. Jakobsen, T. Hecksher, T. Christensen, N. B. Olsen, J. C. Dyre, and K. Niss, J. Chem. Phys. - Communication 136, 081102 (2012).
- Debye (1929) P. Debye, Polar Liquids (The Chemical Catalog Company, Inc., 1929).
- Roland et al. (2004) C. Roland, L. Archer, P. Mott, and J. Sanchez-Reyes, J. Rheol. 48, 395 (2004).
- Hecksher et al. (2013) T. Hecksher, N. B. Olsen, K. A. Nelson, J. C. Dyre, and T. Christensen, J. Chem. Phys. 138, 12A543 (2013).