X-rays from wind-blown bubbles: an XMM-Newton detection of NGC 2359
Abstract
We present an analysis of the XMM-Newton observation of the wind-blown bubble NGC 2359. This is the first detection of this object in X-rays. The X-ray emission of NGC 2359 is soft and originates from a thermal plasma with a typical temperature of kT keV. A direct comparison between the one-dimensional hydrodynamic model of wind-blown bubbles and the X-ray spectrum of NGC 2359 suggests a reduced mass-loss rate of the central star in order to provide the correct value of the observed flux. The central star of the nebula, WR 7, is an X-ray source. Its emission is similar to that of other presumably single Wolf-Rayet stars detected in X-rays. The WR 7 spectrum is well represented by the emission from a two-temperature plasma with a cool component of kT keV and a hot component of kT keV.
keywords:
ISM: individual objects: NGC 2359 — ISM: bubbles — stars: individual: WR 7 — X-rays: ISM — X-rays: stars — shock waves1 Introduction
The currently accepted physical picture for the origin of the optical nebulosities around massive stars of early spectral type (O, Of, and Wolf-Rayet (WR)) assumes that they are formed from the interaction of the stellar wind with circumstellar gas. The flow pattern, resulting from such an interaction, was first recognized by Pikelner (1968). These so called wind-blown bubbles (WBB) consist of two regions of shocked gas: the outer one is filled with the shocked circumstellar gas and the inner one (the hot bubble) harbours the shocked stellar wind. A contact discontinuity separates these regions and the plasma in the hot bubble can cool down due to the high efficiency of electron thermal conduction (e.g., Weaver et al. 1977).
The physics of the hot interior of a WBB is a cornerstone for the physical picture of these objects. The hot bubble is the place where the stellar wind energy is supplied and then used for driving the entire structure. Because of the high velocity (1000 - 3000 km s-1) of the stellar winds of massive O and WR stars, and thus the high shock velocities in WBBs, the expected plasma temperatures are very high. Therefore, WBBs are expected to emit X-rays and the key characteristic of their X-ray emission is that it should be spatially located inside the optical nebula.
Bochkarev (1988) reported the first successful detection of X-rays from a WBB: the observation of NGC 6888 by Einstein revealed hot plasma with a typical temperature of kT keV (90% confidence interval). Subsequent studies of this object with ROSAT (Wrigge et al., 1994), ASCA (Wrigge et al., 2005), Chandra (Chu et al. 2006; Toala et al. 2014), and Suzaku (Zhekov & Park, 2011) provided further details about the X-ray emission from NGC 6888 and established that the plasma temperature of the hot bubble is kT keV. The Suzaku observations of NGC 6888 provided us with the first X-ray spectrum with good photon statistics of an entire WBB. Its analysis gave the first observational evidence about the origin of the hot gas: the WBB interior is filled mostly by gas that flowed into the hot bubble from the optical nebula (Zhekov & Park 2011). This, along with the relatively low plasma temperature of the hot bubble, is a solid indication for efficient electron thermal conduction operating in WBBs.
Unfortunately, there are not many detections of X-ray emission from WBBs. There is only one more object, S308, that has been detected and studied in some detail. Analysis of the ROSAT (Wrigge et al., 1994) and the XMM-Newton (Chu et al., 2003) observations of S308 showed that its X-ray spectrum is soft with plasma temperature of kT keV. Recent analysis of new XMM-Newton observations that completed coverage of this WBB observed in X-rays to 90% of its spatial extent confirmed the basic properties of the hot plasma in S308 (Toala et al., 2012). It also provided evidence that the chemical composition of the hot gas is similar to that of the optical nebula which, as in the case of NGC 6888, indicates that electron thermal conduction plays an important role for the physics of this object as well.
Apart from the two X-ray detections just mentioned, there are two reports in the literature of non-detections of WBBs in X-rays, namely, of the nebulae around the WR stars WR 16 (Toala & Guerrero, 2013) and WR 40 (Gosset et al., 2005). Thus, any new data on the X-ray emission from WBBs are of great importance in helping us to better understand the physics of these objects.
In this paper, we report results from the XMM-Newton observation of the WBB NGC 2359, the third object of this kind detected in X-rays. The paper is organized as follows. We give some basic information about NGC 2359 in Section 2. In Section 3, we review the XMM-Newton observation. In Section 4, we present results from analysis of the X-ray properties of NGC 2359 and the two brightest point sources within the optical nebula. In Section 5, we discuss our results and we present our conclusions in Section 6.
2 The wind-blown bubble NGC 2359
The nebula NGC 2359 around the WR star WR 7 is a classical wind-blown bubble with angular size of 4.5 arcmin (Chu et al., 1983). The expansion velocity of the nebula is not well constrained and a typical range for its value is 10-30 km s-1(see the discussion in Chu 1988). The distance to NGC 2359 (WR 7) is d kpc (van der Hucht, 2001), thus, the dynamical age (radius divided by the expansion velocity) of the nebula is years. No X-ray detection of NGC 2359 has been previously reported.
The central star, WR 7, is a WN4 star and the optical extinction toward it is A mag (van der Hucht 2001; A A) implying a foreground column density of N cm-2. The range corresponds to the conversion that is used: NA cm-2 (Vuong et al. 2003, Getman et al. 2005); and NA cm-2 (Gorenstein, 1975). We adopt the stellar wind parameters (velocity and mass loss) of V km s-1and M⊙ yr-1 (Hamann & Koesterke, 1998).
3 Observations and data reduction
NGC 2359 was observed with XMM-Newton on 2013 Apr 9 (Observation ID 0690390101)
with a nominal exposure of ksec. Because of the anticipated
faint X-ray emission from NGC 2359, our analysis is focused on the data
from the European Photon Imaging Camera (EPIC) having one pn and
two MOS detectors111see § 3.3 in the XMM-Newton Users Handbook,
http://xmm.
esac.esa.int/external/xmm_user_support/documentation/uhb
.
For the data reduction, we made use of the XMM-Newton SAS222Science Analysis Software, http://xmm.esac.esa.int/sas
12.0.1 data analysis software. For the analysis of the EPIC MOS and pn
observations, we also made use of the XMM-Newton Extended Source Analysis
Software (XMM-ESAS)
package333http://xmm.esac.esa.int/sas/current/doc/esas,
which is now incorporated in SAS.
Before proceeding with the spectral extraction, we verified that the studied object was detected. For that purpose, we constructed an X-ray image following the recipe described in the XMM-ESAS Cookbook444ftp://xmm.esac.esa.int/pub/xmm-esas/xmm-esas.pdf. First, we created filtered event files using the ESAS commands mos-filter and pn-filter which minimizes the contamination of the soft proton flaring in the EPIC data in a robust manner. The relatively strong point sources were excised as well. Then, we constructed quiescent background spectra and images. We used the corresponding results and the XMM-ESAS command adapt_900 to construct a combined EPIC background-subtracted and exposure-corrected image.
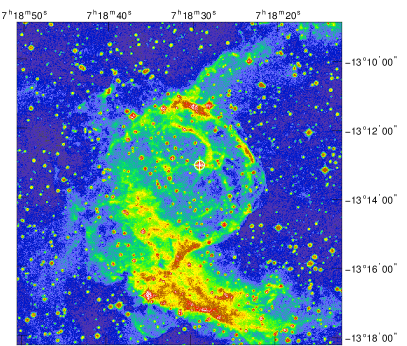
Figure 1 presents the background-subtracted images of NGC 2359 in the soft (0.4 - 1.25 keV) and hard (2.0 - 4.0 keV) energy bands along with an optical image of the studied object. A minimum of 20 counts per bin were requested for the smoothed images. As seen from these results, soft X-ray emission is detected from NGC 2359, and this emission originates from regions inside the optical nebula.
For the analysis of the X-ray spectrum of NGC 2359, we decided to adopt the standard approach (i.e., annular background subtraction) instead of following the one described in the XMM-ESAS Cookbook for strong extended sources. The reason is that the X-ray emission from the region of NGC 2359 is dominated by the background emission (instrumental and cosmic). So, a global fit to the total X-ray emission that consists of various background components and the emission of NGC 2359 will simply ‘wash out’ the spectral parameters of the latter. In addition, the NGC 2359 X-ray emission is of limited angular extent making an annular background spectrum reasonable.
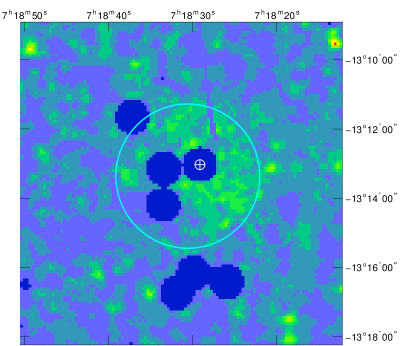
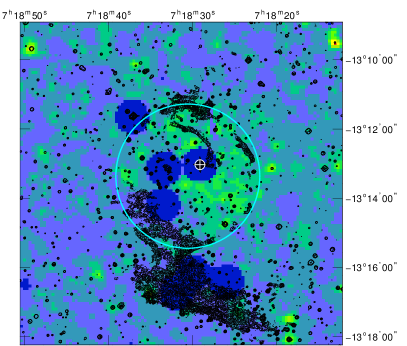
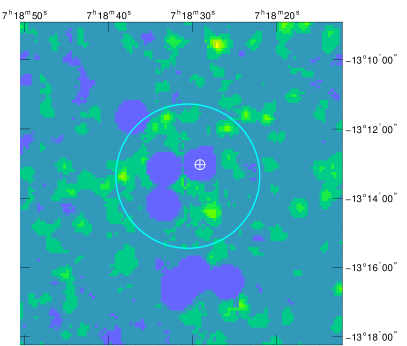
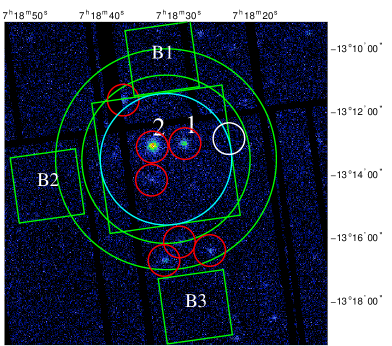
Figure 2 shows the X-ray image of NGC 2359 and the corresponding regions for the spectral extraction. We note that our basic background region is that denoted by the circular annulus. We do so as the X-ray spectrum from such a region could likely combine the spectral characteristics of the entire NGC 2359 background. The X-ray spectra of the other background regions are chosen as representative of different parts of the X-ray sky and of the X-ray detectors. The spectral extractions were done from the filtered event files (see above) having effective exposures of 64.5 ksec (pn), 88.6 ksec (MOS1) and 92.8 ksec(MOS2). We used only the pn spectrum of NGC 2359 ( source counts) since the MOS spectra have considerably lower photon statistics due to the MOS much lower effective area compared to that of the pn detector (see §3.2.2 in the XMM-Newton Users Handbook: footnote1).
We extracted the X-ray spectra of the two brightest sources in the region of NGC 2359 (Fig. 2): the central star of the nebula WR 7 and the HST GSC555The Hubble Space Telescope Guide Star Catalog, http://gsss.stsci.edu/webservices/GSC2/GSC2WebForm.aspx object S3XJ067536 (the GSC object coordinates are within 1.2 arcsec from the X-ray coordinates as derived from the XMM-Newton data, thus, we will denote this object as [S3XJ067536]). Since the spectra of point sources are not background-dominated, we extracted a pn and two MOS spectra for each object. The MOS1 and MOS2 spectra are practically identical which allowed us to construct a total (combined) MOS spectrum for each point source. The resultant spectra of WR 7 had cts (pn) and cts (MOS), while those for [S3XJ067536] had cts (pn) and cts (MOS).
Finally, we constructed response matrix files and ancillary response
files for each spectrum by making use of the SAS procedures rmfgen
and arfgen, respectively. For the case of NGC 2359, we followed the
approach recommended for extended sources
(e.g., by creating an image
of the source region, see §4.8.5 in the SAS
Users Guide666http://xmm.esac.esa.int/external/xmm_user_support/
documentation/sas_usg/USG/).
We made use of standard as well as custom models in version 11.3.2 of
XSPEC (Arnaud, 1996) for the spectral analysis.
4 X-ray properties
4.1 NGC 2359
A basic characteristic of the X-ray emission from NGC 2359 is that it is rather soft and there is no apparent emission at energies above 2 keV (see Fig. 1). We note that because of the relatively large spatial extent of the nebula and its weak X-ray emission, it is not possible to correct the background-subtracted spectrum for the instrumental Al Kα line very well. For these reasons, our spectral analysis is focused in the (0.3 - 1.44 keV) energy range. To improve the photon statistics, we re-binned the NGC 2359 spectrum to have a minimum of 50 counts per bin.
We used the discrete-temperature plasma model in XSPEC to derive the global properties of the X-ray emission from NGC 2359: typical plasma temperature, X-ray absorption, observed flux etc. Since the quality of the spectrum is not very high, our model fits assumed fixed values for the elemental abundances of the X-ray emitting plasma. As a basic set of abundances, we adopted those typical for the optical nebula of NGC 2359 (see Table 3 in Esteban et al. 1993): He , C , N , O , Ne , S . Since no values are available for Si, Ar, Ca, Fe and Ni, we adopted the same value as for the sulphur abundance and only the Mg abundance was allowed to vary to improve the quality of the fit near 1.3-1.4 keV. All the abundance values are given with respect to the solar abundances of Anders & Grevesse (1989).
| Parameter | 1T vapec |
|---|---|
| /dof | 33/46 |
| NH (1021 cm-2) | 4.77 |
| kT (keV) | 0.21 |
| EM ( cm-3) | 11.0 |
| Mg | 3.32 |
| FX ( ergs cm-2 s-1) | 2.33 (33.0) |
Note – Results from the fit to XMM-Newton spectrum of NGC 2359. Tabulated quantities are the neutral hydrogen absorption column density (NH), plasma temperature (kT), emission measure (), the X-ray flux (FX) in the 0.3 - 1.5 keV range followed in parentheses by the unabsorbed value. Only the abundance of Mg was varied in the fit and the values of other abundances were kept fixed to their adopted values (see text in § 4.1). Errors are the values from the fit.

Figure 3 and Table 1 present the results from the model fit to the X-ray spectrum of NGC 2359. We note that the X-ray emission of this object is represented well by the spectrum of an optically-thin plasma with a relatively low temperature. Also, the derived value of the X-ray absorption is consistent with the optical extinction to NGC 2359: N vs. N cm-2 (see § 2).
Although we believe that our ‘basic’ background spectrum (extracted from the annulus shown in Fig. 2) represents the background contribution to the NGC 2359 spectrum in the most realistic way, we nevertheless checked our fit results by making use of other background spectra (extracted from the square regions labelled ‘B1’, ‘B2’, ‘B3’ in Fig. 2). The results from these fits confirmed our basic findings (given in Table 1) within the fits uncertainties. Namely, the plasma temperature was in the range kT keV and the X-ray absorption was N cm-2.
We are therefore confident in our conclusion that a relatively ‘cool’ plasma dominates the X-ray emission from NGC 2359 as is the cases of S308 (e.g., Chu et al. 2003; Toala et al. 2012) and NGC 6888 (e.g., Zhekov & Park 2011).
Finally, we mention that the strength of the suspected line feature at 1.14 keV (see Fig. 3) depends on the background spectrum at hand, and in some cases it can even ‘disappear’. To compare, the Mg XI line is always present. We could not match this line if the Ne and Fe abundances varied in the spectral fits although there are a lot of spectral lines of Ne and Fe near 1.14 keV. We thus believe that this line is not an intrinsic feature of the NGC 2359 spectrum.
4.2 Bright point sources
We analysed the spectra of the two relatively bright point sources in the field of NGC 2359. We re-binned the spectra to have a minimum of 20 and 30 counts per bin for the WR 7 and [S3XJ067536] spectra, respectively. For each object, we fitted the pn and total MOS spectra simultaneously.
| Parameter | WR 7 | [S3XJ067536] |
|---|---|---|
| /dof | 87/94 | 111/180 |
| NH (1021 cm-2) | 3.44 | 5.89 |
| kT1 (keV) | 0.60 | … |
| kT2 (keV) | 2.68 | … |
| EM1 ( cm-3) | 9.97 | … |
| EM2 ( cm-3) | 3.25 | … |
| … | 1.66 | |
| norm) | … | 5.61 |
| FX ( ergs cm-2 s-1) | 2.68 (7.27) | 23.3 (36.0) |
| FX,1 ( ergs cm-2 s-1) | 1.90 (6.07) | … |
Note – Results from the fits to the XMM-Newton spectra of the point sources WR 7 (a two-temperature optically-thin plasma model) and [S3XJ067536] (a power-law model). Tabulated quantities are the neutral hydrogen absorption column density (NH), plasma temperature (kT1,2), emission measure (), photon power-law index (; F), normalization for the power-law model (normpow in units of cts keV-1 cm-2 s-1 at 1 keV), the X-ray flux (FX) in the 0.3 - 8 keV range followed in parentheses by the unabsorbed value and the flux for the cool component for the 2T plasma model (FX,1). Only the abundances of N and Mg were varied in the 2T model fit (N , Mg ) and the values of other abundances were kept fixed to their adopted values (see text in § 4.2). Errors are the values from the fits.
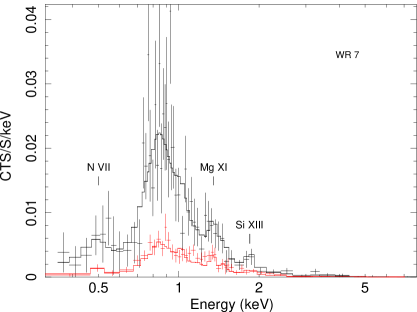
WR 7. As in the previous studies of the X-ray emission from presumably single WN stars (Skinner et al. 2010, Skinner et al. 2012), we used an absorbed two-temperature optically-thin plasma model (vapec) in XSPEC to model the spectra of this WN4 star. Similarly, we adopted the canonical WN abundances (van der Hucht et al., 1986). In the fit, all abundances were kept fixed to their generic values and only the N and Mg abundances varied to improve the quality of the fit. The results from the spectral fit are presented in Table 2 and Figure 4. We note that as for other single WN stars the intrinsic (unabsorbed) X-ray emission from WR 7 is dominated by the cool plasma component (kT keV). It is interesting to note that using the adopted stellar wind parameters and distance to WR 7 (§ 2), we derive for the X-ray and the wind luminosity L erg s-1 and L erg s-1. These numbers place WR 7 in accord with the correlation LX vs. Lwind established for presumably single WN stars (see Fig.10 in Skinner et al. 2010 and Fig.5 in Skinner et al. 2012). Also, as for NGC 2359 (§ 4.1), the derived value for X-ray absorption is consistent with the optical extinction to WR 7. We found no short-term variability in the XMM-Newton data of WR 7 that is on timescales less than the effective exposures of ksec (pn) and ksec (MOS1,2; see §3).
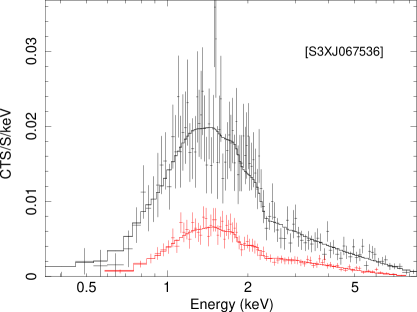
[S3XJ067536]. The XMM-Newton spectra of this source show no features at energies of the usually strong X-ray lines. We therefore adopted an absorbed power-law model for the spectral fit. The corresponding results are given in Table 2 and Figure 4. No short-term variability of [S3XJ067536] was detected on timescales less than the effective exposures of the pn and MOS data.
5 Discussion
One of the basic results from the analysis of the XMM-Newton data on NGC 2359 is that the X-ray emission of this WBB is rather soft and originates from a plasma with a relatively low temperature (see Fig. 3 and Table 1). As the stellar wind velocity is very high (see § 2), the expected shock velocity is high too, thus the postshock plasma temperature should be at least an order of magnitude larger than the value deduced from the analysis of the X-ray spectrum of NGC 2359. In general, this is an indication of efficient electron thermal conduction operating in this object that could cause ‘evaporation’ of the gas from the outer (optical) nebula into the hot bubble, thus, lowering the gas temperature in its interior (e.g., Weaver et al. 1977).
Unfortunately, due to the low statistics of the spectrum, we were not able to fit for the abundances which could have helped us draw some conclusion about the origin of the hot gas in NGC 2359. We recall that such an analysis was possible for another WBB (NGC 6888) whose spectrum had a very good photon statistics. It provided the first observational evidence that the hot gas in NGC 6888 originates from the outer cold optical shell (Zhekov & Park, 2011). Therefore we adopted values typical for the optical nebula in the fits to the X-ray emission from NGC 2359 (see § 4.1). However, a model fit to the spectrum of NGC 2359 was successful even if typical WN abundances (van der Hucht et al., 1986) were adopted for the hot gas in NGC 2359. We note that this fit is also statistically acceptable, /dof , and the plasma temperature, kT , is similar to that from the fit with abundances typical for the optical nebula (see Table 1). All this confirms that the limited photon statistics in the X-ray spectrum of NGC 2359 does not allow for deriving some valuable information about the elemental abundances in its hot interior. Nevertheless, the low plasma temperature in NGC 2359, a likely indication of efficient electron thermal conduction, motivates attempts to test the results from hydrodynamic modelling of WBB with the observations of NGC 2359.
Before doing this, a few basic details of the physics of WBBs around massive stars are worth recalling. A WBB forms when the stellar wind of a massive star interacts with the circumstellar matter. In the case of WR stars, the fast massive wind collides with the slow wind emitted in the previous stage of the WR evolution, i.e., a RSG (red supergiant) or a LBV (luminous blue variable) wind. An important feature of such an interaction is that both gas flows have similar density profile () which results in a structure (WBB) expanding with constant velocity. Thus, the dynamical age of a WBB around a WR star is practically equal to its physical age. The basic physical quantities that determine the global characteristics of such a WBB are the mass-loss rates and velocities of the fast (WR) and the slow (RSG or LBV) winds. The fast wind parameters can be derived from analysis of the emission of the central star of a WR WBB in different spectral domains (e.g., UV, optical, radio). On the other hand, the slow wind characteristics are free input parameters for the hydrodynamic modelling, and observational properties to match in the ‘startup’ modelling stage are the size and expansion velocity of the WBB.
To derive the global characteristics of NGC 2359 and the physical parameters of its hot bubble, we used the hydrodynamic code of A.V. Myasnikov that was developed for modelling the physics of a standard WBB (for details see Zhekov & Myasnikov 1998). This code allows modelling not only of adiabatic and radiative WBB but also of the case with efficient thermal conduction. It correctly handles interacting gas flows with different chemical compositions.
For NGC 2359 (see § 2), the typical range of expansion velocity is 10-30 km s-1and its angular size corresponds to a linear radius of pc for the adopted distance of kpc to this object. The mass-loss rate and velocity of the fast stellar wind (the wind of the central star WR 7) are correspondingly M⊙ yr-1 and V km s-1. As to the slow wind parameters (, Vsw), we varied them in order to match the expansion velocity and the size of the nebula. We only recall that as the nebula is sweeping out through the material of the slow wind, the expansion velocity of the nebula sets an upper limit for the slow wind velocity. Thus, we chose to run two sets of models with V 5 and 10 km s-1, respectively.
Figure 5 presents the results for the expansion velocity of the nebula as derived from the numerical simulations for various values of the mass-loss ratio () of the stellar winds. We see that values close to the observed ones are possible only for high mass-loss ratios: e.g., . For the nominal value of the mass-loss rate of the fast wind of M⊙ yr-1 , this implies that the mass loss of the slow wind should be very high: M⊙ yr-1 . We have to keep in mind that the slow-wind phase in the evolution of the central star in a WBB should have lasted at least for a time period of 777This relation comes from a simple consideration that when the shock structure expands to some distance at its age , it should have found slow wind gas at the same distance from the star., where is the age of the WBB and is its expansion velocity. Given the dynamical age (representative for the age of the nebula) of years and the low expansion velocity as deduced from observations (see § 2), the standard physical picture of WBB suggests an unusually long slow-wind phase in the evolution of the central massive star in NGC 2359 with extremely high mass-loss rate. This also implies a very large total mass loss of solar masses (!!). We note that such an evolutionary phase does not seem to fit the standard evolutionary scenario for massive stars (e.g., see §2.3.1 in Crowther 2007).

To further check the physical picture of WBB in the case of NGC 2359, we made use of the WBB model with efficient thermal conduction. We calculated the X-ray emission from the hot bubble for the case with nominal values for the fast-wind parameters and the mass-loss rate and velocity of M⊙ yr-1 () and km s-1. It was done in the same way as in Zhekov & Park (2011) for the WBB NGC 6888. Using the results from the one-dimensional hydrodynamic model, we calculated the distribution of emission measure of the hot bubble and the corresponding normalization parameter for the model spectrum in XSPEC (). Then, the actual fit to the X-ray spectrum showed if the theoretical emission measure gave the correct value for the observed flux from NGC 2359. The result was that the theoretical X-ray emission matched the shape of the observed spectrum acceptably well but it overestimated the observed flux by more than two orders of magnitude!
To reconcile this flux discrepancy, it was necessary to reduce the amount of X-ray emitting plasma in the hot bubble. To do so, we consecutively reduced the mass-loss rates of the fast and slow winds in a series of numerical simulations. The ratio of mass-loss rates and the wind velocities were kept unchanged which resulted in no change of the global geometry of the shock structure. The case with reduced mass-loss rate for the fast and slow winds of M⊙ yr-1 and M⊙ yr-1 provided the correct observed flux. The corresponding fit (/ dof ) to the XMM-Newton spectrum of NGC 2359 is shown in Figure 6. We note that the derived X-ray absorption, N cm-2, is consistent with the one from the spectral fit with the discrete-temperature optically-thin plasma model (see Table 1). Finally, we mention that a better match to the observed spectrum is possible in the (0.55 - 0.65 keV) energy range if the oxygen abundance is allowed to vary. However, as discussed above, the quality of the data does not allow for getting some decent constraints on the elemental abundances. Moreover, the varied oxygen abundance does not alleviate the problem with the flux discrepancy, that is with the requirement for a highly reduced mass-loss rate of the fast wind.

We thus see that as in the case of NGC 6888 (Zhekov & Park, 2011) the standard physical model of a WBB can in general explain the properties of the X-ray emission from NGC 2359, provided the mass-loss rate of its central star (WR 7) is considerably smaller (by a factor of ) than the currently accepted value. Future X-ray observations with higher sensitivity and lower detector background will be very important for constraining the X-ray properties of NGC 2359. This, in turn, will help us build a more realistic physical picture of this wind-blown bubble. Along these lines, we mention that the low expansion velocity of NGC 2359 poses a problem for the standard physical model of WBBs, and this calls for adopting a global approach to the study of this object. Namely, new and more accurate measurements of the physical characteristics of the optical nebula, the central star itself, and the X-ray properties of NGC 2359 should find their place in a ‘unified’ picture which is capable of explaining all of them in a self-consistent way.
6 Conclusions
In this work, we presented the XMM-Newton data of NGC 2359 which provide the first detection of this object in X-rays. We analysed the X-ray properties of this wind-blown bubble and of its central star. The basic results and conclusions are as follows.
(i) As in the case of the other two WBBs detected in X-rays (S308 and NGC 6888), the X-ray spectrum from NGC 2359 is rather soft and most of the emission is in the 0.3 - 1.5 keV energy range. No appreciable emission was detected at energies above 2 keV. The spectrum is well represented by the emission from a relatively cool plasma with a temperature of kT keV.
(ii) The central star of the nebula, WR 7, is detected in X-rays. The spectrum of this WN4 object is well represented by the emission from a two-temperature plasma with a cool component of kT keV and a hot component of kT keV. The X-ray properties of WR 7 are thus similar to those of other presumably single WN stars detected in X-rays.
(iii) The low plasma temperature in NGC 2359 is a sign of efficient electron thermal conduction operating in this object. A direct comparison (in XSPEC) between the one-dimensional hydrodynamic model of conductive WBB and the X-ray spectrum of NGC 2359 suggests a reduced mass-loss rate ( M⊙ yr-1 ) of the central star in order to provide the correct value of the observed flux. We note that this figure is atypically low for the stellar wind in Wolf-Rayet stars. We thus think that the best way to build a self-consistent physical picture of NGC 2359 is to carry out a global modelling of the entire system: central star, optical nebula and the hot bubble.
7 Acknowledgments
This research has made use of the NASA’s Astrophysics Data System, and the SIMBAD astronomical data base, operated by CDS at Strasbourg, France. The optical image in Figure 1 is downloaded from SIMBAD. The author is grateful to an anonymous referee for the valuable comments and suggestions.
References
- Anders & Grevesse (1989) Anders E., Grevesse N., 1989, Geochimica et Cosmochimica Acta, 53, 197
- Arnaud (1996) Arnaud, K.A. 1996, in Jacoby G., Barnes, J. eds., ASP Conf. Ser. Vol. 101, Astronomical Data Analysis Software and Systems, Astron. Soc. Pac., San Francisco, 17
- Bochkarev (1988) Bochkarev, N.G. 1988, Nature, 332, 518
- Chu (1988) Chu, Y.H. 1988, PASP, 100, 986
- Chu et al. (1983) Chu, Y.H., Treffers, R.R., & Kwitter, K.B. 1983, ApJS, 53, 937
- Chu et al. (2003) Chu, Y.H., Guerrero, M.A., Gruendl, R.A., Garcia-Segura, G., & Wendker, H.J. 2003, ApJ, 599, 1189
- Chu et al. (2006) Chu, Y.H., Gruendl, R.A., & Guerrero, M.A. 2006, Proceedings of the X-ray Universe 2005 (ESA SP-604), editor A.Wilson, 363
- Crowther (2007) Crowther, P.A. 2007, ARAA, 45, 177
- Esteban et al. (1993) Esteban, C., Smith, L.J., Vilchez, J.M., & Clegg, R.E.S. 1993, A&A, 272, 299
- Getman et al. (2005) Getman, K.V., Feigelson, E.D., Grosso, N., McCaughrean, M.J., Micela, G., Broos, P., Garmire, G., & Townsley, L. 2005, ApJS, 160, 363
- Gorenstein (1975) Gorenstein, P. 1975, ApJ, 198, 95
- Gosset et al. (2005) Gosset, E., Nazé, Y., Claeskens, J.-F., Rauw, G., Vreux, J.-M., & Sana, H. 2005, A&A, 429, 685
- Hamann & Koesterke (1998) Hamann, W.-R. & Koesterke, L. 1998, A&A, 333, 251
- Pikelner (1968) Pikelner, S.B. 1968, Astrophysical Letters, 2, 97
- Skinner et al. (2010) Skinner S.L., Zhekov S.A., Güdel M., Schmutz W. & Sokal, K.R. 2010, AJ, 139, 825
- Skinner et al. (2012) Skinner S.L., Zhekov S.A., Güdel M., Schmutz W. & Sokal, K.R. 2012, AJ, 143, 116
- Toala & Guerrero (2013) Toala, J.A. & Guerrero, M.A. 2013, A&A, 559, A52
- Toala et al. (2012) Toala, J.A., Guerrero, M.A., Chu, Y.-H., Gruendle, L.A., Arthur, S.J., Smith, R.C., & Snowden, S.L. 2012, ApJ, 755, 77
- Toala et al. (2014) Toala, J.A., Guerrero, M.A., Gruendle, L.A., & Chu, Y.-H. 2014, AJ, 147, 30
- van der Hucht (2001) van der Hucht, K.A. 2001, New Astronomy Rev., 45, 135
- van der Hucht et al. (1986) van der Hucht, K.A., Cassinelli, J.P., & Williams P.M. 1986, A&A, 168, 111
- Vuong et al. (2003) Vuong, M.H., Montmerle, T., Grosso, N., Geigelson, E.D., Verstraete, L., & Ozawa, H. 2005, A&A, 408, 581
- Wrigge (1999) Wrigge, M. 1999, A&A, 343, 599
- Wrigge et al. (1994) Wrigge, M., Wendker, H.J., & Wisotzki, L. 1994, A&A, 286, 219
- Wrigge et al. (2005) Wrigge, M., Chu, Y.-H., Magnier, E.A., & Wendker, H.J. 2005, ApJ, 633, 248
- Weaver et al. (1977) Weaver, R., McCray, R., Castor, J., Shapiro, P., & Moore, R. 1977, ApJ, 218, 377
- Zhekov & Myasnikov (1998) Zhekov S.A., & Myasnikov, A.V. 1998, New Astronomy, 3, 57
- Zhekov & Park (2011) Zhekov, S.A., & Park, S. 2011, ApJ, 728, 135