Phase separation, competition, and volume-fraction control in NaFe1-xCoxAs
Abstract
We report a detailed nuclear magnetic resonance (NMR) study by combined 23Na and 75As measurements over a broad range of doping to map the phase diagram of NaFe1-xCoxAs. In the underdoped regime ( 0.017), we find a magnetic phase with robust antiferromagnetic (AFM) order, which we denote the s-AFM phase, cohabiting with a phase of weak and possibly proximity-induced AFM order (w-AFM) whose volume fraction % is approximately constant. Near optimal doping, at , we observe a phase separation between static antiferromagnetism related to the s-AFM phase and a paramagnetic (PM) phase related to w-AFM. The volume fraction of AFM phase increases upon cooling, but both the Néel temperature and the volume fraction can be suppressed systematically by applying a -axis magnetic field. On cooling below , superconductivity occupies the PM region and its volume fraction grows at the expense of the AFM phase, demonstrating a phase separation of the two types of order based on volume exclusion. At higher dopings, static antiferromagnetism and even critical AFM fluctuations are completely suppressed by superconductivity. Thus the phase diagram we establish contains two distinct types of phase separation and reflects a strong competition between AFM and superconducting phases both in real space and in momentum space. We suggest that both this strict mutual exclusion and the robustness of superconductivity against magnetism are consequences of the extreme two-dimensionality of NaFeAs.
pacs:
74.70.-b, 76.60.-kI Introduction
Competing electronic phases underlie a number of the most unconventional phenomena in condensed matter systems. When this competition is sufficiently strong, the usual outcome is a phase separation. One outstanding example of this situation is provided by materials showing colossal magnetoresistance, where competing magnetic interactions lead to phase separation between conducting ferromagnetic and insulating antiferromagnetic (AFM) regions Cheong_Nature_1999 . As a consequence, an external magnetic field can be used to control the resistance over many orders of magnitude, offering possible applications in electronic devices. In cuprate superconductors, the competition between antiferromagnetism and superconductivity forms the basis for the majority of the observed phenomena and for several classes of materials the debate can be phrased in terms of the extent to which phase separation is the outcome. The stripe phase, which has been the object of heated research interest for two decades, can be considered as a form of atomic-scale phase separation between AFM and superconducting (SC) regions, and such self-organizing heterostructures are a direct reflection of the electronic correlations whose effects are essential to understanding the mechanism of high-temperature superconductivity Kivelson_RMP_75_1201 .
The competition between AFM and SC phases also forms the foundation for the physics of iron-based superconductors Hosono_Jacs_130_3296 ; Chen_PRL_100_247002 ; Chen_Nature_453_761 ; Ren_CPL_12_105 ; Cruz_Nat_453_899 , where it is manifest in the emergence of a tetragonal SC phase upon doping- or pressure-induced suppression of an orthorhombic AFM phase. Iron-based superconductors have in common a quasi-two-dimensional atomic structure of weakly coupled FeAs or FeSe planes, although the exact crystal structure varies somewhat among the 1111, 122, 111, and 11 families of materials Paglione_Nature ; in fact the phenomena we report here will highlight some of the important differences arising between families as a consequence of the strength of their interplane coupling. Currently, the detailed phase diagram close to optimal doping (the concentration giving the maximum SC transition temperature, ) remains hotly debated, with evidence cited in favor of phase coexistence, of a possible AFM quantum critical point, or of heterostructures of AFM and SC phases. The levels of doping and disorder, and their impact on the phases and their competition, seem to vary between structural families, defying any search for universal properties. However, this variety does open additional avenues in the search for novel forms of phase separation or heterostructure formation, and with them the scope for obtaining further clues to the mechanism of high- superconductivity.
The 111 family is based on the materials LiFeAs and NaFeAs, with doping effected most easily as NaFe1-xCoxAs. The parent compound NaFeAs has a separate structural transition ( 55 K) and magnetic transition ( 41 K) Chen_PRL_102 ; SLPRB2009 , the latter to an AFM phase with small ordered moments ( 0.32/Fe) Ma_NaFeAs . Here we choose to use the notation , rather than , to reflect the strong local-moment character of the magnetic phase, an issue to which we return in Sec. VI. The separation of and , and also the relatively low values, count among the initial pieces of evidence for a rather weak interlayer coupling XuCK between FeAs planes in the NaFeAs system. The crystal quality, particularly the homogeneity of dopant distribution, is thought to be among the best in any iron-based superconductors, as measured in transition widths and observed by scanning tunneling microscopy (STM). Nevertheless, for underdoped 111 compounds a coexistence of inhomogeneous antiferromagnetism and superconductivity has been suggested by transport Chen_NaFeCoAs , angle-resolved photoemission spectroscopy (ARPES) Feng_PRX_2013 , and STM measurements WangYY_NC_2012 . By contrast, the “coexistence” of a strongly ordered AFM phase (s-AFM) and a weakly ordered one (w-AFM) on different spatial sites (this situation may be denoted more specifically as a “cohabitation”) has been reported from NMR measurements Halperin_2013 . Clearly a phase inhomogeneity is observed in all of these studies. However, a detailed analysis of the intrinsic properties of the primary phases, of the exact phase diagram around optimal doping, and of the different phase volume fractions, is still required.
In this paper, we exploit the power of NMR as a completely local probe to resolve the appearance and properties of the different AFM and SC phases in NaFe1-xCoxAs. For low dopings, we confirm the cohabitation of two regimes, s-AFM and w-AFM, finding that the w-AFM phase has a constant volume fraction of order ; this indicates an intrinsic effect unrelated to the doping concentration and we suggest that the w-AFM phenomenon is actually a proximity-induced moment distribution in a paramagnetic (PM) phase. For dopings around optimal, we find at 0.0175 ( 20 K) the onset of regions of antiferromagnetism below 25 K, where the AFM volume grows with cooling but the application of a magnetic field suppresses both and the magnetic volume fraction. At lower temperatures, superconductivity enters in the PM phase and its volume fraction increases at the expense of the AFM region both on cooling and (somewhat paradoxically) with increasing field. For ( 22 K), superconductivity suppresses not only AFM order but also the critical AFM fluctuations below , forming in the terminology of some authors the mechanism by which the AFM quantum critical point is “avoided.”
Our results present direct evidence for the mutual exclusion of antiferromagnetism and superconductivity, which leads to a “volume competition” between regions of established (finite-order-parameter) phases replacing each other in space in a first-order manner. This volume competition can be controlled systematically by the temperature and magnetic field, and we suggest that it exists in many other iron-based superconductors. Our detailed studies of the spin-lattice relaxation rate across the phase diagram indicate the importance of both itinerant (conduction-electron) and local-moment (valence-electron) contributions to both types of order. A theoretical interpretation of the strong competition points to the key role of the very two-dimensional (2D) Fermi surfaces in 111 systems and to orbital-selective phenomena depending on the specific bands involved at the different Fermi surfaces.
The structure of this paper is as follows. In Sec. II we summarize our basic sample properties and measurement procedures. We begin the presentation of our results in Sec. III by considering the nature of the AFM phases in the underdoped regime. In Sec. IV we focus on our samples close to optimal doping to elucidate the nature of phase cohabitation and volume competition. With these results in hand, in Sec. V we complete a detailed phase diagram for the NaFe1-xCoxAs system. Section VI contains an interpretation of our results and a discussion of their implications for the understanding of superconductivity in iron-based materials, concluded by a short summary.
II Materials and Methods
Our NaFe1-xCoxAs single crystals are synthesized by the flux-grown method with NaAs as the flux LiSL_PRB_2013 . The Co doping levels are monitored by the inductively coupled plasma (ICP) technique. However, ICP measurements are subject to significant inaccuracies and are by no means appropriate to establish the doping concentrations to the degree of precision required to study the NaFe1-xCoxAs system, where all doping levels are anomalously low (optimal doping %). Here we report the nominal stoichiometries of the different crystals and establish their relative doping values from our physical measurements by seeking continuity and possible irregularities (Sec. V).
The SC transition temperature was determined in situ by the sudden decrease in inductance of the NMR coil. The zero-field values at different dopings are consistent with earlier reports LiSL_PRB_2013 . We have performed NMR measurements on both the 23Na and 75As nuclei, with the field applied both within the crystalline -plane and along the -axis. We use a TecMag spectrometer and obtain the NMR spectra from the Fourier transform of the spin-echo signal. The spin-lattice relaxation rates and were measured by the inversion method and all magnetization recovery rates could be fitted well with the function (appropriate for nuclei).
For detecting the magnitude of the different ordered magnetic moments in the NaFe1-xCoxAs system, it is important to be able to use both the 23Na and 75As spectra, in order to exploit their very different relative hyperfine coupling strengths, Ma_NaFeAs . Because 23Na has a rather weak hyperfine coupling, the resulting narrow line width makes it a very accurate probe of magnetically ordered states with inhomogeneous moment distributions. By contrast, 75As has a strong hyperfine coupling, making it sensitive to very weak ordered moments and ideal for proving the absence of magnetic order in a true PM phase.
III Nature of Underdoped Phase Separation
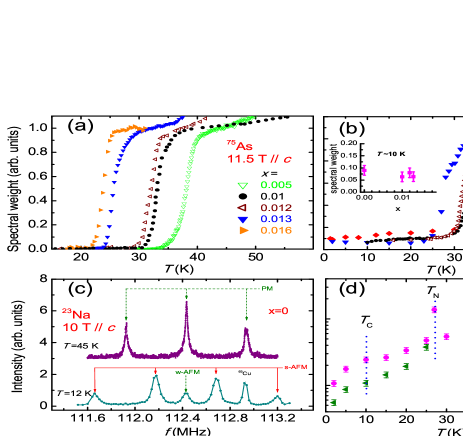
We begin by considering our underdoped samples to investigate the potentially inhomogeneous AFM phases reported previously Halperin_2013 . The onset temperature for the transition to magnetic order can be determined from the 75As and 23Na NMR spectra. Figure 1(a) shows the spectral weight of the center peak of the 75As spectrum as a function of temperature for five underdoped samples. This quantity is the PM signal and it drops sharply at the onset of magnetic order, as the character of the magnetic environment is altered and spectral weight is transferred away from the center. We determine the Néel temperature at each doping and we note that, far below , the spectral weight appears to decrease to zero, indicating no residual PM phase at any doping. In Fig. 1(b) we show the spectral weight of 23Na at the center frequency for four dopings up to . Again the sharp drop of spectral weight indicates the onset of AFM order. However, a residual 8 spectral weight persists far below for all dopings below [inset, Fig. 1(b)]. The spectra for the parent phase (), shown in Fig. 1(c), contain a PM signal with one center peak and two satellites above . Far below , there is a clear spectral splitting due to strong magnetic order, accompanied by a residual peak in the center. This result provides a good example of the sensitivity of 23Na measurements: our data demonstrate that a very weak AFM order must be present to account for the residual spectral weight and line-width broadening. This is consistent with the absence of the 75As PM signal, although the strong hyperfine coupling of 75As makes it difficult to discern the nature of the magnetic state. Below , the line width of the 23Na spectrum is approximately 35 kHz, and therefore the upper bound on the ordered moments is only of that in the parent compound, where the 23Na spectrum is split by 540 kHz.
The NMR study of Oh et al. Halperin_2013 reports two species of antiferromagnetism in a sample with 0.017, one with a large ordered moment (s-AFM) and the other one with a small moment (w-AFM). Our data from lower dopings are consistent with the finding of a small volume fraction of a w-AFM phase Halperin_2013 , but we find [inset, Fig, 1(b)] that this volume fraction does not change with doping. This result indicates that the appearance of the w-AFM phase is not an intrinsic consequence of Co doping; if it is a disorder effect then it must be of a different type, perhaps with its origin in a strain or chemical inhomogeneity. In Fig. 1(d), we present the spin-lattice relaxation rate, , measured at the peak frequencies of both the s-AFM and the w-AFM signals. As noted in Sec. II the magnetization recoveries at the two separate frequencies each follow the single-component function expected for nuclei. The relaxation rates for both signals fall at the same ordering temperature . For the w-AFM component, a phase having such a small ordered moment but a high onset temperature is generically very unlikely, and we suggest that the consistent explanation is a microscopic phase separation into AFM and PM regimes, but with weak magnetic order (appearing as the w-AFM phase) induced in the PM phase by its proximity to the s-AFM one. We note in addition that the significantly faster below in the w-AFM phase [Fig. 1(d)] is also consistent with spin fluctuations being only partially suppressed by a weak proximity effect.
The concept of “nanoscale phase separation” in iron-based superconductors is known from the depleted iron selenide materials Fe4Se5 (A = K, Rb, Cs, Tl; “245”) rme , which appear to show a robust AFM phase accompanied by an equally robust but quite separate PM phase; the latter is the only part of the system to turn SC at , forming a percolating SC phase despite having a volume fraction below 10%. However, it is generally thought that this phase separation is primarily a consequence of vacancy-induced structural inhomogeneity, causing a clear doping inhomogeneity, whereas our results (previous paragraph) appear to exclude this in NaFe1-xCoxAs. Here we observe for [Fig. 1(d)] that shows a similar fall in both the s- and w-AFM signals at , which is approximately 10 K in a field of 11.5 T. Although this result implies that the same type of SC state sets in at all lattice sites, we caution that the drop in is not at all sharp and the superconductivity is weak at best. We find only a very modest decrease in , by a factor of two from 10 K down to 2 K, whereas the data at , which we present in Sec. IV, show a much larger drop of below for the PM phase. For completeness, we comment here that we also did not find an appreciable decrease in the Knight shifts ( or ) below in the w-AFM phase (data not shown). However, it is worth noting that NMR results showing similar drops in far below for undoped NaFeAs and CaFe2As2 systems have been interpreted as a type of activated behavior of magnetic domain-wall motion Ma_NaFeAs ; Curro2 . We leave to a future study the investigation of whether the w-AFM phase may in fact arise from magnetic domain walls, whose characteristic width gives the small but doping-insensitive volume fraction we observe.
In this regime we can only report that our current data are not sufficient to differentiate between a scenario of microscopic coexistence, which would be expected to show a far clearer signal, and a scenario where the PM regime is a domain-boundary phase whose SC coherence length, unlike 245, exceeds the domain size (the length scale of the nanoscopic phase separation), causing proximity superconductivity to pervade the entire magnetic regime. We can state that our results are fully consistent with STM data for a similarly underdoped system ( 0.014) WangYY_NC_2012 , which show phase inhomogeneity, a SC gap on all sites, and a strong anticorrelation (competition) between the AFM and SC order, a topic we discuss next (Sec. IV). To summarize our analysis of the underdoped regime, our data for the constant w-AFM volume fraction and the common magnetic onset temperatures for s- and w-AFM are strong evidence in support of proximity magnetism in the w-AFM/PM phase. We return in Sec. VI to a detailed discussion of the phase separation between the PM and s-AFM regions, and of its implications for iron-based superconductivity.
IV Field-Controlled Volume Competition
We turn next to our results for crystals with slightly higher doping levels, (which we label NaCo175) and (NaCo190). The NaCo175 sample has a lower onset Néel temperature and smaller ordered moment, while NaCo190 shows no long-ranged magnetic order, and so these samples represent the evolution of the system to optimal doping.
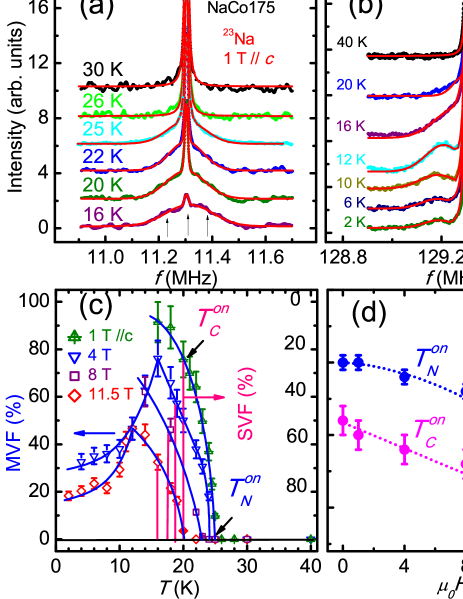
Figure 2(a) shows the 23Na spectra at selected temperatures in a field of 1 T oriented along the crystal -axis. The spectrum at 30 K shows a narrow line with a FWHM of approximately 5 kHz. On cooling to 25 K, a shoulder feature develops at both sides of the peak, which on further cooling grows in weight, whereas the weight of the center peak decreases. This feature indicates the development of two phases at low temperature, with PM sites giving the sharp center peak and magnetic sites giving the broad shoulders, which in contrast to undoped NaFeAs Ma_NaFeAs show a wide distribution of local fields. Here 25 K is the onset temperature of antiferromagnetism. By measuring the RF inductance, we find that the onset temperature of superconductivity is 20 K, and below 16 K the spectrum becomes too small to detect because of strong RF screening in the SC phase.
As shown in Fig. 2(a), the spectra below can be fitted by two superposed Gaussian functions. We deduce the magnetic volume fraction (MVF) from the ratio of the spectral weight, taken from the Gaussian fit, of the magnetic (shoulder) feature to the total weight. The MVF at a field of 1 T is shown as a function of temperature in Fig. 2(c), where it clearly starts to develop at 25 K, and increases with cooling. At K, the MVF reaches 90, indicating that the sample is almost entirely magnetic. The average ordered moment for the magnetic part can also be estimated from the NMR spectrum, as the extension of the shoulder away from the central peak reflects the increase of internal static field (ordered moment). At K, the FWHM of the magnetic part of the spectrum is approximately 150 kHz, which corresponds to of the moment in the parent compound NaFeAs Ma_NaFeAs , or in other words an average moment of /Fe with a spatially inhomogeneous distribution. This behavior suggests that AFM order develops in islands below and enlarges on cooling both in moment size and especially in volume fraction.
At higher magnetic fields, both and the MVF are suppressed. Figure 2(b) shows 23Na spectra in a field of 11.5 T applied along . The spectrum is single-peaked and sharp above 20 K, with no shoulder feature and hence no static magnetism. Below this, the shoulder appears and we fit the spectrum with three Gaussian functions to account for the center (PM) and shoulder (magnetic) components. In Fig. 2(c), the MVF at 11.5 T is seen to increase on cooling, similar to the low-field data, but with a lower onset temperature ( 20 K) and a lower MVF at 12 K. Similar results for intermediate fields, also shown in Fig. 2(c), demonstrate the continuous nature of these effects.
The most striking feature of Fig. 2(c) occurs at the onset of superconductivity (). Above , the MVF increases monotonically on cooling at a fixed field, but below it falls away; at 11.5 T ( = 18 K), the MVF decreases from 50 at 12 K to 18 at 2 K. This behavior demonstrates a direct competition for volume fraction between antiferromagnetism and superconductivity, which is also visible in the spectra shown in Fig. 2(b). In Fig. 2(d), we show both and as functions of field. shows a quite significant decrease with field, which can be fitted by the functional form , producing an estimate of the critical field for to occur at T. By contrast, the field-induced decrease of is slower, consistent with the critical field for superconductivity being located at T in this system Wright_PRB_2014 , and suggesting that antiferromagnetism is suppressed at far lower fields than superconductivity. We comment here that such strong field effects on are highly unusual in iron-based SC materials, where the in-plane magnetic interactions are normally many tens of meV, and we stress that this result is obtained only for our samples close to optimal doping. For the underdoped samples discussed in Sec. III, we found no significant field-induced changes either to or to the s-AFM volume fraction up to 12 T (data not shown). We return to this issue in Sec. VI.
Indeed our MVF data demonstrate that superconductivity is more stable than antiferromagnetism, replacing it at low temperatures for all fields. We will show later that for , superconductivity occupies the PM phase, but not the AFM phase, during the replacement process. If the RF screening is non-uniform and strong in the SC regions, then our data provide an upper bound for the MVF below . The drop of MVF on cooling indicates that the SC volume fraction, meaning the fraction of a percolating SC state, increases. However, the average moment in the magnetic regions remains large, /Fe, when , and therefore we observe that AFM and SC order compete over the system volume, excluding each other in a first-order manner rather than coexisting with a reduced order parameter. Although competitive behavior of antiferromagnetism and superconductivty has been reported by neutron scattering studies of the Ba(Fe1-xCox)2As2 system Fernandes , these cannot distinguish whether the phases compete by order-parameter suppression (second order) or volume suppression (first order). Our unambiguous demonstration of volume competition in NaFe1-xCoxAs is a key result whose origin and implications we discuss in Sec. VI.
Turning now to further details of magnetism in the NaCo175 sample, we note that the observed shoulder spectrum of 23Na is consistent with the s-AFM phase reported in Sec. III, but with the lower value expected at a higher doping. However, there is no longer any evidence for ordered moments in the 23Na PM signal, suggesting that the w-AFM phase is absent at this doping. We confirm that the absence of ordered moments is not a resolution issue by comparing with the 75As NMR spectrum. As noted in Sec. II, 75As has a much stronger hyperfine coupling than 23Na, and therefore its strong sensitivity to any weak magnetic order makes it the optimal probe for excluding a w-AFM component in the PM signal. As shown in the inset of Fig. 3(b), the 75As spectrum is single-peaked at all temperatures. A narrow line with FWHM 14 kHz is observed above K, and below this its spectral weight begins to decrease due to the increasing AFM volume fraction. The AFM signal lies outside our 75As measurement window, because its FWHM is very large (it can be estimated from the 23Na data to be around 2.4 MHz). The single-peaked form of the 75As spectrum below is consistent with the PM 23Na signal, which remains sharp on cooling. Below K, the spectra shift downward, as expected for singlet superconductivity, and at this point the 23Na spectrum does become broadened; at 6 K, far below , we observe a FWHM 24 kHz as a consequence of the vortex structure in the SC phase. This value of the FWHM sets a strict limit on the ordered moment of the PM phase, which should be less than of the moment in NaFeAs (0.32/Fe), and thus effectively excludes any possibility of w-AFM character at .
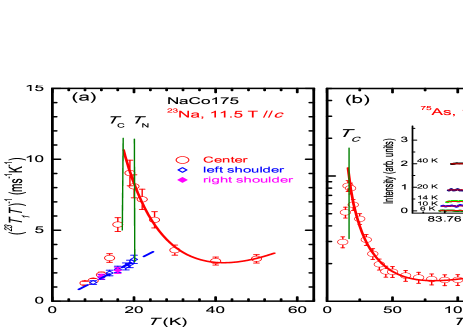
Next we focus on the SC state of the NaCo175 sample. At low temperatures, the PM phase is found to be purely superconducting by inspection of the spin-lattice relaxation rates for both 23Na and 75As. Figure 3(a) shows in a field applied along the -axis; above we observe a decrease on cooling down to 40 K, followed by an increase on further cooling below 40 K. The high-temperature behavior is consistent with local-moment fluctuations Ma_prb_84 and the low-temperature upturn with the spin fluctuations of itinerant electrons at the Fermi surface Ma_prb_84 ; Ji_prl_2013 . Below , is no longer uniform, showing a different form if taken at different parts of the spectrum. For the shoulder, drops quickly to a small value below , as a consequence of the onset of static AFM order. For the peak, continues to increase on cooling, falling only when the SC state is reached. Figure 3(b) shows the corresponding results taken from 75As, which are naturally uniform because the spectra [inset, Fig. 3(b)] have only a PM peak and no shoulders. From K down to 80 K, decreases linearly with temperature due to thermal excitation of local spin fluctuations in 2D Ma_prb_84 . Below 80 K, the relaxation rate increases strongly with the form characteristic of low-energy itinerant spin fluctuations J.Mag.Mag.Mat.100 . The uniform sharp drop of at for the PM signal of both nuclei indicates that the PM state becomes fully SC and it is believed from ARPES measurements that a full gap opens at all points on the Fermi surface; however, we comment that NMR data have not been able to verify this second point directly (the apparent linear form of visible around in Fig. 3(a), which may be of extrinsic or intrinsic origin).
The spin-lattice relaxation rates in Fig. 3(a) suggest further that the s-AFM phase is not strongly coupled to superconductivity. Measurements of for magnetic sites (in the shoulder of the spectrum) show a drop at , where magnetic order sets in, but there is no discernible drop at . Thus there is no evidence that the s-AFM phase supports even weak or proximity superconductivity. We stress that at 12 K and 11.5 T, deep within the ordered phases, reaches a similar value for sites in both the SC and the s-AFM regions. This appears to be a clear statement that electrons on the Fermi surface are gapped by either type of order, and, taken together with Fig. 2(c), that relaxation contributions become dominated by SC electrons at low temperatures. This again reflects the fact that the competition between antiferromagnetism and superconductivity for electrons on the Fermi surface (i.e. in reciprocal space), and its apparent first-order nature, results in the volume competition (in real space) we observe in the NMR spectra.
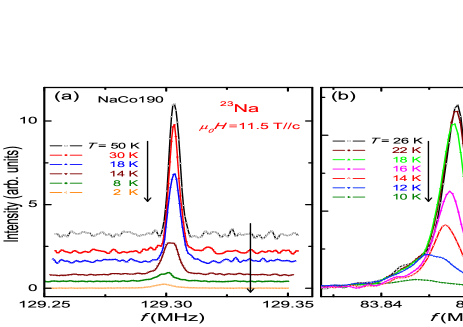
Finally, we comment that further information concerning the volume-competition effect can be gained by investigating samples with higher doping, namely . Our NaCo190 sample shows a structural transition at K, which we discuss in detail in Sec. V. Figures 4(a) and (b) show respectively the 23Na and the 75As spectra for different temperatures. For 23Na, the spectrum is single-peaked and no shoulder feature develops on cooling, even down to 2 K. This observation excludes the existence not only of a possible w-AFM component but also of the s-AFM phase. For 75As, the spectrum also has a single peak, with FWHM 40 kHz at the lowest temperatures, which also excludes any type of AFM order. Below 18 K, the spectra shift to lower frequencies and a line broadening is clearly visible for 75As, which is the hallmark of the onset of singlet-pairing superconductivity. Thus the effect of doping on volume competition is to terminate the battle in favor of superconductivity at , where one finds a single, uniform phase with only structural and SC transitions, but a complete absence of AFM order.
V Phase Diagram
We now compile all of our results, from samples across the full range of doping, to prepare a definitive phase diagram. First, the structural transition can be detected from the frequency of a chosen satellite line in the 75As spectrum Ma_NaFeAs , which is shown in Fig. 5(a) as a frequency shift relative to the center line. When the field is applied in the -plane, cooling from the tetragonal to the orthorhombic phase causes each satellite to shift and to split into two due to sample twinning. The sudden change of the satellite frequency as a function of temperature, clearly visible in Fig. 5(a), determines for the structural transition at each doping. We comment here that above this satellite frequency, which for perfect field alignment is the quadrupole frequency , is generally expected to show a systematic increase with sample doping Lang_PRL_104_097001 ; however, such a dependence is barely discernible in our data [Fig. 5(a)] due to the fact that the maximum doping we studied in the NaFe1-xCoxAs system is so low (). The variation in our measured values of above for the different samples is in fact dominated by the small but finite misalignment of the magnetic field, whose exact orientation with respect to the crystalline -and -axes was not determined. NMR provides an accurate measurement of up to , beyond which the sample remains tetragonal at all temperatures.
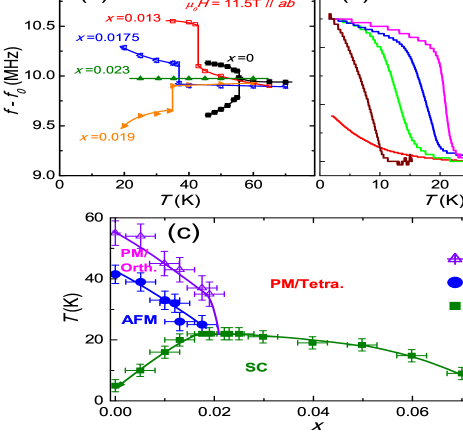
Next, the transition to static magnetic order can be detected at all dopings by the decrease of the PM spectral weight, as shown in Figs. 1(a) and (b). Finally, the SC transition is detected by the relative inductance change of the NMR coil, as noted in Sec. II and shown in Fig. 5(b); these measurements can also be benchmarked from the drop of the NMR Knight shift and the spin-lattice relaxation rate, at least for (see Sec. III). In Fig. 5(c) we present the hierarchy of deduced transition temperatures, which show the clear evolution characteristic of iron-based superconductors. In the parent compound, NaFeAs, the system becomes fully magnetic below K, but as electron doping is induced by Co substitution, the antiferromagnetism is gradually suppressed and superconductivity develops.
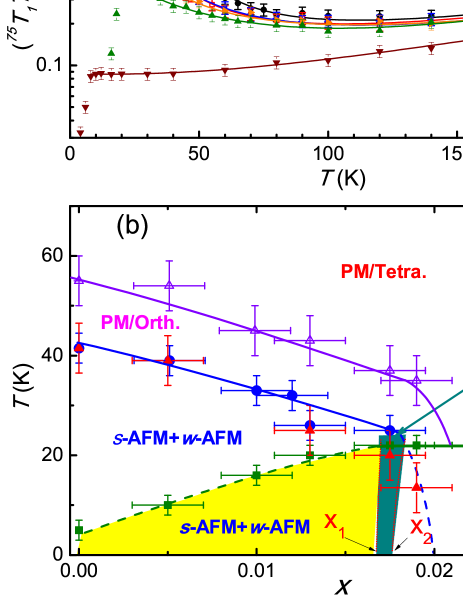
However, in NaFe1-xCoxAs there is a complementary approach to obtaining the phase diagram, which is that all three phase transitions can be detected directly and accurately in the spin-lattice relaxation rate. This is not possible in other pnictide materials, and as we explain below it is also a consequence of the strongly 2D fluctuations acting in the 111 system. In Fig. 6(a) we show , obtained over the full range of available dopings with the field applied in the -plane, a geometry known Kita_JPSJ_77_114709 ; Ning_PRL_104 to maximize the sensitivity of the measurement to the dominant in-plane spin fluctuations in pnictides as the magnetically ordered state is approached. At high temperatures, the values are similar for all dopings other than the heavily doped sample, and fall slowly on cooling down to 100 K. Below 100 K, a Curie-type upturn develops for all dopings (other than ), becoming progressively stronger for lower doping values. Clearly the low-energy spin fluctuations responsible for this behavior, which have an itinerant origin, are suppressed strongly by increasing doping, reflecting a very high sensitivity to details of the Fermi surface. By contrast, the very small change above 100 K suggests an origin in local-moment (valence-electron) fluctuations, consistent with a general two-component interpretation of the spin response in pnictides Ma_prb_84 .
If the low-temperature data are fitted with the function , one may extract a Curie temperature . The structural transition can be deduced by considering the quantity , as shown in the inset of Fig. 6(a) for different underdoped and near-optimal dopings. To a good approximation, can be fitted with two straight lines of different gradients, one (which we denote ) corresponding to the tetragonal structure and the other, , to the orthorhombic one. The change in this gradient gives the structural transition temperature . The values of and can be obtained from the intercept of the fitting line with .
We find that the values of (obtained by extrapolation from above ) are all negative and decrease with doping, but these are of limited physical meaning because the tetragonal structure is replaced at , perhaps precisely because it does not allow the magnetic transition from which the orthorhombic phase can profit. By contrast, , which is determined from the structure and data below , is positive and decreases with doping up to . The fact that is far larger than reinforces the evidence that the low-energy spin fluctuations are strongly enhanced below , suggesting a clear role for the magnetic sector in driving the structural transition. Although there is already significant evidence for a coupling between the lattice structure and the magnetism in 111 materials Ma_NaFeAs , this coupling is manifestly not strong enough that coincides with , as it does in the 122 system. As noted in Sec. I, some authors XuCK have taken the lack of coincidence between and as a hallmark of strong two-dimensionality in some iron pnictide materials.
As noted above, the Néel temperature is determined directly from the decrease of the PM spectral weight [Figs. 1(a), 1(b), 5(c)]. For NaFe1-xCoxAs, the fitting parameter , which we obtain from our data below , has exactly the same value as for . This extremely significant result has not been reported in any other iron pnictide systems. is a true measure of static AFM order, setting in due to all of the couplings in the system. By contrast, is a measure of the 2D spin fluctuations of the FeAs planes. For quasi-2D systems, the energy scale of in-plane fluctuations () sets a characteristic temperature in the spin response, but true long-range order is forbidden by the Mermin-Wagner theorem. However, a weak coupling between these planes is sufficient to create long-range order in three dimensions and the transition temperature will be . Only when becomes a significant fraction of will the planar physics be supplemented by conventional three-dimensional fluctuations and will exceed by an amount depending on . The magnetic interactions in the parent compound NaFeAs have been measured directly in a very recent study of spin-wave dispersion relations by inelastic neutron scattering Zhang_PRL_112_217202 . These authors find in-plane couplings meV, meV, and meV, respectively for superexchange processes in the , , and diagonal () directions in the FeAs plane, where is the effective spin (moment) on the Fe ions, but an interplanar coupling of only meV. Thus our observation of perfect coincidence between and is completely consistent with the measured value , reflecting the minimal contributions from interplanar coupling, and these results form the best evidence yet available for the extremely 2D nature of the NaFeAs system. We defer a discussion of the microscopic implications of this result to Sec. VI.
We are now in a position to present the complete phase diagram, which is shown in Fig. 6(b). We begin by drawing attention to the error bars on the doping () axis, which given the extreme sensitivity of the system to small changes in is critical information. As noted in Sec. II, we do not possess probes capable of determining the doping level to the 0.1% accuracies mandated by the physics of NaFe1-xCoxAs, and so we have taken the nominal doping in every case. However, we are able to benchmark our samples against each other and the remarkably smooth evolution in properties, as well as the perfect match between the datasets, shown in Figs. 5(c) and 6(b), indicates that our conservative estimate of the doping error as 0.2% is reasonable. This smooth evolution over such a fine range of doping also supports the suggestion that NaFe1-xCoxAs provides some of the most homogeneous and highest-quality crystals of any iron-based SC material. Returning to the matching of datasets between Figs. 5(c) and 6(b), the agreement in benchmarks the value of the analysis of Fig. 6(a); the agreement in is perfect for , but the values extracted from at lower dopings are inaccurate for the reasons discussed in Sec. III, and so the data shown in Fig. 6(b) for the underdoped samples are those of Fig. 5(c); the agreement between and is remarkable for the reasons discussed above.
Our NMR data [Figs. 5(c) and 6(b)] provide direct evidence for a complete separation of and at all dopings in NaFe1-xCoxAs, with the structural transition always occurring some 1215 K above the magnetic one. Thus, in common with the majority of iron-based SC systems, the coupling between the lattice and the magnetism is “subcritical” in the sense of a combined transition. The line terminates at a slightly higher doping than , and in fact at a value coinciding with optimal doping, as indicated also in transport studies Chen_NaFeCoAs . The line is quite flat in the doping range , whereas all of , , and change dramatically. In the zero-temperature limit, antiferromagnetism and superconductivity cohabit for , as shown in Sec. IV [Fig. 2(c)], but within the phase-separated s-AFM and PM (w-AFM) regions (Sec. III). We comment again here that the onset of the w-AFM phase at the same temperature, , as the s-AFM one suggests that the former is actually a set of narrow PM regions ordered by a proximity effect. Above , the s-AFM and w-AFM phases “coexist,” by which we mean “cohabit as phase-separated regions,” in the doping range and the s-AFM and PM phases cohabit over the range , as represented in Fig. 6(b). Our data fix the values and .
To determine the detailed structure of the phase diagram close to optimal doping, we show in Fig. 6(b) all of the values of determined from the Curie-Weiss fit below . As noted above, coincides with for 0.0175. However, for doping , determined from the curve above predicts a finite Néel temperature (13.5 K) below (22 K). In a scenario where antiferromagnetism and superconductivity coexist, one might expect a magnetic quantum critical point () to occur at 0.02. However, we demonstrated at the end of Sec. IV that AFM order is completely absent for . Thus we conclude that in NaFe1-xCoxAs, the appropriate scenario for the regime is a complete suppression of long-range AFM order by volume competition (Sec. IV).
Given that 25 K at and 13.5 K at , it is reasonable to estimate that the AFM transition line touches the SC dome at 0.018, although we do not have samples with this doping. Because superconductivity suppresses the MVF below , we expect that the s-AFM transition line is pushed to lower dopings below , as also represented in the slope of the line to () in Fig. 6. For all dopings () beyond this line, our experiments show unequivocally that the system is single-phased with only one transition, the onset of superconductivity in a structurally tetragonal system.
VI Discussion
Our NMR measurements across the phase diagram in NaFe1-xCoxAs reveal a number of key features, including the first-order volume competition, the microscopic phase separation, and the dominance of superconductivity at low temperatures. We discuss these points in turn, finding that their common denominator is the two-dimensional nature of the NaFeAs system.
Beginning with the volume competition effect, the large changes of the MVF we observe (Sec. IV) as functions of both temperature and field suggest a mutual exclusion of AFM and SC order in real space. Such a real-space competition implies a first-order transition between two states with finite order parameters, which would appear to reflect a strong competition in reciprocal space, meaning for electrons at the Fermi surface. Certainly the fact that the low-energy spin fluctuations, which are due to itinerant (Fermi-surface) contributions Ji_prl_2013 , are fully gapped below both and for the 0.0175 sample suggests that both types of order, stabilized by their own particular Fermi-surface electronic order parameter ( or ), compete for the same electrons.
Such a temperature- and field-controlled magnetic and SC volume fraction has not been reported in any other iron pnictides. We suggest that there are two reasons why this highly unconventional phenomenon has been observed (to date) only in NaFe1-xCoxAs. One is the extreme 2D nature of the Fermi surfaces and the other is the very fine control of the doping level, which is obtained in NaFeAs systems with no loss of chemical homogeneity.
Addressing first the two-dimensionality, the question of whether electronic correlation effects result in competition or coexistence between antiferromagnetism and superconductivity has been fraught with contradictions in the iron-based SC systems. Microscopic coexistence of AFM and SC order has been reported in several compounds with the 122 structure, including by some of us Laplace_prb ; Ma_prl_109_197002 ; Li_prb_86_180501 ; Iye_JPSJ ; Julien_epl_2009 . AFM and SC states in iron-based SC materials depend rather sensitively on the interactions of quasiparticles at the Fermi surface, and as a result it was suggested in Ref. Ma_prl_109_197002 that the ability of an iron-based SC system to host both types of order may be dictated by the variety of projected 2D Fermi surfaces available. The -axis band dispersion in BaFe2As2 is quite significant Vilmercati_PRB_79_220503 , making it possible that the 122 structure may allow the coexistence of the two types of order for electrons on different parts of the Fermi surface. In Ba(Fe1-xRux)2As2, the fact that drops due to gap formation at and again at demonstrates that additional SC electrons are present in the AFM phase Ma_prl_109_197002 . By contrast, this dispersion is much weaker in the NaFe1-xCoxAs system, as shown both by ARPES studies Feng_JPCS_2011 ; WangSC_APL_2012 and by the present results (Sec. V), indicating a highly 2D system with little flexibility in Fermi-surface sizes and spanning wave vectors. This leaves little option for the AFM and SC order but to “fight it out” for the available electrons, leading to the strong competition we observe (Sec. IV): in NaFe1-xCoxAs, drops only at or at , and to the same low-temperature value, showing directly that antiferromagnetism and superconductivity compete for the same electrons. Our results suggest strongly that the microscopic coexistence of AFM and SC order is not possible in NaFe1-xCoxAs, which among other things should exclude any intrinsic superconductivity on sites with s-AFM order in the underdoped region (Sec. III).
On this note, we turn next to the issue of phase separation, for which we find evidence throughout the phase diagram. Clearly distinguishable s-AFM and w-AFM regions are present in the underdoped system (Sec. III), although the volume fraction of the w-AFM phase barely changes with either doping or temperature and there is only one magnetic transition. At near-optimal underdopings, there is clear phase separation between the AFM and PM/SC regions, demonstrated very explicitly by the large changes of AFM and SC volume fractions we observe in our NaCo175 sample as functions of both temperature and field (Sec. IV), which strongly suggest a first-order transition between the two phases. The phase diagram of Fig. 6(b) shows directly that the optimal is achieved when both the AFM and orthorhombic phases are suppressed. Although this type of phase diagram has been interpreted as an incipient AFM quantum critical point of the orthorhombic system, in reality its suppression by the onset of the mutually exclusive (volume-competitive) SC phase is the dominant physics.
Such a complex phase diagram may also exist in other iron-based SC systems, although, for reasons of the fine doping control mentioned above, none has yet been resolved in the kind of detail possible in NaFe1-xCoxAs. Within this intricate phase structure, the inevitable presence of weak disorder could certainly provide an extrinsic origin for the phase separation of s-AFM and w-AFM regions in the underdoped regime. However, we appeal again to the evidence for remarkably high sample homogeneity in NaFe1-xCoxAs and to the obvious fact of very low carrier densities. If the origin of phase separation between the s-AFM and w-AFM regions is the same as that between the s-AFM and PM/SC regions near optimal doping, then such behavior may in fact be intrinsic in systems with strong electronic correlations. In cuprate materials, the stripe phase Tranquada may be considered as an atomic-scale phase separation of AFM and PM/SC regions. Similar phase separation has been reported recently close to the phase boundary both in an organic superconductor Brooks_PRL_2014 and in heavy-fermion superconductors tuned by pressure and magnetic field Seo_NP_2014 .
Complete nanoscale phase separation is familiar in iron-based SC materials from the case of the 245 iron selenides. However, as noted in Sec. III, the situation in NaFe1-xCoxAs does not appear to be the same, first in that structural and hence doping inhomogeneity is significant in 245 materials and second in that weak superconductivity can be observed throughout the sample below . In Sec. III we outlined two scenarios for the present result, a microscopic coexistence or a microscopic phase separation, and, as noted above, the results of Sec. IV make a coexistence appear extremely unlikely. Although we cannot claim evidence for a nanoscale phase separation from our data, all of our results are consistent with such a scenario, under the proviso that the length scale of the phase-separation phenomenon be extremely short. We have observed a phase susceptible to an apparent bulk magnetic order by proximity effects, which is a definite statement that the phase-separation length scale should be short compared to the magnetic correlation length. The weakness and feeble onset of the apparent bulk SC regime could be the fingerprints of proximity superconductivity originating in narrow PM regions but spreading throughout the very small magnetic domains. Microscopically, in the absence of doping inhomogeneity effects, the scale of the phenomenon is expected to result from a subtle interplay between electronic correlations and lattice or charge inhomogeneities (independent of Co doping), and could indeed be on the nanometer scale.
First-order phase separation close to the AFM quantum phase transition has certainly been suggested in other iron-based SC materials, most notably BaFe2-xNixAs2, although the fact that and merge in the 122 systems may cause qualitative differences in the phase diagram. One key proposal from these neutron scattering studies is an incommensurate nature of the resulting AFM phase LuXY . If the direct volume competition of the AFM and SC phases we observe below takes place in a nanoscale lamellar structure, then an incommensurate AFM signal may indeed be observed. A different interpretation, namely a double quantum critical point, has been offered from combined transport and NMR studies in BaFe2-xNixAs2 ZhengGQ , but the magnetic structure below was not resolved. NMR measurements on Ba(Fe1-xCox)2As2 suggest a cluster spin-glass phase close to optimal doping CurroNJ ; in NaFe1-xCoxAs this type of physics can be excluded explicitly from our data, which do not contain the stretched spin recovery of a spin glass, indicating again the high quality of our samples.
One of the fundamental questions in formulating a microscopic model for the iron-based SC materials is the equitable treatment of local-moment (valence-electron) and itinerant (conduction-electron, or Fermi-surface) contributions to the macroscopic properties of magnetism and pairing. Returning again to the key observation (Sec. IV) of large changes in the MVF with both temperature and field, these suggest a microscopic phase separation, which one expects to be driven by a first-order magnetic quantum phase transition. Because the field is applied along the -axis, which is perpendicular to the direction of the ordered moments, a spin-flop transition cannot account for the observed field effect. Rather, the strong suppression of by an applied field near optimal doping (Sec. III; the rate is approximately K/T close to ), the classical critical behavior with increasing field [Fig. 2(d)], and the extreme field sensitivity to the competing SC phase close to the putative magnetic quantum critical point, all suggest that the interactions causing AFM order are largely local in nature.
In this context it is worth remarking that for overdoped systems up to 0.07, where low-energy spin fluctuations are entirely absent [Fig. 6(a)] but is still approximately 10 K, it is local-moment spin fluctuations originating in the valence electrons that provide the pairing interactions for superconductivity. High-pressure NMR studies in overdoped NaFe1-xCoxAs samples demonstrate direct contributions to superconductivity from both itinerant-electron spin fluctuations (which are pressure-dependent) and local-moment fluctuations (which are largely pressure-independent) Ma_prl_109_197002 . Thus it is clear that both local-moment magnetism and itinerant electrons are required for a complete understanding of the nature of antiferromagnetism and superconductivity, and in this light we revisit the key result of Sec. V that . The low-energy spin fluctuations causing the Curie-Weiss upturn in , and hence determining , are due only to Fermi-surface electrons, so the equality with indicates only very weak contributions to long-range order from an inter-plane interaction (Sec. V), which from the previous paragraph we conclude is mediated by local-moment fluctuations. This result, demonstrating clearly the extremely 2D nature of the NaFeAs system, suggests that the cornerstone of a microscopic model should be the itinerant contribution to (planar) magnetic order, without which the local-moment interactions appear quite unable to order alone.
Finally, we comment that the suppression of antiferromagnetism by superconductivity at low temperatures for the sample, even though exceeds , indicates that the SC phase possesses additional electronic or magnetic channels with which it can “win” against AFM order. A full microscopic model of the band structure, Fermi surfaces, and correlation effects due to valence-electron contributions is required to account for this effect, and here we can only present the possibilities suggested by our data. One may be that superconductivity competes only with the AFM tendencies of the itinerant electrons, which in other iron-based superconductors are reinforced by sizeable local-moment contributions, but that (previous paragraph) the extremely 2D nature of NaFeAs weakens this link to the point that the AFM phase is disrupted completely.
The microscopic physics underlying such behavior will be found naturally in an orbital-specific model. Even in a fully 2D system, the electronic bands of iron pnictides contain five different -orbitals, and hence many degrees of freedom in orbital symmetries and admixtures. Antiferromagnetism and superconductivity are favored by itinerant electrons in bands of different orbital content, and the unique feature of NaFe1-xCoxAs is that the band occupations, and thus their Fermi surfaces, are inordinately sensitive to the doping because of the highly 2D nature of the system. A recent ARPES study of NaFe1-xCoxAs samples with small and large Ye_PRX_2013 has provided some indications for orbital-selective connections between the competing AFM and SC phases, specifically concerning the relative and content of the bands near the Fermi surface. We suggest that similarly detailed studies of samples near optimal doping have the potential to reveal the underlying physics of NaFeAs.
In summary, by using NMR as a local probe sensitive to both antiferromagnetism and superconductivity, we observe a strong volume competition between the two phases at the boundary of the antiferromagnetic phase transition in NaFe1-xCoxAs. The volume fractions of the two phases can be controlled by varying both the temperature and the applied magnetic field, and show a complete mutual exclusion in real space. Thus our NMR data support a first-order phase transition between antiferromagnetism and superconductivity, which is driven by the competition between their electronic order parameters in reciprocal space. As striking as the volume competition effect is the exquisite sensitivity of the competition to doping, with optimal doping and all of the phase-separation effects occuring between 0 and 2%. These phenomena have their origin in the extremely weak interplane coupling in the NaFeAs materials, resulting in a very two-dimensional nature of the electronic band structure, and hence of the Fermi surfaces. One key anomaly compared to other iron-based superconductors is the winning of superconductivity over antiferromagnetism in real space at moderate underdopings, even where the magnetic transition temperature is higher, suggesting that the generic behavior of a two-dimensional iron pnictide may be for the electronic or magnetic channels of the Fermi-surface electrons to favor superconductivity. Further, because the very weak Co doping also appears to be remarkably homogeneous, NaFe1-xCoxAs is an excellent system in which to seek evidence of unconventional phases arising purely due to intrinsic electronic correlations. For this we obtain additional information concerning the w-AFM minority phase, which may be a paramagnetic regime occurring as thin lamellae due to nanoscale phase separation, but appears antiferromagnetic by proximity for underdoped samples and is the first region to turn superconducting on the approach to optimal doping.
Acknowledgements.
We are grateful to T. Giamarchi, S. P. Kou, H. H. Wen, Z. Y. Weng, and R. Yu for helpful discussions. Work at Renmin University of China was supported by the National Basic Research Program of China under Grant Nos. 2010CB923004, 2011CBA00112, and 2012CB921704 and by the NSF of China under Grant Nos. 11174365, 11222433, and 11374364. Work at Rice University and the University of Tennessee in Knoxville was supported by the US DOE Office of Basic Energy Sciences through contracts DE-SC0012311 (P.D.) and DE-FG02-08ER46528 (C.L.Z).References
- (1) M. Uehara, S. Mori, C. H. Chen, and S.-W. Cheong, Nature 399, 560 (1999).
- (2) S. A. Kivelson, I. P. Bindloss, E. Fradkin, V. Oganesyan, J. M. Tranquada, A. Kapitulnik, and C. Howald, Rev. Mod. Phys. 75, 1201 (2003).
- (3) Y. Kamihara, T. Watanabe, M. Hirano, and H. Hosono, J. Am. Chem. Soc. 130, 3296 (2008).
- (4) G. F. Chen, Z. Li, D. Wu, G. Li, W. Z. Hu, J. Dong, P. Zheng, J. L. Luo, and N. L. Wang, Phys. Rev. Lett. 100, 247002 (2008).
- (5) X. H. Chen, T. Wu, G. Wu, R. H. Liu, H. Chen, and D. F. Fang, Nature 453, 761 (2008).
- (6) Z. A. Ren, W. Lu, J. Yang, W. Yi, X. L. Shen, Z. C. Li, G. C. Che, X. L. Dong, L. L. Sun, F. Zhou, and Z. X. Zhao, Chin. Phys. Lett. 25, 2215 (2008).
- (7) C. de la Cruz, Q. Huang, J. W. Lynn, J. Li, W. Ratcliff II, J. L. Zarestky, H. A. Mook, G. F. Chen, J. L. Luo, N. L. Wang, and P. Dai, Nature 453, 899 (2008).
- (8) J. Paglione and R. L. Greene, Nature Phys. 6, 645 (2010).
- (9) G. F. Chen, W. Z. Hu, J. L. Luo, and N. L. Wang, Phys. Rev. Lett. 102, 227004 (2009).
- (10) S. Li, C. de la Cruz, Q. Huang, G. F. Chen, T.-L. Xia, J. L. Luo, N. L. Wang, and P. Dai, Phys. Rev. B 80, 020504(R) (2009).
- (11) L. Ma, G. F. Chen, D. X. Yao, J. Zhang, S. Zhang, T.-L. Xia, and W. Yu, Phys. Rev. B 83, 132501 (2011).
- (12) Y. Qi and C. Xu, Phys. Rev. B 80, 094402 (2009).
- (13) A. F. Wang, X. G. Luo, Y. J. Yan, J. J. Ying, Z. J. Xiang, G. J. Ye, P. Cheng, Z. Y. Li, W. J. Hu, and X. H. Chen, Phys. Rev. B 85, 224521 (2012).
- (14) Q. Q. Ge, Z. R. Ye, M. Xu, Y. Zhang, J. Jiang, B. P. Xie, Y. Song, C. L. Zhang, P. Dai, and D. L. Feng, Phys. Rev. X 3, 011020 (2013).
- (15) P. Cai, X. D. Zhou, W. Ruan, A. F. Wang, X. H. Chen, D. H. Lee, and Y. Y. Wang, Nature Commun. 4, 1596 (2013).
- (16) S. Oh, A. M. Mounce, J. A. Lee, W. P. Halperin, C. L. Zhang, S. Carr, P. Dai, A. P. Reyes, and P. L. Kuhns, Phys. Rev. B 88, 134518 (2013).
- (17) G. T. Tan, P. Zheng, X. C. Wang, Y. C. Chen, X. T. Zhang, J. L. Luo, T. Netherton, Y. Song, P. C. Dai, C. L. Zhang, and S. L. Li, Phys. Rev. B 87, 144512 (2013).
- (18) A review may be found in A. M. Zhang, K. Liu, J. B. He, D. M. Wang, G. F. Chen, B. Normand, and Q. M. Zhang, Phys. Rev. B 86, 134502 (2012).
- (19) N. J. Curro, A. P. Dioguardi, N. apRoberts-Warren, A. C. Shockley, and P. Klavins, New J. Phys. 11, 075004 (2009).
- (20) S. Ghannadzadeh, J. D. Wright, F. R. Foronda, S. J. Blundell, S. J. Clarke, and P. A. Goddard, Phys. Rev. B 89, 054502 (2014).
- (21) R. M. Fernandes, D. K. Pratt, W. Tian, J. Zarestky, A. Kreyssig, S. Nandi, M. G. Kim, A. Thaler, N. Ni, P. C. Canfield, R. J. McQueeney, Jörg Schmalian, and A. I. Goldman, Phys. Rev. B 81, 140501(R) (2010).
- (22) L. Ma, G. F. Ji, Jia Dai, J. B. He, D. M. Wang, G. F. Chen, B. Normand, and W. Yu, Phys. Rev. B 84, 220505(R) (2011).
- (23) G. F. Ji, J. S. Zhang, L. Ma, P. Fan, P. S. Wang, J. Dai, G. T. Tan, Y. Song, C. L. Zhang, P. Dai, B. Normand, and W. Yu, Phys. Rev. Lett. 111, 107004 (2013).
- (24) T. Moriya, J. Mag. Mag. Mat. 100, 261 (1991).
- (25) G. Lang, H.-J. Grafe, D. Paar, F. Hammerath, K. Manthey, G. Behr, J. Werner, and B. Büchner, Phys. Rev. Lett. 104, 097001 (2010).
- (26) K. Kitagawa, N. Katayama, K. Ohgushi, M. Yoshida, and M. Takigawa, J. Phys. Soc. Jpn 77, 114709 (2008).
- (27) F. L. Ning, K. Ahilan, T. Imai, A. S. Sefat, M. A. McGuire, B. C. Sales, D. Mandrus, P. Cheng, B. Shen, and H. H. Wen, Phys. Rev. Lett. 104, 037001 (2010).
- (28) C. L. Zhang, L. W. Harriger, Z. Yin, W. Lv, M. Wang, G. Tan, Y. Song, D. L. Abernathy, W. Tian, T. Egami, K. Haule, G. Kotliar, and P. Dai, Phys. Rev. Lett. 112, 217202 (2014).
- (29) Y. Laplace, J. Bobroff, F. Rullier-Albenque, D. Colson, and A. Forget, Phys. Rev. B 80, 140501(R) (2009).
- (30) L. Ma, G. F. Ji, J. Dai, X. R. Lu, M. J. Eom, J. S. Kim, B. Normand, and W. Yu, Phys. Rev. Lett. 109, 197002 (2012).
- (31) Z. Li, R. Zhou, Y. Liu, D. L. Sun, J. Yang, C. T. Lin, and G.-q. Zheng, Phys. Rev. B 86, 180501(R) (2012).
- (32) T. Iye, Y. Nakai, S. Kitagawa, K. Ishida, S. Kasahara, T. Shibauchi, Y. Matsuda, and T. Terashima, J. Phys. Soc. Jpn. 81, 033701 (2012).
- (33) M.-H. Julien, H. Mayaffre, M. Horvatić, C. Berthier, X. D. Zhang, W. Wu, G. F. Chen, N. L. Wang, and J. L. Luo, Eur. Phys. Lett. 87, 37001 (2009).
- (34) P. Vilmercati, A. Fedorov, I. Vobornik, U. Manju, G. Panaccione, A. Goldoni, A. S. Sefat, M. A. McGuire, B. C. Sales, R. Jin, D. Mandrus, D. J. Singh, and N. Mannella, Phys. Rev. B 79, 220503(R) (2009).
- (35) C. He, Y. Zhang, X. F. Wang, J. Jiang, F. Chen, L. X. Yang, Z. R. Ye, Fan Wu, M. Arita, K. Shimada, H. Namatame, M. Taniguchi, X. H. Chen, B. P. Xie, and D. L. Feng, J. Phys. Chem. Solids 72, 479 (2011).
- (36) Z.-H. Liu, P. Richard, Y. Li, L.-L. Jia, G.-F. Chen, T.-L. Xia, D.-M. Wang, J.-B. He, H.-B. Yang, Z.-H. Pan, T. Valla, P. D. Johnson, N. Xu, H. Ding, and S.-C. Wang, Appl. Phys. Lett. 101, 202601 (2012).
- (37) J. M. Tranquada, B. J. Sternlieb, J. D. Axe, Y. Nakamura, and S. Uchida, Nature 375, 561 (1995).
- (38) A. Narayanan, A. Kiswandhi, D. Graf, J. Brooks, and P. Chaikin, Phys. Rev. Lett. 112, 146402 (2014).
- (39) S. Seo, X. Lu, J.-X. Zhu, R. R. Urbano, N. Curro, E. D. Bauer, V. A. Sidorov, L. D. Pham, T. Park, Z. Fisk, and J. D. Thompson, Nature Phys. 10, 120 (2014).
- (40) X. Lu, H. Gretarsson, R. Zhang, X. Liu, H. Luo, W. Tian, M. Laver, Z. Yamani, Y.-J. Kim, A. H. Nevidomskyy, Q. Si, and P. Dai, Phys. Rev. Lett. 110, 257001 (2013).
- (41) R. Zhou, Z. Li, J. Yang, D. L. Sun, C. T. Lin, and G.-q. Zheng, Nature Commun. 4, 2265 (2013).
- (42) A. P. Dioguardi, J. Crocker, A. C. Shockley, C. H. Lin, K. R. Shirer, D. M. Nisson, M. M. Lawson, N. apRoberts-Warren, P. C. Canfield, S. L. Bud’ko, S. Ran, and N. J. Curro, Phys. Rev. Lett. 111, 207201 (2013).
- (43) Z. R. Ye, Y. Zhang, M. Xu, Q. Q. Ge, Q. Fan, F. Chen, J. Jiang, P. S. Wang, J. Dai, W. Yu, B. P. Xie, and D. L. Feng, unpublished (arxiv:1303.0682).