Crossovers in supercooled solvation water: Effects of hydrophilic & hydrophobic interactions
Abstract
Systematic 8 ns ab initio molecular dynamics (AIMD) were performed to study the structure and dynamics of water in bulk and close to hydrophobic (CH3) and hydrophilic (carbonyl) groups of tetramethylurea (TMU). Dynamical behaviour showed two crossovers: The first around the hydrophobic group at K, and the second at 5 K related to the relative strengths of water-water and water-carbonyl hydrogen bonds (HBs). For bulk water, relaxation times appear to diverge at K, rendering support to the liquid-liquid critical point hypothesis. To identify the effects due to the hydrophilic carbonyl group, systems of water with one methane molecule were used as references. Our findings are related to the structural and thermodynamic transitions reported for proteins in solution and may play a role in cold denaturation.
pacs:
82.30.Rspacs:
83.10.Rs1 Introduction
Although possibly the most investigated substance, water still holds many puzzles. For bulk water, one of the fundamental questions is the proposed existence of a liquid-liquid critical point at K [1]. Proposed by Poole et al. already in 1992 [1], it remains a topic of intense interest [2, 3, 4]. In addition to the fundamental properties of bulk water, precise information about the interplay between hydrophobic and hydrophilic interactions is crucial for understanding the physical mechanisms in biological systems. Proteins and lipids contain both hydrophobic and hydrophilic parts that respond to the presence of water differently depending on the thermodynamic and physiological conditions. For example, Toppozini et al. reported a series of melting transitions using neutron scattering with cooling and heating of lipid bilayers [5]: A melting transition at 252 K for the acyl tail dynamics and solvation water, and at 264 K for lipid diffusion. Mazza et al. reported two distinct crossovers at and 181 K in protein hydration [6].
Small hydrophobes are perhaps the simplest systems for investigating the physical origins of such effects. In elegant experiments, Qvist and Halle used 2H nuclear magnetic resonance (NMR) to demonstrate that solvation water around small hydrophobes undergoes a crossover from high activation energy to low activation energy rotation (with respect to bulk H2O) at K [7]. They predicted that far below , solvation water should rotate faster than bulk water, thus at low temperatures contradicting the famous iceberg model of hydration[8] which has been demonstrated in higher temperatures by femtosecond mid-infrared (fs-IR) spectroscopy by Rezus and Bakker [9]. Qvist and Halle found to be close to the dynamic crossover temperature of 252 K reported for protein solvation and attributed to fluctuations in HB formation [6], and a melting peak reported for myoglobin between 250 K and 260 K [10]. Classical MD has been used extensively to explore the low temperature behaviour of water [1, 11, 12, 13, 14]. The temperatures at which water’s anomalies occur are, however, strongly force-field dependent: Commonly used water models put the melting point between 190 and 274 K [15].
2 Simulation details
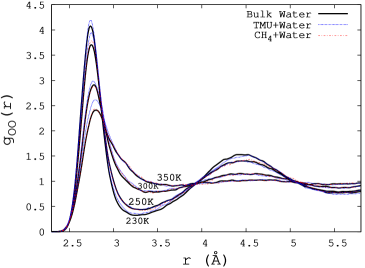
We used AIMD within the Born-Oppenheimer approximation to investigate the temperature dependence of dynamic and structural properties of water solvating a hydrophobic TMU for temperatures from 230 to 370 K. Crossover behaviours in bulk water, and water close to both hydrophobic and hydrophilic groups were studied. The total simulation time was over 8 ns making this among the most comprehensive AIMD studies of this kind. The CPMD code [16] in the NVT ensemble was used. The BLYP (Becke-Lee-Yang-Parr) [17, 18] functional was used with van der Waals interactions via the DFT-D3 parametrization [19]. For C, O and N, Troullier-Martins [20] pseudopotential was applied, and Kleinman-Bylander [21] was used for hydrogen. Time step of 0.121 fs was used and the production simulations ranged from more than 100 ps at high temperatures to over 500 ps at low temperatures. The production runs were preceded by conjugate gradient relaxation of positions and wave functions, and at least 50 ps equilibration. Other simulation details are as in refs. [22, 23]. Reproducibility is illustrated in fig. 1 where O-O pair correlations for water molecules in bulk, in the water+TMU system, and in the CH4+water system are shown. Beyond the 1st coordination shell, all the correlations for the same temperatures are practically identical. The difference in the 1st shell is a consequence of solute-induced translational ordering in the surrounding water.
3 OH stretch frequency
We start from the time correlations of OH stretch frequency vibrations (): , with , and is the average over time and OH groups. is accessible by fs-IR [24, 25]. We performed a time series analysis, as introduced by Mallik et al. [26], to determine the time-dependent OH stretch vibrational frequencies. Since this method underestimates the OH stretch frequency of water by about 6 % [26, 23], the frequencies were rescaled by a factor of 1.06.
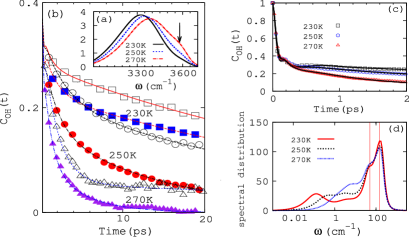
Figure 2a shows the time-averaged frequency distributions for bulk water. As temperature decreases, water molecules vibrate with lower frequency, a signature of HB strengthening. Another interesting feature is the appearance and increase in the proportion of dangling OH bonds at 3600 cm-1 (arrow, fig. 2a) as temperature increases.
| 230 | 0.304 | 0.326 | 0.086 | 3.7 | 143 | 49 | 0.09 | 0.13 | 0.57 | 42.20 |
| 240 | 0.229 | 0.400 | 0.121 | 5.4 | 152 | 42 | 0.10 | 0.10 | 2.00 | 27.90 |
| 250 | 0.133 | 0.466 | 0.139 | 4.9 | 153 | 46 | 0.12 | 0.09 | 1.11 | 20.50 |
| 260 | 0.289 | 0.270 | 0.214 | 4.4 | 138 | 52 | 0.09 | 0.13 | 0.42 | 4.40 |
| 280 | 0.223 | 0.162 | 0.299 | 5.3 | 155 | 62 | 0.10 | 0.14 | 0.16 | 1.92 |
| 300 | 0.120 | 0.231 | 0.281 | 18.3 | 134 | 61 | 0.12 | 0.10 | 0.15 | 1.44 |
| 320 | 0.159 | 0.069 | 0.453 | 6.6 | 154 | 91 | 0.12 | 0.17 | 0.13 | 0.75 |
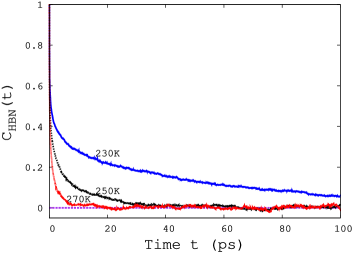
is shown in figs. 2b & c. For bulk, decays faster compared to solvation water, in agreement with anisotropy fs-IR measurements [9, 27]. The correlation functions are characterized by weakly temperature-dependent fast 50-60 fs initial decay and a recoil at fs, plateauing between 200 and 500 fs and a long time decay tail beyond 500 fs. Similar plateauing has been reported based on the mean-square displacement of water molecules for wait times of 300-500 fs [28]. Modeling the short-time dynamics with a damped oscillatory function has been suggested to explain spectral dynamics at 298 K [29, 26]. To include the oscillations for the O-O-O caging effect, we modified the model to
| (1) | |||||
Parameters are shown in Table 1. The above equation reproduces the fast initial decay with time-scale , the HB stretch recoil period , and the plateau life-time , a consequence of the cage vibrations (period ) of the surrounding water molecules. This latter is destabilized above 275 K: This mode is more important in supercooled temperatures where more stable cages are preponderant. The parameter accounts for the 15-20 fs mismatch between echo-peak shift measurement and the OH stretch-frequency correlation function [25]. Cage dynamics is responsible for vibrations with wave number cm-1 usually found in the spectra of water [30]. It is also very close to the recently reported 40 cm-1 mode termed Boson peak in deep supercooled water [31, 32]; the Boson peak has also been observed in proteins, and associated with collective modes and hydration-related multiple energy minima [33, 34]. The long time tail is modeled by two exponentials. The spectral functions are shown in fig. 2d. For the spectral function, the Fourier transform of the time correlation was multiplied by [35]. In deep supercooled temperatures (230 and 250 K), four modes are found: Strongly temperature dependent (0.01-1 cm-1), the intermediate - (1-10 cm-1), the cage mode (40-60 cm-1), and the HB stretch mode (140-180 cm-1) [30]. The -mode is barely seen as a tail at 270 K. The mode at 0.01-1 cm-1 compares well with depolarized light scattering measurements [36].
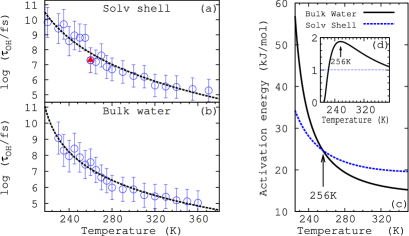
Correlation times were obtained by integrating eq. 1. Their temperature dependencies are shown in figs. 3a & b for CH contact water and bulk water, respectively. To check reproducibility, independent trajectories were generated at 260 K. Figure 3a shows the two correlation times obtained from two independent trajectories. They are practically identical, showing the robustness of the results.
The critical temperature of 21310 K for bulk water is less than the reported 228 K[37], 227 K[37, 2] & 225 K[38], although within margin of error. The large uncertainty is an inherent difficulty of the AIMD approach at low temperatures. Although not conclusively, the apparent divergence of dynamic properties lends support to the liquid-liquid critical point scenario in deep supercooled water [1].
4 Activation energies & HBs
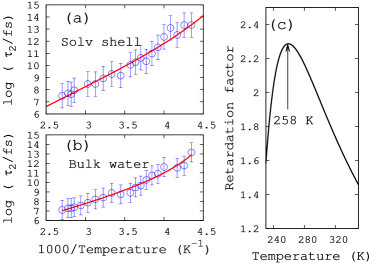
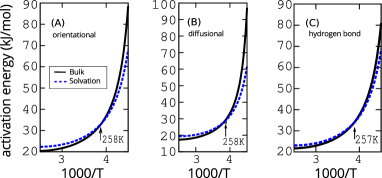
Activation energies were determined using Results for bulk and contact water are shown in fig. 3c. In agreement with Qvist and Halle [7] and Tielrooij et al. [39, 27], activation energies for contact water are higher than for bulk water at high temperatures. As temperature is lowered below the crossover temperature 2564 K, the activation energy of bulk water becomes larger than that of solvation water. This is in excellent agreement with the 2H NMR result 2 K [7]. As the inset fig. 3d shows, the OH stretch correlation-based perturbation factor has a maximum of 1.9 at 256 K. We also computed the retardation factor, that is, ratio of the solvation shell and bulk correlation times computed from rotational dynamics as is typically done in experiments. Rotational dynamics was obtained from the correlation function , where is the 2nd order Legendre’s polynomial, the angle an OH bond vector sweeps through in time and stands for averaging over water molecules and time. The correlation times and the retardation factor are shown in fig. 4. For the latter, we obtained 2.28. This compares well with the NMR value of 2.09 [7]. Classical MD on trimethylamine N-oxide (TMAO)-water system found a slightly lower crossover temperature of K and a retardation factor of 1.5 [40]. The NMR result is 1.92 [7].
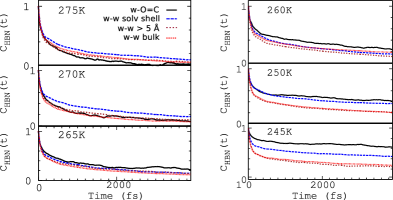
Crossovers have been reported in the properties of solvation water of proteins and lipids, and in the dynamics of lipid tails around [6, 5, 10]. To study the effects of the hydrophilic carbonyl group, the HB lifetimes were examined. Three types of HBs were distinguished: (i) between two water molecules in the bulk, (ii) between water molecules in the solvation shell of the CH group, and (iii) between a water molecule and the oxygen atom of the carbonyl group. H-bonds were determined using the usual geometric criterion (distance less than the first minimum of and angle ) [22]. The time correlation of each HB population was computed using
| (2) |
where is the number of HBs per species (categories (i)-(iii) above) and . Within the simulation times and temperatures investigated, this quantity is fully decorrelated. The results for bulk water at 230, 250 and 270 K up to 100 ps are shown in fig. 5. Results for the three categories of H-bonds are shown in fig. 6. At high temperatures, the HBs in the solvation shell persist longer than in bulk: The hydrophobic effect dominates. Solvation shell HBs are also stronger than HBs between water molecules and the carbonyl oxygen; at higher temperatures the water molecules are too fast to form stable HBs with the carbonyl oxygens. This agrees well with IR spectroscopy where fast HB dynamics at few hundred femtoseconds has been observed by monitoring the O-D stretch perturbation in the neighbourhood of lipid carbonyl groups [41], and the observation of moderate HB slowing down in hydrophilic solvation [42]. For 265 K, the water-carbonyl oxygen HBs become longer-lived than bulk and solvation water HBs: Water-carbonyl binding crossover is located at 2655 K. This is a hydrophobic/hydrophilic crossover and it has also been reported for water confined in carbon nanotubes upon cooling from 295 to 281 K [43].
Increasing strength of the carbonyl-water HBs upon cooling is in agreement with ref. [44]. This trend is crucial for understanding cold denaturation: A consequence of strengthened hydrophilicity at low temperatures [44], rather than purely hydrophobicity as often implied from the Kauzmann model [45]. The strengthening of water-carbonyl HBs upon cooling, evident from the sudden increase in the HB strength at 255 K, is consistent with the finding that a crossover at 252 K for protein solvation water is due to a large increase of HBs within the solvation shell [6, 46]. Such a crossover is not found for bulk water, although at 213 K the relaxation times seem to diverge. Such a temperature cannot be studied with current AIMD approach and we therefore term this temperature as ”temperature of apparent divergence”. The presence of the crossover temperature for solvation water at 256 K pushes the apparent divergence to 190 K. The 190 K crossover for a water monolayer hydrating a hydrophobic surface is associated to the Widom line departing from the liquid-liquid critical point, while the crossover at 252 K is associated to a specific heat maximum that is consequence of the structural change due to the formation of a macroscopic number of HBs in the shell as discussed in ref. [47]. Besides understanding water’s anomalies and phase transitions [1, 2, 3, 4], its behaviour at supercooled temperatures has broad practical importance [48, 6]. For example, unlike in bulk water, in cold denaturation water does not crystallize on proteins’ surfaces allowing for preservation of cells. Another example of the importance of understanding water’s low temperature behaviour is clathrate formation. A complete study locating the liquid-liquid critical point requires constant pressure simulations at various pressures or simulations at various densities and is beyond the scope of this work.
The crossover from high activation energy process at higher temperature to low activation energy dynamics at lower temperature is not unique to OH stretch motion. In fig. 7 we show similar crossover behaviour for the OH rotational dynamics, diffusion and the single HB life-span. Rotational dynamics in fig 7A was obtained from the correlation function as defined above. All of the measurements indicate crossovers at temperatures close to the experimentally reported value of 2552 K [7]. This may be expected since rotational dynamics and diffusivity of water are strongly governed by HB dynamics.
5 Structural properties
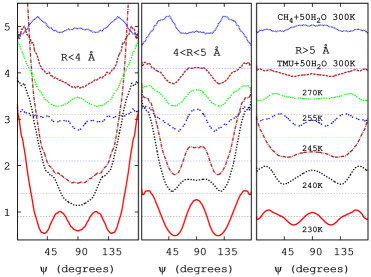
Next, we study the structural changes accompanying the dynamic crossover. First, we analyzed the distribution of the angle . This angle is defined for each water molecule as that between the normal to the surface of a sphere around each of the CH groups of the TMU molecule (or methane) and the normal to the surface formed by the three atoms of the water molecule [49]. The former normal is on a line connecting the carbon atom of the methyl group and the oxygen atom of the water molecule. This angle, termed twist angle by Hore et al. [49], has been used to describe water’s rotational motion around proteins [50]. We performed additional 60-200 ps simulations for the solvation water of a methane molecule at 240, 250, 280, 300, 320 and 350 K.
The temperature dependence of is shown in fig. 8 for the TMU molecule. Results for the methane system at 300 K are also shown as the uppermost curves. For =0 and 180∘, the water molecule’s plane is tangential to the surface of the CH group while for =90∘ it is perpendicular to it. As the rightmost panel shows, for the TMU molecule, water molecules beyond 5 Å maintain isotropy at high temperatures. But as water molecules get closer to the hydrophobic surface, tangential arrangement is preferred, especially at supercooled temperatures. As the temperature crosses 255 K, a drastic increase in the fraction of water molecules adopting a tangential arrangement appears. At K almost all the water molecules in the solvation shell adopt a tangential arrangement. This tangential arrangement of water planes together with the tangential dipole moment (discussed below) suggest a sort of carpeting of the surface of the hydrophobic groups by water. To test this hypothesis, we computed the connectivity of the HBs of the water molecules that are within 4 Å from the methyl group. We find that for each molecule, 2.00.2 HBs emanate from water molecules that are also within 4 Å radius. The other HBs are from water molecules further away; dangling bonds are essentially avoided. These further water molecules are those sequestrating the bulk and the solvation water as was found earlier by Hore et al. [49]. In the case of the solvation water of methane (about 19 water molecules) there are both tangential and sequestrating water molecules in the solvation shell, which suggests that this observed behaviour for TMU may be mediated by the hydrophilic carbonyl-water interaction.
A Raman study on the OH vibrations of water in alcohols showed an increase in the population of water molecules vibrating with lower frequency for solvation water together with the decrease in the population of dangling bonds of the solvation water of hydrophobic interfaces. This was interpreted as a signature of increased tetrahedral order for solvation water [51]. Consideration of other order parameters such as translational order, orientational order and water plane’s orientation angle (twist angle) reveals different type of ordering for solvation water as compared to bulk water. For CH4 and TMU at 300 K, we find a marginal decrease to values of and 0.65, respectively, of the tetrahedral order of solvation water with respect to bulk water (). The usual definition of tetrahedral order was applied, i.e., for 4-coordinated water molecules, where is the angle subtended on the central oxygen by the oxygen atoms of water molecules and which both belong to the nearest neighbour shell of the central water molecule.
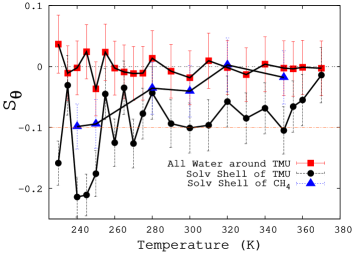
Waters’ orientational ordering around the TMU methyl groups was characterized by the order parameter , where is the angle the dipole moment of water makes with the normal to the surface of the closest methyl group. For an isotropic system, =0. Figure 9 shows that the average over all water molecules is 0 and that restricting sampling to the solvation shell gives non-vanishing negative values. Above 350 K, . Below 255 K a significant decrease occurs around 245 K. A weak but monotonically increasing order around the fully hydrophobic CH4 molecule (fig. 9) is contrasted by the rapid increase in ordering of TMU’s solvation water as temperature is lowered below the crossover. The change in the relative strengths of the hydrophobic and hydrophilic interactions [44] (solvation free energies) around the crossover is the probable reason for the difference. These findings, with fig. 8, suggest enhanced structuring for TMU solvation water for the range 235-255 K. We speculate that this may be related to the stabilized water-carbonyl HBs which are absent in the methane solution. We caution, though, that at very low temperatures sampling is limited as manifested by the spike below 240 K.
6 Conclusions
The effect of temperature on water’s OH stretch-frequency correlation function was used to investigate the proposed dynamic crossover from highly thermally activated vibrational motion of solvation water at higher temperatures to weak temperature dependent motion below 2564 K. This crossover, attributed to hydrophobic effect, is preceded by one at 2655 K. The latter crossover is a hydrophilic one: The weak water-carbonyl HB (with respect to water-water HB) at higher temperatures gives way to the stronger water-carbonyl HB. The dynamic crossovers are accompanied by structural changes in solvation water, where water molecules tend to carpet the surface of the hydrophobes by forming two in-plane HBs and two sequestrating HBs that connect solvation water with bulk water. These findings may be related to the various structural and thermodynamic transitions reported for a wide range of proteins in solution and shed light on the mechanism of cold denaturation of proteins.
References
- [1] \NamePoole P. H., Sciortino F., Essmann U. Stanley H. E. \REVIEWNature3601992324.
- [2] \NameTaschin A. et al. \REVIEWSci. Rep.420132401.
- [3] \NameMallamace F., Corsaro C. Stanley H. E. \REVIEWProc. Natl. Acad. Sci. USA11020134899.
- [4] \NameLimmer D. T. Chandler D. \REVIEWProc. Natl. Acad. Sci. USA11120149413.
- [5] \NameToppozini L. et al. \REVIEWISRN Biochem.20122012520307.
- [6] \NameMazza M. G. et al. \REVIEWProc. Natl. Acad. Sci. USA108201119873.
- [7] \NameQvist J. Halle B. \REVIEWJ. Am. Chem. Soc.130200810345.
- [8] \NameFrank H. S. Evans M. W. \REVIEWJ. Chem. Phys.131945507.
- [9] \NameRezus Y. Bakker H. J. \REVIEWPhys. Rev. Lett.992007148301.
- [10] \NameDoster W. et al. \REVIEWBiophys. J.501986213.
- [11] \NameCuthbertson M. J. Poole P. H. \REVIEWPhys. Rev. Lett.1062011115706.
- [12] \NameHolten V. Anisimov M. A. \REVIEWSci. Rep.22012713.
- [13] \NameKumar P. et al. \REVIEWProc. Natl. Acad. Sci. USA10420079575.
- [14] \NameRusso J. Tanaka H. \REVIEWNat. Commun.520143556.
- [15] \NameVega C., Sanz E. Abascal J. L. F. \REVIEWJ. Chem. Phys.1222005114507.
- [16] \BookThe CPMD program www.cpmd.org/ ©IBM Corp 1990-2008, MPI für Festkörperforschung 1997-2001, 2000-2015 jointly by IBM Corp. and Max Planck Inst., Stuttgart.
- [17] \NameBecke A. D. \REVIEWPhys. Rev. A3819883098.
- [18] \NameLee C., Yang W. Parr R. G. \REVIEWPhys. Rev. B371988785.
- [19] \NameHujo W. Grimme S. \REVIEWJ. Chem. Theo. Comput.92013308.
- [20] \NameTroullier N. Martins J. L. \REVIEWPhys. Rev. B4319911993.
- [21] \NameKleinman L. Bylander D. M. \REVIEWPhys. Rev. Lett.4819821425.
- [22] \NameTitantah J. T. Karttunen M. \REVIEWJ. Am. Chem. Soc.13420129362.
- [23] \NameTitantah J. T. Karttunen M. \REVIEWSci. Rep.320132991.
- [24] \NameFecko C. J. et al. \REVIEWScience30120031698.
- [25] \NameFecko C. et al. \BookDynamics of hydrogen bonds in water: Vibrational echoes and two-dimensional infrared spectroscopy in Proc. of \BookUltrafast phenomena XIV, edited by \NameKobayashi T. et al. 2005 pp. 535–538.
- [26] \NameMallik B. S., Semparithi A. Chandra A. \REVIEWJ. Phys. Chem. A11220085104.
- [27] \NamePetersen C., Tielrooij K.-J. Bakker H. J. \REVIEWJ. Chem. Phys.1302009214511.
- [28] \NameGallo P., Rovere M. Spohr E. \REVIEWPhys. Rev. Lett.8520004317.
- [29] \NameMoller K., Rey R. Hynes J. \REVIEWJ. Phys. Chem. A10820041275.
- [30] \NameTsai K. Wu T. \REVIEWChem. Phys. Lett.4172006389.
- [31] \NameCaponi S. et al. \REVIEWPhys. Rev. Lett.1022009027402.
- [32] \NameKumar P. et al. \REVIEWSci. Rep.320131980.
- [33] \NameJoti Y., Kitao A. Go N. \REVIEWJ Am Chem Soc12720058705.
- [34] \NameKurkal-Siebert V. Smith J. C. \REVIEWJ Am Chem Soc12820062356.
- [35] \NameGuillot B. \REVIEWJ. Chem. Phys.9519911543.
- [36] \NameComez L. et al. \REVIEWJ. Phys. Chem. Lett.420131188.
- [37] \NameTorre R., Bartolini P. Righini R. \REVIEWNature4282004296.
- [38] \NameChu X. Q. et al. \REVIEWPhys. Rev. E82201020501.
- [39] \NameTielrooij K.-J. et al. \REVIEWJ. Am. Chem. Soc.132201015671.
- [40] \NameDuboué-Dijon E., Fogarty A. C. Laage D. \REVIEWJ. Phys. Chem. B11820141574–1583.
- [41] \NameVolkov V., Takaoka Y. Righini R. \REVIEWPhys. Chem. Chem. Phys.1120099979.
- [42] \NameSterpone F. et al. \REVIEWJ. Phys. Chem. B11420102083.
- [43] \NameWang H.-J., Xi X.-K., Kleinhammes A. Wu Y. \REVIEWScience322200880.
- [44] \NameBen-Naim A. \REVIEWAdv. Biol. Chem.3200329.
- [45] \NameKauzmann W. \REVIEWAdv. Prot. Chem.1419591.
- [46] \NameMazza M. G. et al. \REVIEWJ. Chem. Phys.1372012204502.
- [47] \NameBianco V. Franzese G. \REVIEWSci. Rep.42014.
- [48] \NameChen S.-H. et al. \REVIEWProc. Natl. Acad. Sci. USA10320069012.
- [49] \NameHore D. K., Walker D. S. Richmond G. L. \REVIEWJ. Am. Chem. Soc.13020081800.
- [50] \NameVogel M. \REVIEWJ. Phys. Chem. B11320099386.
- [51] \NameDavis J. G. et al. \REVIEWNature4912012582.