HKS (JLab E05-115 and E01-011) Collaborations
The experiments with the High Resolution Kaon Spectrometer at JLab Hall C and the new spectroscopy of hypernuclei
Abstract
Since the pioneering experiment, E89-009 studying hypernuclear spectroscopy using the reaction was completed, two additional experiments, E01-011 and E05-115, were performed at Jefferson Lab. These later experiments used a modified experimental design, the “tilt method”, to dramatically suppress the large electromagnetic background, and allowed for a substantial increase in luminosity. Additionally, a new kaon spectrometer, HKS (E01-011), a new electron spectrometer, HES and a new splitting magnet (E05-115), were added to produce new data sets of precision, high-resolution hypernuclear spectroscopy. All three experiments obtained a spectrum for , which is the most characteristic -shell hypernucleus and is commonly used for calibration. Independent analyses of these different experiments demonstrate excellent consistency and provide the clearest level structure to date of this hypernucleus as produced by the reaction. This paper presents details of these experiments, and the extraction and analysis of the observed spectrum.
pacs:
21.80.+a, 25.30.Rw, 21.60.Cs, 24.50.+gI Introduction
Spectroscopic investigation of hypernuclei is a unique method which provides invaluable information on many-body baryonic systems by inserting a new degree of freedom, “strangeness”, into the nucleus. Since the is not Pauli-blocked, it can occupy any single-particle state, providing a distinguishable probe of the nuclear interior Povh87 ; Chrien89 ; Bando90 . Therefore, new nuclear structures or unknown properties of the baryonic interaction, which cannot be seen from the investigation of ordinary nuclei with conventional probes, may manifest themselves in hypernuclei, providing indispensable information on flavor SU(3) for baryonic matter. In addition, a study of hypernuclear spectra provides the only practical way to study the interaction, as scattering experiments are technically difficult or impossible.
Aside from strangeness, another important feature is the absence of isospin (I = 0) of the . As isospin conservation prevents one-pion-exchange (OPE) in the interaction, the long range OPE component is absent and thus the interaction is more sensitive to short range components of the strong interaction than the nucleon-nucleon interaction. Since decays weakly and has a relatively long lifetime ( ps), the spectroscopy of hypernuclei features narrow states commonly described by coupling low-lying nuclear-hole states to single particle states with widths ranging from a few to keV. This makes detailed spectroscopic studies possible.
A phenomenological approach to -shell hypernuclei introduces a two-body effective potential Dalitz78 ; Millener85 in form of
| (1) |
where . Low-lying levels of -shell hypernuclei can be described with radial integrals over the wave function for each of the five terms in Eq. (1). A set of these integrals, denoted as , , , and , can be determined from selected -shell -hypernuclear spectroscopy and then used to fit the interactions.
The other approach applies a G-matrix derived from models (Nijmegen Rijken99 ; Rijken06 ; Rijken10 ; Yamamoto13 or Jülich Haidenbauer05 ; Haidenbauer13 ) which describe the Baryon-Baryon interactions including the free interactions. When using this more direct description, the properties of interaction models can be explored. However, high precision spectroscopy is required with either approach in order to obtain reliable information on the unique characteristics of the interaction.
Traditionally the spectroscopy of hypernuclei were obtained using beams of pions or kaons, either stopped in a target or in-flight. In reactions such as or , a nucleon in a target was replaced by a . However, the resolution using mesonic beams was limited to about or more than 1.5 MeV (FWHM) due to the fact that these beams are produced by reactions of a primary beam on a production target and thus are limited in intensity. To compensate for the low beam intensity, thick targets () were used broadening the resolution by the uncertainty in energy loss. Weakly excited states, particularly low-lying states, were difficult to resolve and their binding energies inaccurately extracted. Yet in many cases the weakly produced states are quite important when comparing an experiment to theoretical calculations. For example, the recent high precision -transition spectroscopy experiments at KEK and AGS reported a total of 22 precisely measured level transitions for several -shell hypernuclei Hashimoto06 . These results enabled a detailed theoretical study of -shell hypernuclei. New values of the integrals given in Eq. (1) were extracted, as well as contributions from each term to the binding energies Millener12 . However, gamma transition energies cannot provide information on ground state binding energies.
Electroproduction using the reaction with intense beams at the Jefferson Lab accelerator provides a unique opportunity to study high precision hypernuclear spectroscopy. An energy resolution of keV (FWHM) can be achieved using a combination of (1) the small emittance of the electron beam, (2) the excellent momentum resolution using precision spectrometers for the scattered electron and produced kaon, (3) the precision measurement of the scattering angles, and (4) the thin target foils minimizing target straggling and radiative corrections. On the other hand, the experimental design must accommodate high luminosity, potential backgrounds, and precise calibration of the spectrometers.
Electroproduction brings in additional new features to the overall investigation of hypernuclei. The reaction produces a from a proton in the nucleus creating a proton hole in the core to which the couples. This can produce either mirror hypernuclei to those produced by the hadronic reactions and , or states with different isospin. Thus, electroproduction produces neutron-rich hypernuclei that are suitable candidates to investigate coupling and the effective three-body force. Furthermore, electroproduction involves large spin-flip transition amplitudes from the initial nuclear to the final hypernuclear states. Still, the non-spin-flip amplitude remains non-negligible. The transition density for transitions between nodeless orbits leads to a peak in the form factor at . As for reactions, the minimum momentum transfer is large ( MeV/c). This is beyond the peak of the form factor and means that all cross sections will fall with inreasing (reaction angle) and that high values of are favored. Thus, deeply-bound hypernuclear states (i.e. the ground state and states with the in low orbits) with both natural and unnatural parities may simultaneously appear, and provide a rich and new spectroscopy complementary to that from hadronic reactions. The high resolution allows extension of these studies to -shell states that could not be confirmed by low-resolution experiments or spectroscopy.
To compensate for the small electroproduction cross sections, high luminosity and forward spectrometer angles for both the scattered electrons and the reaction kaons are required. This creates a challenge to design an experiment with two large spectrometers essentially placed at zero degrees. Over the last decade, two independent hypernuclear programs in JLab Hall A E94107 and Hall C JLabexpts have been developed and undertaken with encouraging results Miyoshi03 ; Iodice07 ; Cusanno09 ; Nakamura13 . The second and third phase Hall C experiments, E01-011 and E05-115, resulted in two new data sets, producing high resolution in the spectra of , and and , , and . This paper presents a combined analysis of the spectroscopy from the the Hall C program. The analysis of from the second phase experiment E01-011 has been previously published and papers describing the spectra from other hypernuclei are forthcoming.
II Design of the HKS Experiments and Their Apparatus
The JLab Hall C HKS experiments, E01-011 and E05-115 are two, consecutive hypernuclear spectroscopy experiments (see schematic illustration in Fig. 1) which follow the first pioneering experiment (HNSS E89-009). Upgrades and a new configuration were made to improve energy resolution, yield, and the use of a higher incident energy beam increased the virtual photon flux. Experiment E01-011 used a new, high resolution kaon spectrometer (HKS) having a short orbit and a large solid angle acceptance. An off scattering-plane geometry, the “tilt method”, was applied to the electron spectrometer, the Enge Split-Pole spectrometer (Enge) Enge79 . In E05-115, the previously used “C” type splitting magnet (SPL) and Enge were replaced by a new “H” type splitting magnet and a new high resolution electron spectrometer (HES) with a larger solid angle acceptance. The same “tilt method” which proved successful in E01-011 was also applied to the HES. The goal of this series of upgrades was to improve precision and yield, in order to widen the spectroscopic studies beyond the -shell.
II.1 General Technique - A Common Splitter Magnet
A charge-separation splitting magnet (SPL), common to both spectrometers, is used by all the Hall C hypernuclear experiments in order to separate positive reaction kaons from the electrons. The nuclear target under investigation is located at front effective field boundary (EFB) of the SPL which bends the oppositely charged particles ( and ) away from the beam in the opposite directions. This technique allows the spectrometers to be placed at forward angles close to the target. As a result, the reaction particles are measured at very forward angles, with minimal path length for the short-lived kaons, and with increased solid angle acceptance. All these are crucial factors which increase the yield. However, a common SPL configuration also creates unavoidable challenges which are discussed in later sections.


The primary electron beam passes through the SPL and is deflected. At the high beam currents used in the two HKS experiments, the beam must be redirected to a high power beam dump in order to avoid serious radiation problems. In E01-011, additional dipole magnets were installed downstream of the SPL to redirect the beam to the dump, while for E05-115 a pre-chicaned beam technique was applied to provide an incident beam angle which canceled the bending angle of the SPL. Although the pre-chicane method requires careful tuning of the primary beam, it is significantly easier than that of tuning the beam transportation after the SPL and provides cleaner beam transport to the dump.
II.2 Tilt Method
The extremely high electron singles rate in the electron spectrometer from Bremsstrahlung and Møller scattering presents another challenge at forward angles. These background electrons are bent by the common SPL toward the electron spectrometer. This problem limited the luminosity in the first experiment E89-009 (HNSS) to on a thick C target, suppressing hypernuclear production while creating high accidental background.
The “tilt method” was developed for the latter two (HKS) experiments. The electron spectrometer (Enge for E01-011 and HES for E05-115) was tilted up, pivoting about a point approximately 43 cm upstream of the virtual target point, by an angle of off the plane as defined by the beam and the HKS momentum dispersion plane. This is equivalent to a rotation plus a shift of the spectrometer. In such a configuration the scattered electrons at near zero degrees are blocked by the spectrometer yokes so that they lie outside the spectrometer acceptance. The rates for Bremsstrahlung and Møller scattering electrons decrease more rapidly with increases in scattering angle than does the virtual photon flux, especially when higher beam energies are used. The tilt angle corresponds to a lower cut-off in the electron scattering angle of , a choice based on an optimization between the yield and the accidental background which could be accommodated by the experiments. Using this method, both E01-011 and E05-115 were able to increase the target thickness to and the beam current up to while maintaining the electron singles rate at a level of approximately 3 MHz. This background was almost 100 times smaller than in the first experiment, E89-009, improving the yield by more than an order of magnitude.
II.3 Kinematics and Spectrometers
| ITEMS | E01-011 | E05-115 |
|---|---|---|
| Beam energy | 1.851 GeV | 2.344 GeV |
| Beam energy precision | ||
| Electron spectrometer | Enge | HES |
| Central | 0.351 GeV | 0.844 GeV |
| precision | ||
| minimum | ||
| 5.6 msr | 7.0 msr | |
| Average central | 1.5 GeV | 1.5 GeV |
| Average | ||
| Average | ||
| Kaon spectrometer | HKS | HKS |
| Central momentum | ||
| Precision | ||
| range | ||
| range | ||
| Average | ||
| 16 msr | 8.5 msr | |
| survival rate |
The basic parameters of the two experiments are listed in Table 1. Although they used different beam energies, the virtual photon energy and its range were the same, so that the kaon spectrometer, HKS, did not need modification. In the sequence of upgrades, the substitution of the HKS for the original kaon spectrometer provided high kaon momentum resolution, while the further substitution of a new SPL and HES resulted in additional increase of yields. Although this latter upgrade introduced a yield reduction from the HKS side due to the new SPL with a longer path, the larger solid angle acceptance from HES and more importantly, the higher beam energy which increased the total integrated virtual photon flux increased the yield by another factor of 4 for E05-115.
The beam energy was controlled by a high-frequency, fast-feedback, energy-lock developed at JLab. Furthermore, a Synchrotron Light Interferometer (SLI) was used in the Hall C beam line to measure and monitor beam stability and its variation in energy. A more stringent constraint on beam energy fluctuations was needed for E05-115 because of the higher beam energy. The chosen virtual photon energy of corresponds to approximately the maximum in the elementary photo-production cross section. This photon energy also optimizes the conditions for the HKS design with requirements for good kaon survival, large solid angle acceptance and high resolution, and ease in kaon particle identification (PID). Note that at forward angles, the reaction is sufficiently small so that virtual photons are almost real, and thus the cross section can be assumed to be approximately equal to the differential cross section after integration over a virtual photon flux factor.
II.4 Detectors and Particle Identification
II.4.1 Detector System for the Electron Spectrometer
The detector system for the electron arm (both Enge for E01-011 and HES for E05-115) has tracking wire chambers to measure the focal plane parameters and two segmented scintillation detector planes separated by 0.5 meters. The focal plane parameters, together with the point target position, are used to reconstruct the momentum and the scattering angle with optical reconstruction matrices obtained using the characteristics of the spectrometer. The segmentation and the plane separation of the two scintillation detectors are designed to efficiently handle a high single-particle rate and to reject background particles originating from outside the spectrometer acceptance. These two planes were also used to reconstruct the focal plane time reference which was then placed in coincidence with the in the HKS. Since the rate of the scattered electrons is times larger than the sum of all the other negatively charged particles, particle identification (PID) in the electron spectrometer is not required.
II.4.2 Detector System for the HKS
The “tilt method” enabled a dramatic increase in the luminosity with respect to the first experiment. The luminosity increase also significantly increased the HKS singles rate. Therefore, the HKS upgrades also included the installation of a sophisticated detector system. This new system included the following:
-
1.
Two sets of tracking wire chambers separated by 1.0 meters to provide precision measurement of the focal plane parameters;
-
2.
Three layers of segmented scintillation detectors (two segmented in the momentum dispersion plane and one normal to the dispersion plane) separated by 1.75 meters. These provided a time-of-flight (TOF) measurement as well as providing a focal plane time reference when placed in coincidence with the detected electrons in the electron spectrometer;
-
3.
Three layers of segmented Aerogel Čerenkov (AČ) detectors with n = 1.05 located between the second and third TOF planes which were used for and rejection;
-
4.
Layers of segmented water Čerenkov (WČ) detectors with n = 1.33 installed behind the last TOF plane for proton rejection.
”Bucking coils” Gogami13 were used on each of the photomultipliers in the Čerenkov detectors. These coils made an active cancellation of the axial magnetic fringe field from the large HKS dipole and successfully restored the efficiency of these Čerenkov detectors.
II.4.3 Kaon Identification
Several layers of Čerenkov detectors, as described above, were arranged to provide a good background rejection power. These detectors, which were included in the trigger, maximized the kaon detection rate while limiting the coincidence trigger rate such that the computer deadtime was kept below 10%. A Monte Carlo simulation was used to design a sophisticated online trigger scheme in an FPGA micro-processor Okayasuthesis which avoided accidental vetoes of from the high singles rate in the Aerogel Čerenkov detectors and minimized background incident from outside of the spectrometer acceptance.
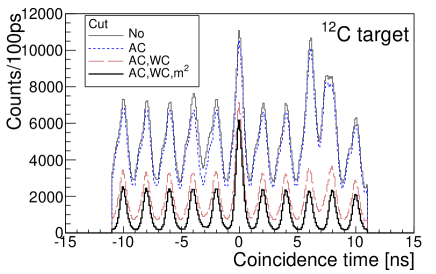
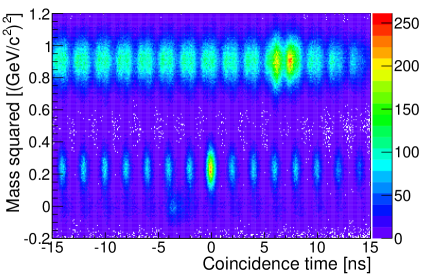
In the offline analysis, kaons were cleanly separated from the background particles (, , and ) by a combination of signals from the Čerenkov detectors and the particle’s mass squared () derived from measured velocity/TOF and momentum. Although the experimental conditions for the two HKS experiments were not identical (due to the various upgrades and technical changes), the basic technique and quality of the particle identification analyses were similar Matsumurathesis ; Rodriguezthesis ; Sevathesis ; Baturinthesis ; Kawamathesis . Figures 2 and 3 demonstrate an example of the kaon identification as applied in the analysis of the data collected from the target in the E05-115 experiment. Figure 2 shows the coincidence time spectrum for the events detected by the electron and kaon spectrometers. The full spectrometer path length correction was made in each spectrometer so that the time resolution was optimized, and the 2ns time interval of the CEBAF beam pulse separation can be clearly seen. The distribution without “Cut” represents the minimum particle identification made at the trigger level. The real coincidental pions and positrons are located near -3 ns while the real protons are at ns in the plot. This can also be seen in the 2-dimensional correlation between and coincidence time. After application of the AČ and WČ cuts and the 2-D gate on , kaons in real or accidental coincidence with detected scattered electrons were cleanly separated from background.
II.4.4 Accidental Background and Mixed Events Analysis
Due to the clean identification of kaons by the HKS detector system, the background in the reconstructed mass spectrum comes only from accidental coincidences. The accidental coincidence level is not negligible because the electron singles rate is still high at the high luminosity which maximizes the production rate, and this background can only be removed by subtraction. However if the background shape is precisely measured, its contribution to the statistical error is small.
In order to precisely obtain the background shape and its height in the mass spectrum, a mixed event analysis was performed. Electron and kaon events from different accidental peaks (seen in Figs. 2 and 3) were randomly picked to create a mass spectrum using accidental timing which substantially increases its statistical accuracy. This spectrum was then scaled and used to subtract the accidental background.
III Kinematics and Optics Calibration
The development of the spectrometer calibration required the optimization of momentum and scattering angle reconstruction matrices. This was a complicated issue as the kinematics coupled the scattering angle and momentum measurement in each spectrometer. As the beam passed through the common SPL it was impossible to use an elastically scattered, monochromatic beam to separately obtain a momentum for each scattered particle. In addition, both the elastically scattered and primary beam electrons passed through the focal plane of the spectrometers when at forward angles.
Although a Sieve Slit (SS) collimator is a device commonly used with magnetic spectrometers to extract the momentum and angle transfer matrices of a spectrometer, it is difficult to use in the geometry of these experiments. An SS collimator is a thick plate with arrays of well positioned small holes which is mounted between a spectrometer and an experimental target. When a point beam ( diameter) scatters from a target, the center of each small hole defines a uniquely known position and angular coordinate. Events from each hole form a pattern on the focal plane such that reconstruction matrices can be mathematically fitted. However the SS placed in front of each spectrometer in the HKS geometry was behind the common SPL which introduced momentum and angle correlations. Thus events from a given hole cannot select a small kinematic volume with a unique angle and momentum. Thus special techniques are required which use events from the reaction on targets with well-known masses. Although such calibrations are possible, they are difficult and time consuming.
III.1 Magnetic Field Interference and Corrections
In order to overcome the difficulties mentioned above, extensive GEANT4 Monte Carlo simulations were run with both measured 3-D magnetic field maps and a fields maps from a finite element calculation by Opera-3D (TOSCA). These simulations were used to study the momentum, angular resolution, and acceptance of the spectrometers, and used to evaluate calibration methods, procedures and uncertainties using the simulated reaction with well-known masses. They produced correlations between the focal plane parameters from the simulated SS events generating initial backward reconstruction matrices. Finally, the matrices obtained from simulation were optimized using events selected from real data.
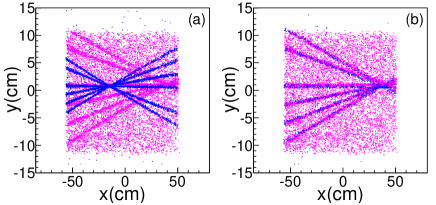
A problem appeared when comparing focal plane parameter correlations (such as vs ) between the simulated and the real SS events from the E05-115 experiment (2009). Reasonable agreement was seen only for the events coming from the column furthermost from the beam centroid (i.e. away from HES). The disagreement increased as the SS column approached the beam centroid, while the symmetry remained in the non-dispersive plane (-). For example, Fig. 4 (a) shows a comparison for the events selected from the 7th column of the SS holes for the HKS spectrometer. This column of SS was on the side toward to HES where a line of events came from a specific hole in that column. Similar behavior was also found for the HES spectrometer, i.e. the disagreement started and enlarged as the selected column came closer to the HKS spectrometer. Due to the “tilt” of the HES, the symmetry about the central angle was not expected and disagreement was found in both (- and -) planes.
The disagreement indicated that the reconstruction matrices obtained from simulations were not sufficiently close to the correct ones to use as initial values in a perturbative development of the real optics. Figure 5 (a) and (c) show the comparisons of the reconstructed real SS events at the SS plates to the actual geometry of the SS plates for HES and HKS, respectively. The disagreements and asymmetry are obvious and significant. The particle density variation in the case of the HES was strongly dependent on the angle of the scattered electrons. This problem was studied and found to be a consequence of field interference between the SPL magnet and the front magnetic elements of the spectrometers. Due to the asymmetry in the relative geometry between SPL and spectrometers, a TOSCA calculation could not combine independent measurements of the spectrometer fields.
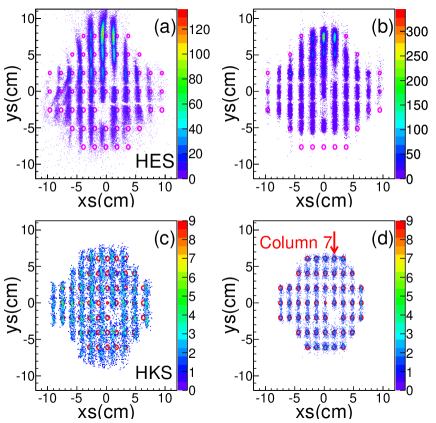
The problem was resolved by the addition of field corrections to the 3-D field map used in the GEANT4 simulation. The three dimensional field corrections are assumed to have coordinate dependencies described by polynomial functions. These were applied to the field for each appropriate element and the coefficients of the polynomials were then optimized to minimize the variation between the simulated events from each SS hole in comparison to the real events. Fig. 4 (b) demonstrates the results when comparing the simulated and real SS events from the column of SS holes for HKS. The systematic tuning of the polynomials resulted in uniform agreement over the full kinematic space for both HES and HKS. This provided optical transfer matrices sufficiently close to the correct values to provide initial starting values for further optimization as demonstrated by Fig. 5 (b) for HES and (d) for HKS.
As the experimental configuration was similar, the same problem was confirmed to exist in the E01-011 (2005) experiment. Therefor the E01-011 data were reanalyzed with the same technique. An independent analysis of the E01-011 data reached the same level of agreement.
III.2 Kinematics Calibration
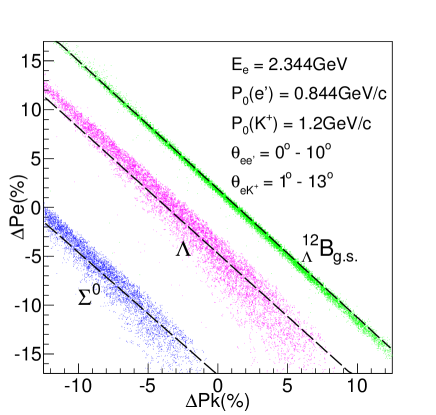
The large momentum acceptances of both the electron (Enge and HES) and kaon (HKS) spectrometers can capture, in a single setting, events from free , and free production from protons in a target, and hypernuclear events from different nuclear targets. Figure 6 illustrates the mass correlation between the momenta of electrons and kaons from the reaction for production of and from hydrogen in a target, and the ground state of from a target. The correlations are the same for both E01-011 and E05-115. The dispersion of the events from the locus line is due the angular acceptance of the spectrometers. The dashed lines show the events with central angles. Since the masses of free and are light, they have strong angular dependencies. In contrast, this dispersion becomes much smaller for heavy systems, such as hypernuclei, as seen for the distribution in Fig. 6 from E05-115.
| Width (FWHM) | Width (FWHM) | ||||
|---|---|---|---|---|---|
| E05-115 | |||||
| E01-011 |
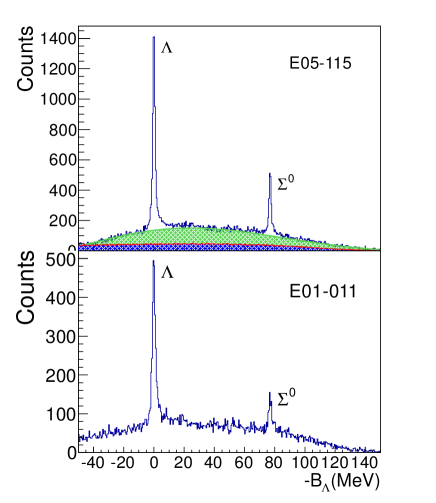
Simultaneous production of free , and hypernuclei is a major advantage of the HKS experiments. The masses of and are sufficiently well known and their mass separation () is large. This allows precise kinematic calibration of the spectra and an absolute mass scale calibration. Figure 7 shows the final mass spectroscopy of and in terms of binding energy from both the E01-011 and E05-115 experiments. The background includes accidentals and the quasi-free production from in . The spectra are analyzed using kinematics. The accidental background shape can be determined precisely by a mixed event analysis and the quasi-free background shape is experimentally obtained from carbon target data which is analyzed with kinematics. Therefore, the background shape is almost completely understood for the data.
Table 2 lists the reconstructed masses of and . The kinematic calibration was undertaken in concert with other calibrations and optical optimizations which will be discussed in the later sections. The uncertainty in the calibrated mass scale contributes to the systematic uncertainty in the absolute hypernuclear mass scale. The total systematic uncertainty of and masses includes the statistical uncertainty as listed in Table 2 and systematic uncertainties due to the radiative tails and background/peak fitting functions. The radiative tail was studied with the Hall C SIMC code SIMCref and a correction was applied to minimize the mass offset residuals. The contribution from this calibration to the overall systematic uncertainty in the absolute binding energy of hypernuclei is found to be and for E05-115 and E01-011, respectively. However, this uncertainty is not present in the excitation energy spectrum with respect to the ground state (or in the energy separation between states). The mass separation uncertainty is found to be less than over the mass range between and . The excitation energy uncertainty is less than for both experiments in an approximate 10 MeV range in excitation energy above the ground state.
III.3 Optical Matrix Optimization
For a point beam on target with stabilized position, the target coordinate set is . and are the angles in and off the momentum dispersion planes with respect to the spectrometer optical Z axis, respectively and are related to the scattering angle of the detected particle. L=0 is the reference point of the trajectory path length and is the percentage momentum offset for the detected particle relative to the central momentum setpoint for the spectrometer. Correspondingly, at focal plane (FP) of the spectrometer, the particle’s coordinate set is , in which , , and are measured quantities. Mathematically, the FP coordinates are the matrix-vector product of the spectrometer optical transportation matrix and the target coordinate vector. The field interference correction work done by the GEANT simulations described in Section III.1 serves to find a transport matrix that is close to the real optics.
Each of the four unknowns, , , and is then obtained separately from the product of a reconstruction optical matrix and the FP coordinate vector with the others assumed known. The initial matrix is sufficient for the path length reconstruction which provided the full path length correction to the coincidence time between and . As its contribution to the precision of the momentum and angle reconstruction is negligible, the path length need not be further optimized. For each spectrometer, there are three optical reconstruction matrices, for , and , that must be optimized as they are crucial to achieving the best resolution. The optimization of these matrices is another challenge to these experiments. As mentioned previously, the common splitter prevents single spectrometer calibration using two-body scattering. Thus, the matrices can only be optimized by using well defined physical events from an reaction. The difficulty is that the six matrices (three for each spectrometer) are coupled through the reaction kinematics so that matrices from different spectrometers affect each other. On the other hand, small errors can compensate each other so that the derived invariant mass and scattering angles are somewhat insensitive to these errors. To resolve the complications of this coupling special techniques and optimization procedures were developed, aided by extensive simulation studies. There are matrix parameters in the six matrices which include terms from order ( to ). Due to the kinematic coupling and compensation effect between the two spectrometers, the six matrices are separated into two groups: the momentum reconstruction matrices (one matrix from each spectrometer) and the angle reconstruction matrices (two matrices from each spectrometer). Each group is optimized separately and the improvement of each group allows the other group to be further improved.
III.3.1 Optimization by the and Productions
Both and produced by the reaction were used to optimize the momentum and angular reconstruction matrices using a standard least- minimization method. For each event selected from the peak of (or ), the difference between its reconstructed mass and the corresponding reference mass (the PDG value of or as given in the caption of Table 2) was used in the computation of . was then minimized by varying the matrix parameters. Events were selected from the and peaks within a width of about the mean of the peak values. A width limit was applied because background events were unavoidably included and widening the gate decreased the signal to background ratio reducing the sensitivity of the fit. The minimization was iterated by alternately optimizing the momentum and angle matrices.
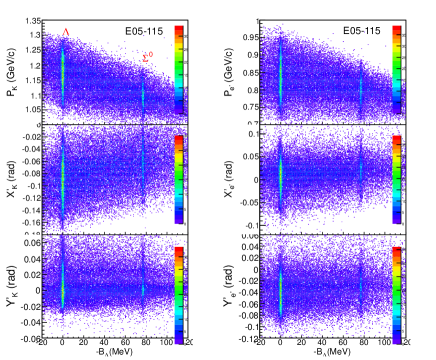
Figure 8 shows the correlations between the reconstructed invariant masses of and in terms of the binding energy and the reconstructed parameters (absolute momentum, , in-plane and off-plane angles at target, and ) from which the invariant masses were calculated. The six correlations correspond to the six reconstruction matrices (three from each spectrometer). This figure verifies the quality of the optimized matrices, showing that the calculated invariant mass is independent of the reconstructed kinematics parameters (, and at target). The local mass spread is minimized to (). Thus the quality and precision of the optimized optics are uniform in the complete kinematic space, so that the energy resolution as well as the excitation energy scale is essentially uniform.
III.3.2 Beam Position Correction
To prolong the lifetime of the target which can be damaged by an intense primary electron beam, a fast raster moved the beam over the target at 20 kHz. Thus the point electron beam () was distributed over an area for E01-011 and for E05-115. The effect on the spectrum is the same for both experiments, yielding both momentum and angles offsets that depend on the raster size and spectrometer optics. GEANT4 studies with a realistic field map show the effect can be eliminated by a correction to the focal plane parameters (i.e. the measured , , and at the FP), allowing reconstruction matrices for point target to be used. The correction was realized event by event by using a set of matrices which calculated the correction from the defined raster phase angle and amplitude in both the and directions. The least- method was used to optimize the phase angle and amplitude as they were not precisely measured. Similarly, the correction matrices were also optimized using the same method as for the optimization of the reconstruction matrices. This procedure was repeated at different stages in the progress of the optimization of the momentum and angle matrices. Removing this contribution of rastered beam position ensures that the optimized optical reconstruction matrices using the and events are valid for a point target, as the targets used in producing hypernuclei were used with unrastered beam.
III.3.3 Target Straggling and Kinematics Alignment
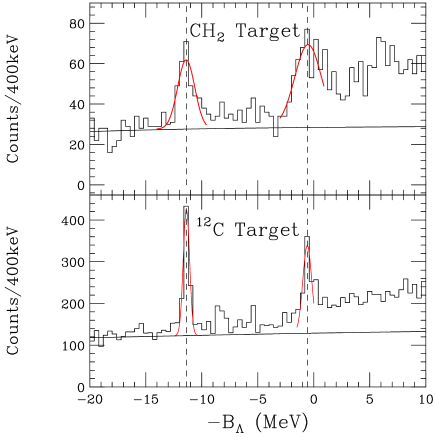
Since the and events from a target were used for both kinematic calibration and optimization of the reconstruction matrices, the scattering kinematics for each event must be known accurately. One issue which arises is that the thickness of the target is not accurately known. Incorrect mean target straggling corrections can result in an incorrect optimization of the reconstruction matrices and thus affect the energy resolution for mass spectroscopy of hypernuclei. Therefore, a target with a well known foil thickness was used to obtain an effective thickness. Target straggling and energy corrections as function of the thickness were studied with the Hall C SIMC code and a GEANT4 simulation. Straggling corrections were applied to the target data in order to obtain the spectrum. Similarly, events from the target were also analyzed with kinematics to generate a spectrum formed from events from the component of the target. Although statistics were lower, the -shell ground and -shell substitutional state peaks are well recognized. Corrections corresponding to various target thicknesses were scanned to find the best simultaneous alignment of both the ground and -shell states between the and spectra. Uncertainty in the alignment is dominated by the statistical uncertainties of the two peaks. This contributes to the systematic uncertainty in the determination of the binding energy with the defined kinematics and optics. Figure 9 shows the alignment of the two spectra from E05-115 data. The - and -shell peaks are aligned within 10 keV, and the statistical uncertainties of the - and -shell peaks from the target are and keV, respectively. Due to low statistics, the uncertainties for the target are and . To reduce the overall alignment uncertainty, two independent single peak alignments were done by the - and -shell peaks separately and an average was done taking into account the statistical uncertainties of each peak. The overall alignment uncertainty is then found to be and for E05-115 and E01-011, respectively.
This correction for the target thickness enables the use of the and peak positions for the kinematics calibration. It ensures that the optimization of the reconstruction matrices is done in one unified kinematics so that the matrices are applicable to data from all production targets used in the experiment. All other production targets were then separately optimized for their own target straggling corrections using this unified kinematics. The residual relative alignment error affects only the absolute binding energy but does not affect the excitation energy which is measured relative to ground state.
The above procedure was iterated several time, alternating with other optimization procedures until the derived thickness was stable. Iteration was needed because of the kinematic coupling in the events produced by the reaction. Improvement from each aspect of optimization allowed the other parts to be further improved.
III.3.4 Optimization Involving Events from
Events selected from the peaks of and cannot be used alone to fully optimize the momentum and angular reconstruction matrices. This is because the reactions on protons which produce these recoil particles result in a large recoil kinetic energies due to the light masses involved. Monte Carlo studies demonstrated that these spectra are almost equally sensitive to the uncertainties in recoil momentum and the angular matrices. On the other hand, because of their heavier masses, recoil energies in the production of hypernuclei are small, and thus the widths of the hypernuclear states depends almost entirely on the uncertainty in the momentum matrix. For example, the width of states has approximately 40 times smaller angular dependence than does the peak. To mitigate this problem, events from peaks of well-defined heavy mass targets must be simultaneously used together with the events producing and recoils. Since the hypernuclear peak widths essentially depend only on the uncertainty in the momentum matrices, such events can be used to insert a known functional dependence of the momentum vs. angle correlation, and optimize the momentum matrix with less influence from uncertainties in the angle matrices. Once an improved momentum matrix is obtained, it is then used to optimize the angular reconstruction matrices with only and events. Inclusion of and data in the momentum reconstruction matrix optimization with a small weight in the overall definition is necessary to ensure uniform energy resolution over the large kinematic space. This procedure is iterated to convergence and is combined with other corrections and optimizations discussed previously to form a complete optimization cycle.
The reaction has a large cross section, has been previously studied in several electroproduction experiments, and the ground state has been observed in emulsion data. In addition, an extensive knowledge of the states of its isospin mirror partner, , exists. The ground state and the strongly excited -shell peak are suitable calibration states for momentum matrix optimization and sufficient statistics can be reached within a relatively short beam time. Therefore, events from these states were selected for this optimization procedure. The momentum reconstruction matrix is required to fit the mean kinematics as defined by the mass of and using the PDG values (see in caption of Table 2). The masses of the two experimentally measured states were then allowed to vary, and a statistical mean width for each peak was used to define , together with that from and as mentioned above. A minimization of this width, keeping the energy scale fixed (locked by the and masses), was obtained by minimization of the overall . It was found that the mean mass of these two states became stable within a few keV once a width of FWHM was reached in the progression of optimization iteration.
III.3.5 Blind Simulation Analysis and Systematic Error from Matrix Optimization
A blind analysis to a simulated data set was carried out to evaluate the systematic error generated by the matrix optimization processes. This method was also used to study the contribution from each individual source, to the accuracy of the focal plane parameters, the target thickness and energy straggling, the beam position raster size, and the angle and momentum uncertainties from the optimized reconstruction matrices. Thus a Monte Carlo simulation was used to generate calibration data for photoproduction on protons producing and , and hypernuclear states from a target. The quantities of simulated data corresponded to experimental quantities. The masses of the hidden hypernuclear states were then extracted using the same optimization procedures as in the experimental data. The results of this study allowed an estimate of the error in how well a mass could be determined by the analysis techniques described above. The study concluded that the optics matrix optimization contributes uniformly a systematic uncertainty to the determined mass for all studied hypernuclei. Energy resolution (i.e. the peak width determination) for each production target was also found to be uniform (less than a few keV fluctuations) within the applicable excitation energy range. The resolution varies only between different targets due to target thickness and mass differences. Both kinematic calibrations and the optical optimizations contribute a systematic uncertainty which results a small constant error in determination of binding energy of all states but not the relative energies between states.
IV Spectroscopy of B and Energy Resolution
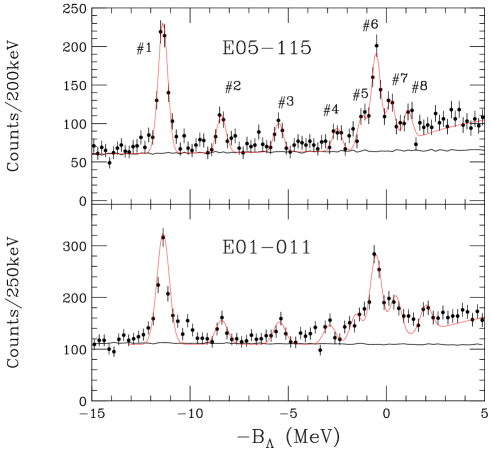
The spectra from the JLab Hall C E05-115 and E01-011 experiments are shown in Fig. 10. The accidental background shape was obtained from the analysis using randomly mixed events from eight accidental coincidence peaks in order to reduce the statistical fluctuation. The two experiments have different kinematics acceptances, mainly due to the two different electron spectrometers (Enge and HES). The quasi-free distribution is fit by a 3rd order polynomial. Note that the first break up () is at MeV, which is just above the threshold. All possible states below this threshold have a decay width which is much smaller than the experimental resolution. Therefore, all structures are expected to have the same width with the exception of neighboring doublets which lie within the experimental energy resolution.
Eight peaks in each spectrum can be recognized as having a statistical significance larger than . These are fit by a Gaussian function. With the exception of the ground state peak which is obviously broader, the least (or the best confidence level (C.L. )) is obtained by assuming that all of the other seven peaks have the same width. The widths of the peaks in the E05-115 experiment are , while those in the E01-011 are . Therefore, the energy resolution is confirmed to be keV and keV FWHM for E05-115 and E01-011, respectively.
Using a single Gaussian fit, the ground state peak is found located at with a width of in the E05-115 spectrum and at with a width of in the E01-011 spectrum. Though a clear separation of the ground-state doublets is difficult without any constraints, a double-Gaussian fit study was carried out with a fixed energy resolution as described above and a peak amplitude constraint based on a theoretical prediction. The cross-section ratio (/) for producing the doublet states has been estimated to be at small angles Iodice07 ; Motoba10 . The estimated ratio depends on the interaction models used for the calculation, however, the population of the state is always expected to be 3-4 times larger than that of the state in the HKS kinematics. Therefore, we constrained our double-Gaussian fit with a peak amplitude ratio of 3.5 with a single free parameter for the peak separation. The fit gave the peak separations of the doublet as for the E05-115 spectrum and for the E01-011 spectrum. The statistical uncertainty of the positions of these peaks is and for the E05-115 and E01-011 spectra respectively. These are consistent and their weighted average gives a separation of .
Table 3 lists the positions of the eight fitted peaks in terms of binding energy . The average values are also given. Although the E01-011 spectrum has lower resolution and higher statistical uncertainty in comparison to that from E05-115, the results are consistent when accounting for the statistical and systematic uncertainties.
The photo-production cross sections are obtained Nakamura13 using the virtual photon flux ()
| (2) |
where the virtual photon flux is integrated over the momentum and angular acceptances of the electron spectrometer (HES for E05-115 and Enge for E01-011). The cross sections of the corresponding peaks from the two independently obtained spectra are listed separately without average. Notice that because the E05-115 experiment had a larger mean angle (Table 1), its measured cross sections are expected to be lower. The systematic uncertainty of the experimentally obtained cross sections is about .
| Peak | (MeV) | (MeV) | (MeV) | Cross Section (nb/sr) | Cross Section (nb/sr) |
|---|---|---|---|---|---|
| (E05-115) | (E01-011) | Average | (E05-115) | (E01-011) | |
| #1-1 | |||||
| #1-2 | |||||
| #2 | |||||
| #3 | |||||
| #4 | |||||
| #5 | |||||
| #6 | |||||
| #7 | |||||
| #8 |
-
Separation of the #1-1 and #1-2 states was performed with a fitting constraint on the peak area ratio of 1:3.5.
IV.1 States with a in the -shell coupled to the low-lying core states
The peaks from #1 (containing 1-1 and 1-2) to #4 are all considered to have a in an -shell which is coupled to the core. Peak #4 will be discussed later and peaks #1 to #3 are considered to have a negative parity core structure. Peak #1-1 and #1-2 are the ground state doublet states and with a coupled to the ground state. Peak #2 is considered to be the lower member of the second doublet ( and ) with the core, while peak #3 should be the lower member of the fourth doublet ( and ) with the second core. The and , as well as the third doublet ( and ), are all predicted to have small cross sections ( few nb/sr) and thus are difficult to observe without sufficient statistics and a better signal/background ratio. Using the averaged values from the two experiments, the assumed level structures are illustrated in Fig. 11(b) in terms of the excitation energy spectrum with respect to the () ground state. The systematic uncertainty for these extracted excitation energies is MeV.
This observed excitation level spectrum of with a in -shell can be compared to that of the mirror hypernucleus (shown in Fig. 11(a)) which was constructed by four precisely measured transitions Hosomi13 . Other than small excitation energy differences, and have the same level structure. To a first approximation, the excitation energies of states in the excited doublets of can be obtained by adding the difference between the excitation energies of the core states of and .
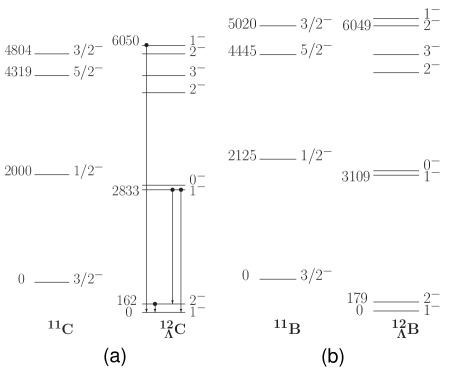
The ground state doublet separation for was measured to be 0.162 MeV, while the separation of the same doublet for measured by the HKS experiments is 0.179 MeV. If simply taking into account the 2.125 - 2.000 = 0.125 MeV energy difference between the first excited states of and , the state for in the second doublet can be predicted to have a 2.958 MeV excitation which is close to the measured value of 3.109 MeV. When comparing the fourth doublet, the transition measured by the KEK experiment was assigned to lie between the states of and . However, in the reaction the lower member of the doublet, the state, is favored. Thus the two experiments should have measured different states in the same doublet. By simply adding the energy difference of MeV, the upper member (i.e. the state) is suggested to have excitation energy of 6.266 MeV. Thus, the simple estimate gives the separation of the two states in the fourth doublet on the order of MeV. The recent theoretical calculations are 0.107 MeV as presented in Ref. Iodice07 and 0.122 MeV from a G-matrix calculation Motoba10 .
IV.2 States from in -shell
Above the four states (including the and ground state doublet) there are five peaks (#4 to #8) with the resolutions (540 keV and 710 keV FWHM). Their averaged excitation energies are 8.86, 10.24, 10.99, 11.76, and 12.50 MeV with a systematic uncertainty of .
Note that the width of the #4 peak in the published JLab Hall A spectrum (see Table 1 in Ref. Iodice07 ) was fit to be FWHM, wider than the reported resolution of 670 keV FWHM. This excitation was reported as , and there was still unexplained additional strength. This result appears to be the average () of peak #4 and #5 from the HKS result. In the HKS spectrum, peak #5 peak would then be the first ( and ) pair of states with a in -shell coupled to the ground state core. The energy separation of this doublet (peak #5) is predicted to be very small ( keV).
Peak #6 is the dominant peak among the states and is consistent with the observation made by the JLab Hall A experiment. This peak can be interpreted as the second ( and ) pair of states (see theory prediction in Table 4). Peak #8 is located near the first breakup threshold and could be the third ( and ) pair of states. The width uncertainty for the fitting is about , which means separation of these two doublet states is small, possibly . Peak #7 appears to be an “extra” state and is not predicted by based calculations using a -shell core. The peak also exists in the JLab Hall A spectrum behind the dominant -shell peak. However, in the Hall A analysis the strength was simply fit by one peak with a width of 1.58 MeV, more than twice the reported resolution (670 keV FWHM). Thus, the peaks #5, #6 and #8 are considered to be three pairs of states. The possible state configurations and excitation energies are listed in Table 4 and compared to the theoretical calculation used in Ref. Iodice07 . The configuration with infers a strong mixing of and . The theoretical calculation for the states using the G-matrix approach with a “realistic” interaction Motoba10 predicts a different excitation spectroscopy for the same configuration. A detailed comparison to the present results for the excitation energies and relative crosss sections may help to improve the interaction model.
| Peak | Structure | Measured (MeV) | Calculated Iodice07 (MeV) | |
|---|---|---|---|---|
| #5 | 10.29 | |||
| 10.34 | ||||
| #6 | 10.93 | |||
| 11.01 | ||||
| #8 | 12.80 | |||
| 12.91 |
IV.3 -shell core states with a in the -shell
The extra peaks #4 () and #7 () may not actually be so surprising. Comparisons of early and recent spectroscopic investigations on Hashimoto06 ; Hotchi01 ; Agnello05 and Iodice07 with shell-model calculations commonly result in leftover strength around the peaks. In the HKS experiments, these are fit using the same width as the other peaks. As discussed also in Ref. Iodice07 , these two peaks may be due to states with a configuration of coupled to the and -shell core states. Their excitation energies would happen to be near the strong states and they would get their strength from mixing with these states. Theoretical investigations using a full basis are indeed needed.
V Conclusions
The unique CEBAF beam has enabled high precision spectroscopic investigation of hypernuclei which are a laboratory for studying interactions. The independent Hall C HKS experiments, E05-115 and E01-011, provide consistent results. They obtained excellent energy resolution which is essential for obtaining the detailed level structures presented here. This paper demonstrates how to calibrate a system of two spectrometers in which the angle and momentum reconstruction matrices are coupled by using the calibration data obtained from reaction. In addition, the analysis of the hypernuclear spectra using the confirmed energy resolution ( keV for E05-115 and keV for E01-011) has revealed new states and determined the ground state mass. The experiments have also confirmed the existing level and spin structure of this hypernucleus. The observed states provide a challenge for theoretical calculations. Future technical improvements will seek to reduce the high accidental background.
Acknowledgements.
We acknowledge continuous support and encouragement from the staff of the Jefferson Lab physics and accelerator divisions. The hypernuclear programs at JLab Hall-C are supported by Japan-MEXT Grant in-aid for Scientific Research (16GS0201, 15684005,12002001, 08239102, 09304028, 09554007, 11440070, 15204014), Japan-US collaborative research program, Core-to-core program (21002) and strategic young researcher overseas visits program for accelerating brain circulation (R2201) by JSPS, US-DOE contracts (DE-AC05-84ER40150, DE-AC05-06OR23177, DE-FG02-99ER41065, DE-FG02-97ER41047, DE-AC02-06CH11357, DE-FG02-00ER41110 and DE-AC02-98CH10886) and US-NSF contracts (013815 and 0758095).References
- (1) B. Povh, Prog. Part. Nucl. Phys. 18, 183 (1987).
- (2) R. Chrien and C. Dover, Ann. Rev. Nucl. Part. Sci. 39, 113 (1989).
- (3) H. Bandō, T. Motoba, and J. Žofka, Int. J. Mod. Phys. 21, 4021 (1990).
- (4) R. H. Dalitz and A. Gal, Ann. Phys. 116, 167 (1978).
- (5) D. J. Millener, A. Gal, C. B. Dover, and R. H. Dalitz, Phys. Rev. C 31, 499 (1985).
- (6) Th. A. Rijken, V. G. J. Stoks, and Y. Yamamoto, Phys. Rev. C 59, 21 (1999).
- (7) Th. A. Rijken and Y. Yamamoto, Phys. Rev. C 73, 044008 (2006).
- (8) Th. A. Rijken, M. M. Nagels, and Y. Yamamoto, Nucl. Phys. A 835, 160 (2010).
- (9) Y. Yamamoto and Th. A. Rijken, Few-Body Syst. 54, 57 (2013).
- (10) J. Haidenbauer and Ulf-G. Meissner, Phys. Rev. C 72, 044005 (2005).
- (11) J. Haidenbauer, S. Petschauer, N. Kaiser, U.-G. Meissner, A. Nogga, and W. Weise, Nucl. Phys. A 915, 24 (2013).
- (12) O. Hashimoto, H. Tamura, Prog. Part. Nucl. Phys. 57, 564 (2006).
- (13) D. J. Millener, Nucl. Phys. A 881, 298 (2012).
- (14) F. Garibaldi, S. Frullani, P. Markowitz, and J. LeRose, JLab (E94-107).
- (15) E. Hungerford, R. Chrien, and L. Tang, JLAB (E89-009); O. Hashimoto, S. N. Nakamura, L. Tang, and J. Reinhold, JLab (E01-011); O. Hashimoto, S. N. Nakamura, L. Tang, and J. Reinhold, JLab (E05-115 and E08-002).
- (16) T. Miyoshi et al., Phys. Rev. Lett. 90, 232502 (2003); L. Yuan et al., Phys. Rev. C 73, 044607 (2006).
- (17) M. Iodice, et al., Phys. Rev. Lett. 99, 052501 (2007).
- (18) F. Cusanno, et al., Phys. Rev. Lett. 103, 202501 (2009).
- (19) S. N. Nakamura et al., Phys. Rev. Lett. 110, 012502 (2013).
- (20) H. A. Enge, Nucl. Instr. Methods 162, 161 (1979).
- (21) T. Gogami et al., Nucl. Instr. Methods A 729, 816 (2013).
- (22) Y. Okayasu, Ph.D. thesis, Tohoku University, 2008.
- (23) A. Matsumura, Ph.D. thesis, Tohoku University, 2009.
- (24) V. Rodriguez, Ph.D. thesis, University Of Houston, 2006.
- (25) T. Seva, Ph.D. thesis, University of Zagreb, 2009.
- (26) P. Baturin, Ph.D. thesis, Florida International University, 2010.
- (27) D. Kawama, Ph.D. thesis, Tohoku University, 2012.
- (28) R. Mohring, Ph.D. thesis, University of Maryland, College Park, 1999.
- (29) T. Motoba, P. Bydzovsky, M. Sotona, and K. Itonaga, Prog. Theor. Phys. Suppl. 185, 224 (2010); T. Motoba, M. Sotona and K. Itonaga, Prog. Theor. Phys. Suppl. 117, 123 (1994).
- (30) K. Hosomi et al., Nucl. Phys. A 914, 184 (2013).
- (31) H. Hotchi et al., Phys. Rev. C 64, 044302 (2001).
- (32) M. Agnello et al., Phys. Lett. B 622, 35 (2005).