Nonuniform Expansion of the Youngest Galactic Supernova Remnant G1.9+0.3
Abstract
We report measurements of X-ray expansion of the youngest Galactic supernova remnant, G1.9+0.3 (catalog ), using Chandra observations in 2007, 2009, and 2011. The measured rates strongly deviate from uniform expansion, decreasing radially by about 60% along the X-ray bright SE-NW axis from % yr-1 to % yr-1. This corresponds to undecelerated ages of 120 – 190 yr, confirming the young age of G1.9+0.3 (catalog ), and implying a significant deceleration of the blast wave. The synchrotron-dominated X-ray emission brightens at a rate of % yr-1. We identify bright outer and inner rims with the blast wave and reverse shock, respectively. Sharp density gradients in either ejecta or ambient medium are required to produce the sudden deceleration of the reverse shock or the blast wave implied by the large spread in expansion ages. The blast wave could have been decelerated recently by an encounter with a modest density discontinuity in the ambient medium, such as found at a wind termination shock, requiring strong mass loss in the progenitor. Alternatively, the reverse shock might have encountered an order-of-magnitude density discontinuity within the ejecta, such as found in pulsating delayed-detonation Type Ia models. We demonstrate that the blast wave is much more decelerated than the reverse shock in these models for remnants at ages similar to G1.9+0.3 (catalog ). Similar effects may also be produced by dense shells possibly associated with high-velocity features in Type Ia spectra. Accounting for the asymmetry of G1.9+0.3 (catalog ) will require more realistic 3D Type Ia models.
Subject headings:
ISM: individual objects (G1.9+0.3) — ISM: supernova remnants — X-rays: ISM1. Introduction
G1.9+0.3 (catalog ) is the remnant of the Galaxy’s most recent supernova (Reynolds et al., 2008, Paper I). Expansion between 2007 and 2009 of about 1.6% measured with Chandra (Carlton et al., 2011, Paper V) gives an expansion (undecelerated) age of about 160 yr, but the estimated mean expansion index () of about gives an age yr. The X-ray spectrum is dominantly synchrotron with high absorption (Reynolds et al., 2009, Paper III); lines of Fe, Si, and S are found in small regions, with spectroscopic velocities of about 14,000 km s-1 (Borkowski et al., 2010, Paper IV), consistent with the proper motions for a distance of order 10 kpc (Roy & Pal, 2014). For an assumed location near the Galactic Center ( kpc), the diameter is about 2 pc. G1.9+0.3 (catalog ) is quite asymmetric (Figure 1), and the thermal emission is also asymmetrically distributed (Borkowski et al., 2013b, Paper VI). The relative prominence of Fe lines, high velocities, absence of a pulsar-wind nebula, and bilaterally symmetric synchrotron emission (as in SN 1006) all point toward a Type Ia origin. Only a very unusual core-collapse event could reproduce the observations, while a reasonable SN Ia model can reach the observed size and velocity for a mean external density of about 0.02 cm-3 (Paper V). Observing the rapid evolution of G1.9+0.3 (catalog ) in morphology and brightness can provide unprecedented information on the dynamics of SN ejecta and on particle acceleration.
2. Observations
Chandra observed G1.9+0.3 (catalog ) with the ACIS S3 chip on three epochs: (I) 2007 February and March, (II) 2009 July, and (III) 2011 May and July (details in Papers I and III – VI). All observations were done in Very Faint Mode, and reprocessed with CIAO v4.6 and CALDB 4.5.9. The corresponding effective exposure times are 49.6 ks, 237 ks, and 977 ks. Exposure-weighted time intervals between the deep Epoch III and shorter Epoch I and II observations are 4.274 yr and 1.861 yr. Alignment of observations at different epochs is performed simultaneously with expansion measurements.
Images, pixels in size, were extracted from the merged event files by binning event positions to half the ACIS pixel size, so one image pixel is . We also extracted data cubes, in size, using the same spatial pixel size, while spectral channels from 84 to 595 (1.2–8.7 keV energy range) were binned by a factor of 8.
X-ray spectra were extracted from individual rather than merged event files, and then summed (response files were averaged). Spectral analysis was performed with XSPEC v12.8.1 (Arnaud, 1996), using C-statistics (Cash, 1979). Background was modeled rather than subtracted. Spectra of G1.9+0.3 (catalog ) were modeled with an absorbed power law, using solar abundances of Grevesse & Sauval (1998) in the phabs absorption model. Thermal emission contributes negligibly to broadband fluxes.
3. Expansion
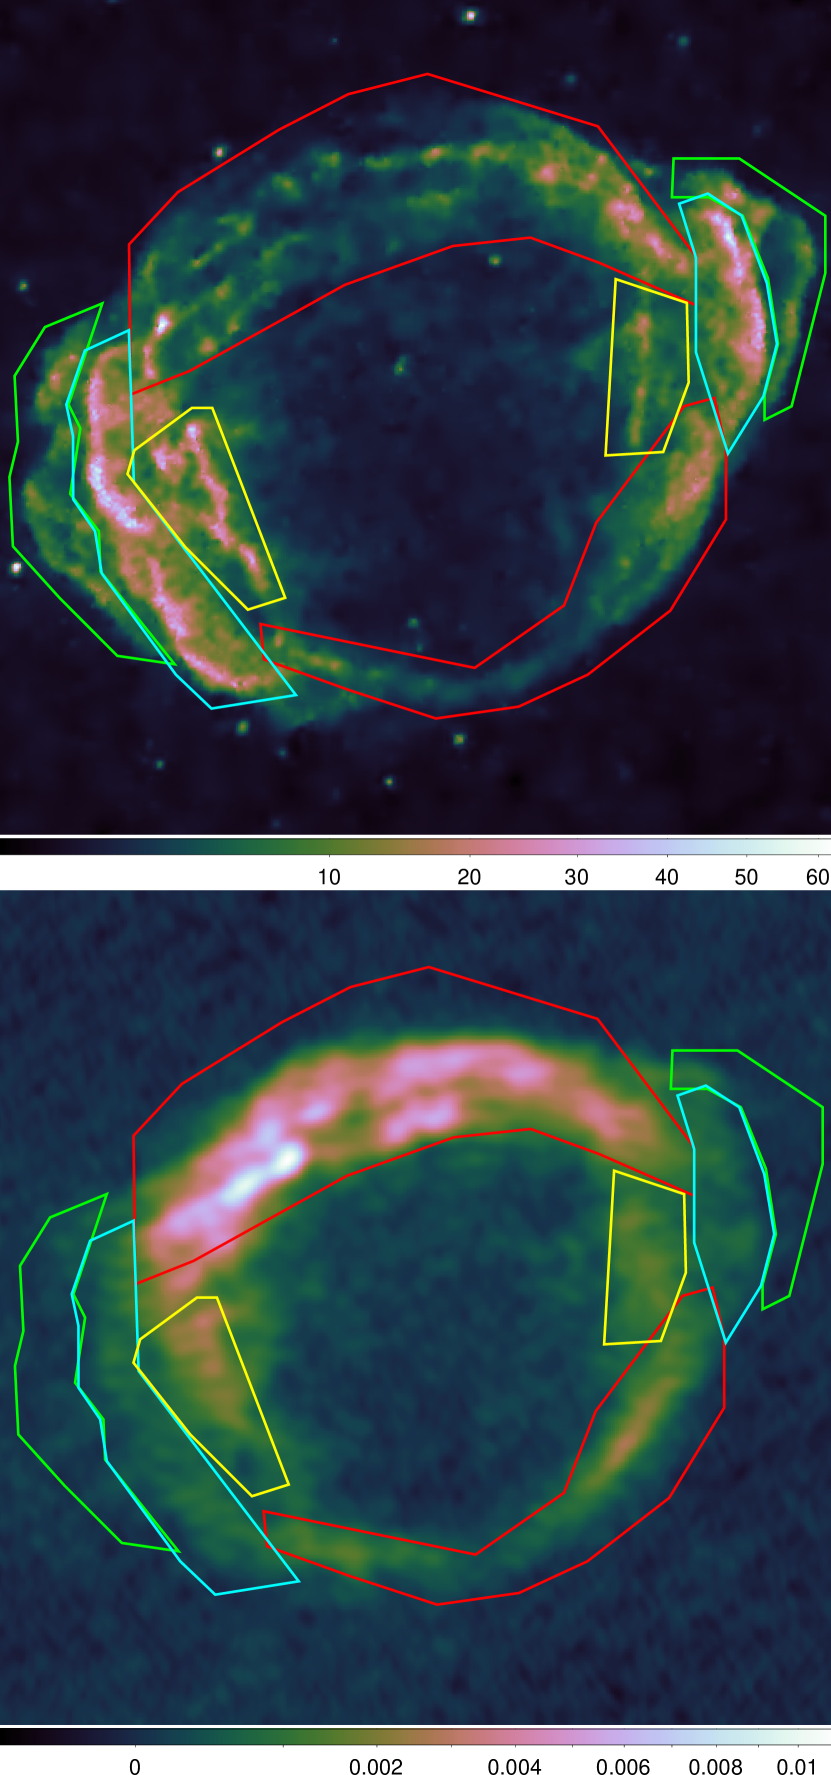
We first measured the overall expansion using the method described in Paper V. Briefly, we smoothed the 2011 Chandra data cube with the spectro-spatial method of Krishnamurthy et al. (2010), and summed the smoothed cubes in the spectral dimension to arrive at smoothed images in the 1.2–8 keV energy range. (Softer X-rays are absorbed by the intervening interstellar medium, while the background dominates at the highest energies.) We used the smoothed image as a model for the surface brightness of G1.9+0.3 (catalog ) at Epoch III (Figure 1). This model image was background-subtracted then fit to the unsmoothed 1.2–8 keV images from earlier epochs (i.e., shrunk to fit) using C-statistics. Seven point sources within G1.9+0.3 (catalog ) were masked out. There are four free parameters in this model: a physical scaling factor, a surface-brightness scaling factor, and expansion center coordinates. Independent fits to Epoch I and II images were consistent with the constant expansion. We then assumed the same expansion rate while fitting jointly to the Epoch I and II images, but allowed for independent surface-brightness scaling factors and expansion center coordinates. Results of all measurements are listed in Table 1. The measured expansion rate is % yr-1 (all errors are 90% confidence), in reasonable agreement with our previous measurement of % (Paper V). Within errors, the mean surface brightness does not vary with time, again in agreement with Paper V.
To search for deviations from uniform expansion, we systematically examined motions of large, distinct spatial structures. The final regions chosen are overlaid over X-ray and radio images in Figure 1. They include a pair on the N and S rim and three pairs of regions along the major SE-NW axis: an outer pair (“ears”), a middle pair containing the brightest rim emission, and an inner pair with distinct interior rims.
Measurements of expansion for each region pair were done in the same way as for the entire remnant. We assumed a common expansion center of coordinates for all pairs for Epochs I and II, but the measured expansion rates are insensitive to this assumption. Slightly different region positions and areas (but not shapes) were used for Epochs I and II, to approximately match the measured expansion rates. The common expansion centers of (J2000) coordinates are R.A. (), Decl. () for Epoch I (II). A small () but significant difference between these centers suggests that the coordinates of the corresponding reference observations ID6708 and ID10112 are slightly misaligned. The magnitude of this shift is consistent with the Chandra external astrometric errors (mean error of ; Rots, 2009).
| Region | Expansion Rate | aaSurface brightness change. | aaSurface brightness change. | bbHydrogen column density. | ccPower-law photon index. | ddAbsorbed flux in the 1–7 keV energy range. | ddAbsorbed flux in the 1–7 keV energy range. | ddAbsorbed flux in the 1–7 keV energy range. | eeFlux rate increase. |
|---|---|---|---|---|---|---|---|---|---|
| (% yr-1) | (% yr-1) | ( cm-2) | ( ergs cm-2 s-1) | (% yr-1) | |||||
| Total | 0.589 | -0.2 | 0.4 | 7.25 | 2.40 | 27.34 | 28.79 | 29.73 | 1.9 |
| (0.573, 0.605) | (-0.7, 0.2) | (-0.1, 0.9) | (7.16, 7.34) | (2.37, 2.43) | (26.75, 27.93) | (28.50, 29.08) | (29.57, 29.99) | (1.5, 2.3) | |
| Outer SE-NW pair | 0.523 | 0.0 | 1.9 | 7.90 | 2.13 | 2.72 | 2.87 | 2.89 | 0.9 |
| (0.487, 0.560) | (-1.5, 1.7) | (0.2, 3.6) | (7.60, 8.21) | (2.04, 2.23) | (2.61, 2.83) | (2.81, 2.92) | (2.86, 2.91) | (-0.3, 2.2) | |
| Middle SE-NW pair | 0.616 | -0.4 | 1.0 | 7.58 | 2.34 | 9.16 | 9.75 | 10.05 | 1.9 |
| (0.592, 0.640) | (-1.1, 0.4) | (0.2, 1.8) | (7.45, 7.72) | (2.29, 2.38) | (8.97, 9.35) | (9.66, 9.84) | (10.00, 10.09) | (1.3, 2.5) | |
| Inner SE-NW pair | 0.842 | 0.3 | -0.3 | 7.02 | 2.38 | 3.56 | 3.66 | 3.91 | 2.8 |
| (0.783, 0.898) | (-0.9, 1.6) | (-1.6, 1.0) | (6.82, 7.23) | (2.31, 2.45) | (3.45, 3.70) | (3.60, 3.71) | (3.88, 3.94) | (1.8, 3.8) | |
| N-S pair | 0.576 | -0.2 | -0.2 | 7.09 | 2.51 | 8.23 | 8.65 | 9.00 | 2.1 |
| (0.544, 0.609) | (-1.0, 0.7) | (-1.1, 0.6) | (6.96, 7.23) | (2.46, 2.56) | (8.05, 8.41) | (8.56, 8.74) | (8.95, 9.05) | (1.4, 2.8) | |
Note. — Expansion rates and fluxes in odd rows, 90% confidence limits in even rows.
The measured expansion rates strongly deviate from uniform expansion (Table 1). Expansion rates increase inward by about 60% along the bright SE-NW axis, ranging from % yr-1 for the outer ears to % yr-1 for the inner rims. The bright rims in the middle expand slightly faster (% yr-1) than the ears, but even this small difference is statistically highly significant. The brightness-weighted linear displacement is yr-1 for all three rims. The N–S expansion is intermediate (% yr-1) between the bright middle rims and the ears, with the average displacement of yr-1. We demonstrate this differential expansion for two representative profiles in SE and NW based on the Epoch II observations (Figures 2 and 3). As is seen most clearly in the close-up inserts, the expansion rate (green) that matches the bright middle rims is too slow (too little shrinkage) for the inner rims, while the faster expansion rate (red) that matches the inner rims is too fast for the middle and outer rims.
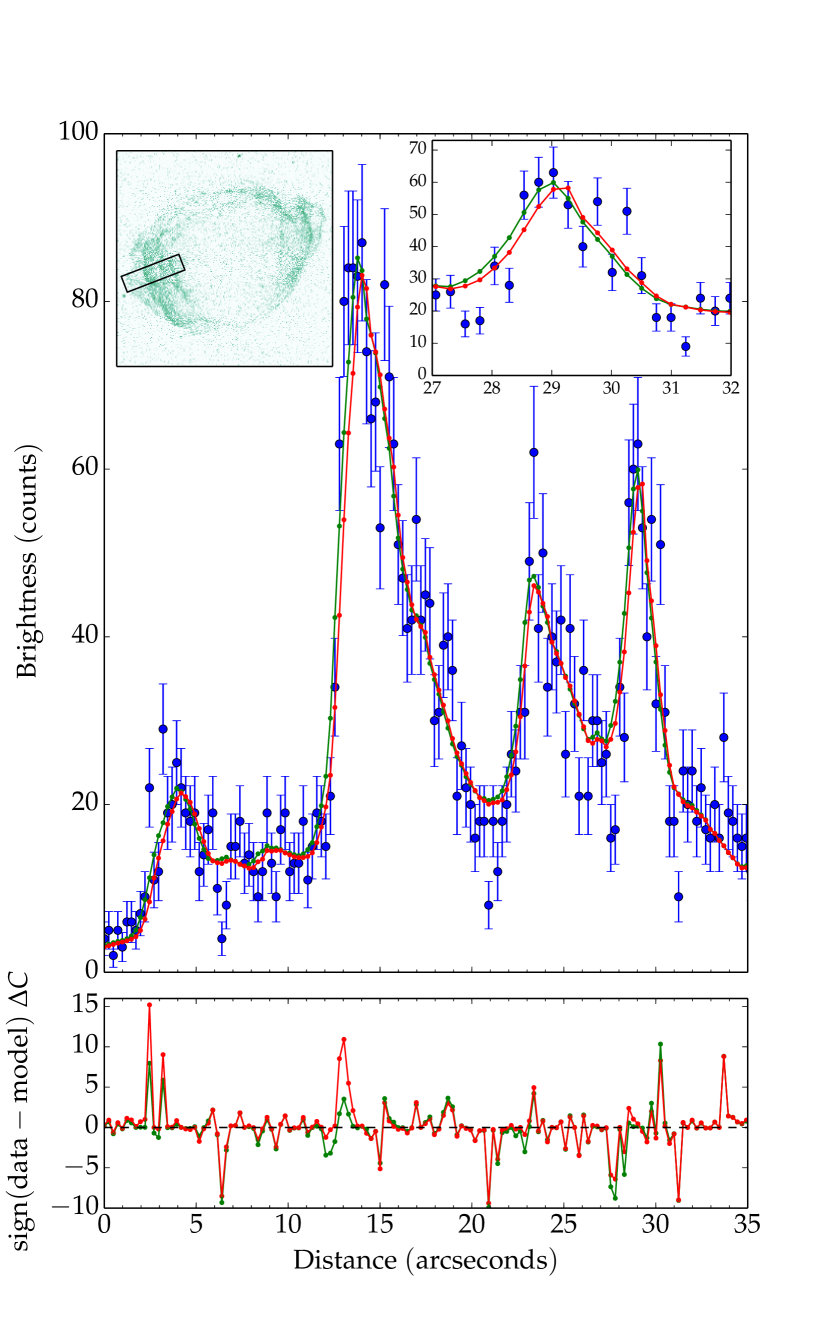
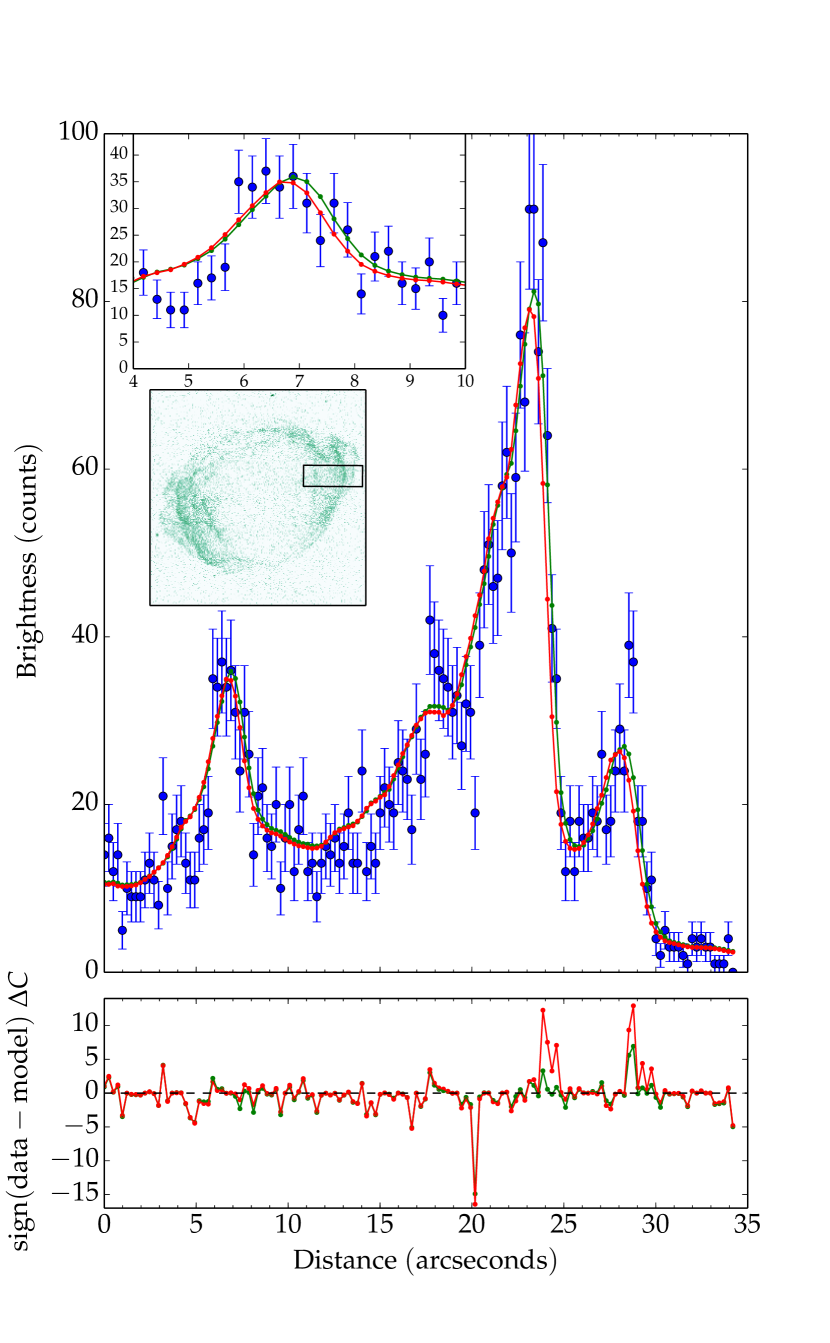
Contributions to C-statistic along the profiles quantify the fit quality. Systematic deviations are present even for the best-fit models, perhaps due to spatial variation of the Chandra point-spread function, smaller-scale spatial variations in expansion rate, or projection effects. Strong counting noise limits the accuracy of the expansion measurements. However, these profiles are merely illustrative; the results in Table 1 are derived from the expansion of the entire regions shown in Figure 1.
4. Flux Increase
The spatially-integrated spectra of G1.9+0.3 (catalog ) from each epoch were jointly fit, together with their background spectra, with an absorbed power law in the 1 – 9 keV energy range. The power-law index and absorbing column density were assumed constant in time, but the fluxes at each epoch were left free. There is good agreement with previous measurements for Epoch I, but the newly-determined Epoch II flux is 2.5% larger, in disagreement with the previous measurement also reported in Paper V, presumably due to updates in the ACIS S3 calibration that were applied to all three datasets.
Spatially-integrated fluxes are clearly increasing with time (Table 1). A likelihood ratio test reveals that the linear flux increase is consistent with the individual flux measurements. The measured flux increase is % yr-1, in agreement with the previous, less accurate value of yr-1 (Paper V).
We also measured fluxes and rates of flux increase for the region pairs shown in Figure 1, in the same way as for the spatially-integrated fluxes except that the background contribution was scaled down (rather than fit again) by the region/total area ratios from the global fit. For each region pair, the measured rate of flux increase is consistent with the spatially-integrated rate. There is an apparent trend in brightening rate with radius, but uncertainties are large, due to uncertainties in expanding the regions and to dust scattering of emission from brighter regions (Paper III), as well as to large measurement errors. We conclude that evidence for spatial variations in the rate of flux increase is weak, although it should be the subject of future investigations.
5. Discussion
The nonuniform expansion we observe for our three pairs of regions can be rephrased as large differences in expansion age (), in the sense that is largest (greatest deceleration) for the slower-expanding outermost material (see Figure 1 and Table 1). The outermost ears, bright rim emission in the middle, and distinct interior rims all have measurably different expansion ages: 190 yr, 160 yr, and 120 yr. We define expansion indices so that a feature at radius obeys (note that , where is the projection of the true radius onto the plane of the sky). Then the true remnant age , where is the forward-shock expansion index. Since we only have an estimate of 100 yr for the true remnant age (Paper V), we can only determine relative values.
The large spread in expansion ages between the inner rims and the ears implies a large deceleration of the forward shock, , significantly stronger than expected () in the models with smoothly varying density distributions for ejecta and ambient medium considered in Paper V. But the more fundamental problem is that, contrary to observations, in these models typically varies only slightly (if at all) from the reverse shock to the blast wave, and it increases instead of decreasing with radius (Chevalier, 1982; Dwarkadas & Chevalier, 1998, hereafter DC98). Either the ejecta or the ambient medium density distribution (or both) must be very different from the slowly-varying density distributions considered so far. Various possibilities include substantial clumping or sudden density jumps within the ejecta or the ambient medium.
Fine-scale clumping within the ejecta is unlikely to explain faster than expected expansion of the inner rims, however. Much like the outer rims, the inner rims consist of cohesive and continuous filaments in contrast to the much more clumpy north rim (Figure 1) where the ejecta emit most strongly in thermal X-rays (Paper VI). Another explanation involves a rapid deceleration of the blast wave upon a recent encounter with a moderate density jump in the ambient medium. In order to account for about 60% – 70% slower expansion of the middle and outer rims relative to the inner rims (Table 1), a factor of 3 – 6 density jump is required (from eqs. 4 and 6 in Borkowski et al., 1997). A density jump of this magnitude is consistent with a wind termination shock. If this were true, the SN progenitor must have been losing mass in a strong and asymmetric stellar wind. We estimate the wind parameter (, where is the mass-loss rate and is the wind speed) at km s-1, using the analytic wind thin-shell solution for an exponential ejecta density distribution from Paper V with the remnant’s radius of 2 pc and undecelerated age of 120 yr, and assuming a standard thermonuclear explosion with kinetic energy ergs and ejected mass equal to the Chandrasekhar mass. Such a strong wind favors a single-degenerate progenitor (Hachisu et al., 1996). The deceleration is in this model, suggesting that the explosion occurred sometime in the first decade of the 20th century. In this scenario, it is difficult to understand the origin of the strong north-south asymmetry seen at radio wavelengths (Figure 1) and in the spatial distribution of thermal X-ray emission. As discussed in Paper VI, a strongly asymmetric Type Ia explosion provides the best explanation for this asymmetry.
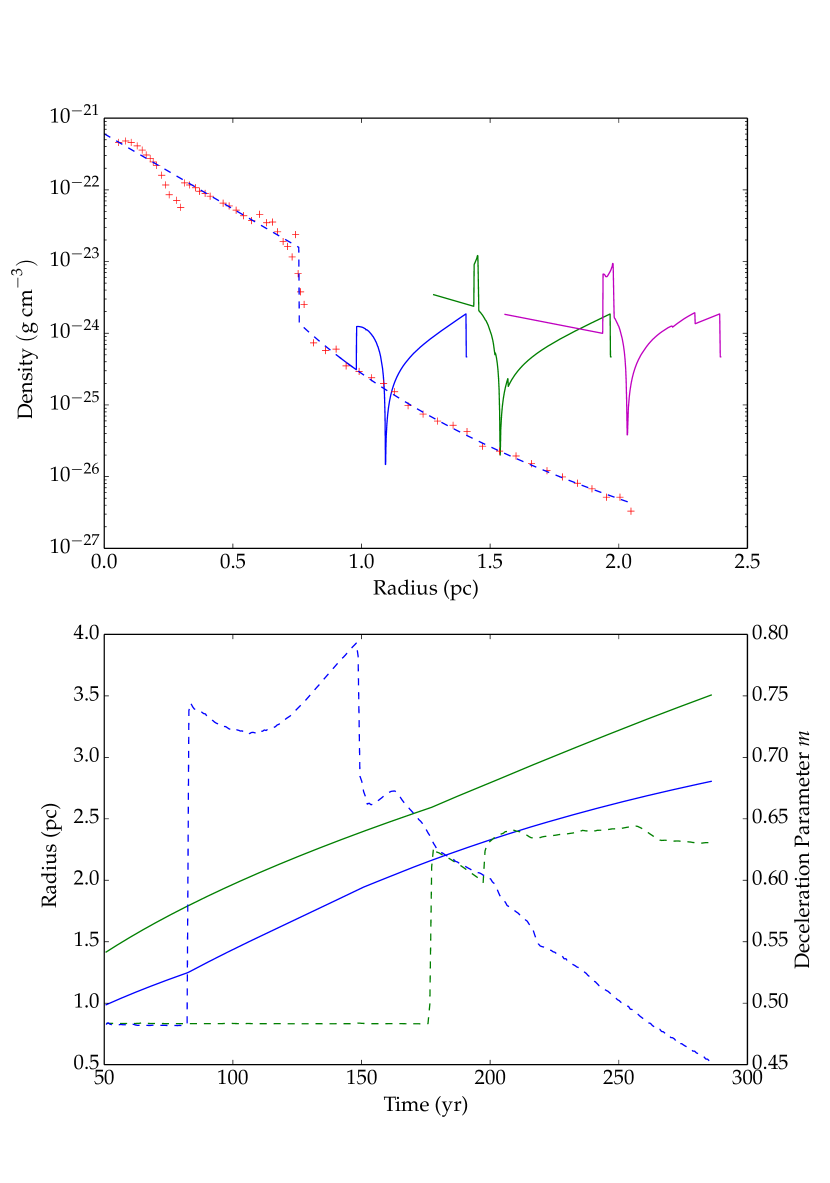
Unlike for smooth ejecta density profiles (such as resulting from delayed-detonation explosions), it is possible to obtain less deceleration inward () in 1-D numerical models for SNe Ia expanding into a uniform ambient medium for ejecta profiles with substantial structure (e.g., the PDDe model in Badenes et al., 2003). Prominent density structures in the outer ejecta layers are present in the deflagration models (e.g., the W7 model of Nomoto et al. 1984), sub-Chandrasekhar explosions (DC98; Badenes et al., 2003), and in pulsating delayed-detonation (PDD) models (e.g., Dessart et al., 2014, see their PDDEL1 model plotted in Figure 4). This density profile can be satisfactorily approximated by a power law with above the transition velocity km s-1, and by the exponential model of DC98 at lower velocities. At , there is a large () density jump.
In order to investigate how a density jump affects speeds of the reverse and forward shocks, we performed 1-D hydrodynamical simulations with the VH-1 hydrocode (for a recent description of this code, see Warren & Blondin, 2013) for this composite power-law-exponential ejecta model, We discuss here results for a preshock density of cm-3, matching the preshock density found in a young Type Ia SNR 0509-67.5 (catalog ) in the Large Magellanic Cloud (Williams et al., 2011), but they can be scaled to any value of (DC98). Prior to the impact of the reverse shock with the density jump, the density profile can be described by the self-similar solutions of Chevalier (1982) with (see the density profile at 50 yr in Figure 4). The reverse shock arrives at the density jump at yr with velocity (in the frame of reference moving with the ejecta), and then splits into transmitted and reflected shocks. The transmitted shock is the decelerated reverse shock (inward-facing). Its velocity is where is the pressure enhancement that depends only on the density jump and varies between 1 and 6 (see equation 6 in Borkowski et al., 1997). In the rest frame of the explosion, deceleration of the transmitted reverse shock becomes . With , the overpressure is , and increases to , in good agreement with hydrodynamical simulations (Figure 4). The reflected shock propagates first back into the shocked ejecta, and then into the shocked ambient medium. At 100 yr, it has already passed through the low-density contact discontinuity that separates the shocked ejecta from the shocked ambient medium, and can be seen in Figure 4 as a small density discontinuity near the contact discontinuity. The reflected shock strengthens with time (see density profile at 150 yr), and eventually merges with the blast wave at 175 yr, resulting in an abrupt increase of from 0.48 to 0.62. By this time, has already decreased to about the same value after a transient phase following the sudden deceleration of the reverse shock. This decrease continues in the subsequent evolution, while stays about constant, so that .
During an extended period of time comparable with a young Type Ia remnant’s age, PDD explosions show a more rapid expansion of the reverse shock than the forward shock (Figure 4). While this still might be a reasonable interpretation for G1.9+0.3 (catalog ), published PDD models fail to match its properties in detail. Assuming the ejecta structure of the composite model just described and identifying the blast wave with the bright middle rims at pc expanding at 0.62% yr-1, the inferred preshock density and free expansion ejecta velocity at the reverse shock are cm-3 and km s-1. At 8.5 kpc, is several times higher than estimated in Paper V, but the ejecta velocity is consistent with previous estimates. G1.9+0.3 (catalog ) is dynamically too young, however, for the reverse shock to have reached the density jump at km s-1. No published PDD model has as high as km s-1, with the highest ( km s-1) in the PDDa model (Badenes et al., 2003). Among models considered by Badenes et al. (2003), only the sub-Chandrasekhar model SCH has higher at km s-1. Furthermore, sub-Chandrasekhar explosions produce large (up to several ) amounts of radioactive 44Ti (e.g., Woosley & Kasen, 2011), while the strength of the (possible) 44Sc line implies that at most of 44Ti was expelled by the SN that produced G1.9+0.3 (catalog ) (Borkowski et al., 2013a).
Only the outermost ( km s-1) ejecta have been shocked so far in G1.9+0.3 (catalog ) (velocities might be as high as km s-1 if kpc; Roy & Pal, 2014). Discrete absorption features with such extreme velocities are commonly seen in Type Ia SN spectra (e.g., Childress et al., 2014), perhaps indicating the presence of dense shells of material (Tanaka et al., 2006). Their origin is unknown, but possible explanations include a collision of ejecta with circumstellar medium or clumping within the ejecta. Fast dense shells with an order-of-magnitude density contrast relative to overlying tenuous ejecta are expected to decelerate the reverse shock just like the density jump in PDD models. This might be the explanation for the fast expansion of the reverse shock in G1.9+0.3 (catalog ).
The flux increase may be due to global effects such as an increase in magnetic-field strength, which would raise radio fluxes as well, and/or an increase in the maximum energy to which electrons are accelerated, which could raise X-ray fluxes even with constant radio. The radio flux of G1.9+0.3 (catalog ) is rising at 1 – 2% yr-1 (Green et al., 2008, Paper II; Murphy et al., 2008); our ongoing JVLA observations should reduce the uncertainty to determine if this rate is consistent with the X-ray rate. A higher X-ray than radio rate of increase would require an increasing maximum energy, a very interesting result. Spatial variations contain additional information. One might naively expect the greatest brightness increase at the location of greatest deceleration (thermalization of kinetic energy); our data suggest but do not compel this conclusion.
G1.9+0.3 (catalog ) offers us a unique opportunity to study the dynamics and spatial distribution of the outermost ejecta of a likely Type Ia SN, and the process of particle acceleration in very fast collisionless shocks. Our current understanding of its dynamics and of spatial variations in the flux rate increase is limited by the short time baseline of the Epoch I – III observations and the poor signal to noise of the 2007 and 2009 Chandra datasets. Further Chandra observations will allow for significant advances in our understanding of G1.9+0.3 (catalog ).
This work was supported by NASA through Chandra General Observer Program grants SAO G01-12098A and B.
References
- Arnaud (1996) Arnaud, K. A. 1996, in Astronomical Data Analysis and Systems V, eds. G.Jacoby & J.Barnes, ASP Conf. Series, v.101, 17
- Badenes et al. (2003) Badenes, C., Bravo, E., Borkowski, K. J., & Domínguez, I. 2003, ApJ, 593, 358
- Borkowski et al. (1997) Borkowski, K. J., Blondin, J. M., & McCray, R. 1997, ApJ, 477, 281
- Borkowski et al. (2010, Paper IV) Borkowski, K. J., Reynolds, S. P., Green, D. A., et al. 2010, ApJ, 724, 161 (Paper IV)
- Borkowski et al. (2013a) Borkowski, K. J., Reynolds, S. P., Green, D. A., et al. 2013a, AAS HEAD Mtg. 13 (Monterey, CA), 127.06 (available through ADS)
- Borkowski et al. (2013b, Paper VI) Borkowski, K. J., Reynolds, S. P., Hwang, U., et al. 2013b, ApJ, 771:L9 (Paper VI)
- Carlton et al. (2011, Paper V) Carlton, A. K., Borkowski, K. J., Reynolds, S. P., et al. 2011, ApJ, 2011, 737:L22 (Paper V)
- Cash (1979) Cash, W. 1979, ApJ, 228, 939
- Chevalier (1982) Chevalier, R. A. 1982, ApJ, 258, 790
- Childress et al. (2014) Childress, M. J., Filippenko, A. V., Ganeshalingam, M., & Schmidt, B. P. 2014, MNRAS, 437, 338
- Dessart et al. (2014) Dessart, L., Blondin, S., Hiller, D. J., & Khokhlov, A. 2014, MNRAS, 441, 532
- Dwarkadas & Chevalier (1998) Dwarkadas, V. V., & Chevalier, R. A. 1998, ApJ, 497, 807 (DC98)
- Green (2011) Green, D. A. 2011, BASI, 39, 289
- Green et al. (2008, Paper II) Green, D. A., Reynolds, S. P., Borkowski, K. J., et al. 2008, MNRAS, 387, L54 (Paper II)
- Grevesse & Sauval (1998) Grevesse, N., & Sauval, A. J. 1998, Space Sci. Rev., 85, 161
- Hachisu et al. (1996) Hachisu, I., Kato, M., & Nomoto, K. 1996, ApJ, 470, L97
- Krishnamurthy et al. (2010) Krishnamurthy, K., Raginsky, M., & Willett, R. 2010, SIAM J. Imaging Sci., 3, 619
- Murphy et al. (2008) Murphy, T., Gaensler, B. M., & Chatterjee, S. 2008, MNRAS, 389, L23
- Nomoto et al. (1984) Nomoto, K., Thielemann, F.-K., & Yokoi, K. 1984, ApJ, 286, 644
- Reynolds et al. (2008, Paper I) Reynolds, S. P., Borkowski, K. J., Green, D. A., et al. 2008, ApJ, 680, L41 (Paper I)
- Reynolds et al. (2009, Paper III) Reynolds, S. P., Borkowski, K. J., Green, D. A., et al. 2009, ApJ, 695, L149 (Paper III)
- Rots (2009) Rots, A. 2009, Determining the Astrometric Error in CSC Source Positions, http://cxc.harvard.edu/csc/memos/files/Rots_CSCAstrometricError.pdf
- Roy & Pal (2014) Roy, S., & Pal, S. 2014, in Proc. IAU Symposium 296, Supernova Environmental Impacts, Eds. A. Ray & R. A. McCray (Cambridge University Press), 197
- Tanaka et al. (2006) Tanaka, M., Mazzali, P. A., Maeda, K., & Nomoto, K. 2006, ApJ, 645, 470
- Warren & Blondin (2013) Warren, D. C., & Blondin, J. M. 2013, MNRAS, 429, 3099
- Williams et al. (2011) Williams, B. J., Borkowski, K. J., Reynolds, S. P., et al. 2011, ApJ, 729:65
- Woosley & Kasen (2011) Woosley, S. E., & Kasen, D. 2011, ApJ, 734:38