Modeling Probability Forecasts via Information Diversity
Abstract
Randomness in scientific estimation is generally
assumed to arise from unmeasured or uncontrolled factors. However,
when combining subjective probability estimates, heterogeneity
stemming from people’s cognitive or information diversity is often
more important than measurement noise. This paper presents a novel
framework that uses partially
overlapping information sources. A specific model is proposed
within that framework and applied to the task of aggregating
the probabilities given by a group of forecasters
who predict whether an event will occur or not. Our model describes
the distribution of information across forecasters in terms of easily
interpretable parameters and shows how the optimal amount
of extremizing of the average probability forecast (shifting
it closer to its nearest extreme) varies as a function of the forecasters’
information overlap. Our model thus gives a more principled
understanding of the historically ad hoc practice of extremizing
average forecasts. Supplementary material for this article is available
online.
Keywords: Expert belief; Gaussian process; Judgmental forecasting; Model
averaging; Noise reduction
1. INTRODUCTION AND OVERVIEW
1.1 The Forecast Aggregation Problem
Probability forecasting is the science of giving probability estimates for future events. Typically more than one different forecast is available on the same event. Instead of trying to guess which prediction is the most accurate, the predictions should be combined into a single consensus forecast (Armstrong,, 2001). Unfortunately, the forecasts can be combined in many different ways, and the choice of the combination rule can largely determine the predictive quality of the final aggregate. This is the principal motivation for the problem of forecast aggregation that aims to combine multiple forecasts into a single forecast with optimal properties.
There are two general approaches to forecast aggregation: empirical and theoretical. Given a training set with multiple forecasts on events with known outcomes, the empirical approach experiments with different aggregation techniques and chooses the one that yields the best performance on the training set. The theoretical approach, on the other hand, first constructs a probability model and then computes the optimal aggregation procedure under the model assumptions. Both approaches are important. Theory-based procedures that do not perform well in practice are ultimately of limited use. On the other hand, an empirical approach without theoretical underpinnings lacks both credibility (why should we believe it?) and guidance (in which direction can we look for improvement?). As will be discussed below, the history of forecast aggregation to date is largely empirical.
The main contribution of this paper is a plausible theoretical framework for forecast aggregation called the partial information framework. Under this framework, forecast heterogeneity stems from information available to the forecasters and how they decide to use it. For instance, forecasters studying the same (or different) articles on the presidential election may use distinct parts of the information and hence report different predictions of a candidate winning. Second, the framework allows us to interpret existing aggregators and illuminate aspects that can be improved. This paper specifically aims to clarify the practice of probability extremizing, i.e., shifting an average aggregate closer to its nearest extreme. Extremizing is an empirical technique that has been widely used to improve the predictive performance of many simple aggregators such as the average probability. Lastly, the framework is applied to a specific model under which the optimal aggregator can be computed.
1.2 Bias, Noise, and Forecast Assessment
Consider an event and an indicator function that equals one or zero depending whether happens or not, respectively. There are two common yet philosophically different approaches to linking with the probability forecasts. The first assumes , where is deemed a “true” or “objective” probability for , and then treats a probability forecast as an estimator of (see, e.g., Lai et al., 2011, and Section 2.2 for further discussion). The second approach, on the other hand, treats as an estimator of . This links the observables directly and avoids the controversial concept of a “true” probability; for this reason it is the approach adopted in this paper.
As is the case with all estimators, the forecast’s deviation from the truth can be broken into bias and noise. Given that these components are typically handled by different mechanisms, it is important, on the theoretical level, to consider them as two separate problems. This paper focuses on noise reduction. Therefore, each forecaster is considered calibrated. Here calibration is defined in terms of conditional expectation and hence represents a property of the underlying joint distribution of and . More specifically, the forecast is calibrated for the outcome if almost surely. This form of calibration was alluded to by Murphy and Winkler, (1987) and mentioned possibly even earlier than that. Over the years it has become common in the statistical and meteorological forecasting literature (see, e.g., Ranjan and Gneiting, 2010; Jolliffe and Stephenson, 2012, Section 7.2.2. for recent references). It is, however, different from the notion of empirical calibration discussed by Dawid, (1982), Foster and Vohra, (1998), and many others.
A forecast (individual or aggregate) is typically assessed with a loss function . A loss function is called proper or revealing if the Bayesian optimal strategy is to tell the truth. In other words, if the subjective probability estimate is , then should minimize the expected loss . Therefore, if a group of sophisticated forecasters operates under a proper loss function, the assumption of calibrated forecasts is, to some degree, self-fulfilling. There are, however, many different proper loss functions, and an estimator that outperforms another under one loss function will not necessarily do so under a different one. For example, minimizing the quadratic loss function , also known as the Brier score, gives the estimator with the least variance. This paper concentrates on minimizing the variance of the aggregators, though much of the discussion holds under general proper loss functions. See Hwang and Pemantle, (1997) for a discussion of proper loss functions.
1.3 The Partial Information Framework
The construction of the partial information framework begins with a probability space and a measurable event to be forecasted by forecasters. These forecasters operate under the same probability model but make predictions based on different information sets. More specifically, in any Bayesian setup, with a proper loss function, it is more or less tautological that Forecaster reports , where is the information set used by the forecaster. Therefore if , and forecast heterogeneity stems purely from information diversity. Note, however, that if Forecaster uses a simple rule, may not be the full -field of information available to the forecaster but rather a smaller -field corresponding to the information used by the rule. For example, when forecasting the re-election of the president, a forecaster obeying the dictum “it’s the economy, stupid!” might utilize a -field containing only economic indicators. Furthermore, if two forecasters have access to the same -field, they may decide to use different sub--fields, leading to different predictions. Therefore, information diversity does not only arise from differences in the available information, but also from how the forecasters decide to use it.
The person performing the aggregation is assumed to know only , namely the trivial -field. Given that every forecaster knows at least as much, the aggregator readily adopts any forecaster’s prediction without modification. Therefore, each forecaster is considered to be an “expert” in the sense introduced in DeGroot, (1988) and later discussed in Dawid et al., (1995).
Under the partial information framework the forecasts are calibrated. This can be verified by direct computation as follows:
Conversely, if is any calibrated forecast, then , where is the -field generated by . This shows constructively that assuming the general form does not pose any additional restrictions but arises directly from the assumption of calibration and the existence of an underlying probability model. The -field , however, corresponds to the information revealed by the forecast and hence may not be equal to the full -field of information actually used by the forecaster, namely .
The distinction between and introduces two benchmarks for aggregation efficiency. The first is the oracular aggregator , where is the -field generated by the union of the information sets . This field represents all the information used by the forecasters. Given that aggregation cannot be improved beyond using all the information of the forecasters, the oracular aggregator represents a theoretical optimum and is therefore a reasonable upper bound on estimation efficiency.
In practice, however, information comes to the aggregator only through the forecasts . Given that generally cannot be constructed from these forecasts alone, no practically feasible aggregator can be expected to perform as well as . Therefore, a more achievable benchmark is the revealed aggregator , where is the -field generated (or revealed) by the forecasts , or equivalently by the union of the generated -fields .
Even though the partial information framework, as specified above, is too theoretical for direct application, it highlights the crucial components of information aggregation and hence facilitates formulation of more specific models within the framework. This paper develops such a model and calls it the Gaussian partial information model. Under this model, the information among the forecasters is summarized by a covariance structure. This provides sufficient flexibility to allow for construction of many application-specific aggregators.
1.4 Organization of the Paper
The next section reviews prior work on forecast aggregation and relates it to the partial information framework. Section 3 discusses illuminating examples and motivates the Gaussian partial information model. Section 4 compares the oracular aggregator with the average probit score, thereby explaining the empirical practice of probability extremizing. Section 5 derives the revealed aggregator and evaluates one of its sub-cases on real-world forecasting data. The final section concludes with a summary and discussion of future research.
2. PRIOR WORK ON AGGREGATION
2.1 The Interpreted Signal Framework
Hong and Page, (2009) introduce the interpreted signal framework in which the forecaster’s prediction is based on a personal interpretation of (a subset of) the factors or cues that influence the future event to be predicted. Differences among the predictions are ascribed to differing interpretation procedures. For example, if two forecasters follow the same political campaign speech, one forecaster may focus on the content of the speech while the other may concentrate largely on the audience interaction. Even though the forecasters receive the same information, they interpret it differently and therefore are likely to report different estimates of the probability that the candidate wins the election. Therefore forecast heterogeneity is assumed to stem from “cognitive diversity”.
This is a very reasonable assumption that has been analyzed and utilized in many other settings. For example, Parunak et al., (2013) demonstrate that optimal aggregation of interpreted forecasts is not constrained to the convex hull of the forecasts; Broomell and Budescu, (2009) analyze inter-forecaster correlation under the assumption that the cues can be mapped to the individual forecasts via different linear regression functions. To the best of our knowledge, no previous work has discussed a formal framework that explicitly links the interpreted forecasts to their target quantity. Consequently, the interpreted signal framework, as proposed, has remained relatively abstract. The partial information framework, however, formalizes the intuition behind it and permits models with quantitative predictions.
2.2 The Measurement Error Framework
In the absence of a quantitative interpreted signal model, prior applications have typically relied on the measurement error framework that generates forecast heterogeneity from a probability distribution. More specifically, the framework assumes a “true” probability , interpreted as the forecast made by an ideal forecaster, for the event . The forecasters then “measure” some transformation of this probability with mean-zero idiosyncratic error. Therefore each forecast is an independent draw from a common probability distribution centered at , and a recipe for an aggregate forecast is given by the average
| (1) |
Common choices of are the identity , the log-odds , and the probit , giving three aggregators denoted in this paper with , , and , respectively. These averaging aggregators represents the main advantage of the measurement error framework: simplicity.
Unfortunately, there are a number of disadvantages. First, given that the averaging aggregators target instead of , important properties such as calibration cannot be expected. In fact, the averaging aggregators are uncalibrated and under-confident, i.e., too close to , even if the individual forecasts are calibrated (Ranjan and Gneiting,, 2010).
Second, the underlying model is rather implausible. Relying on a true probability is vulnerable to many philosophical debates, and even if one eventually manages to convince one’s self of the existence of such a quantity, it is difficult to believe that the forecasters are actually seeing with independent noise. Therefore, whereas the interpreted signal framework proposes a micro-level explanation, the measurement error model does not; at best, it forces us to imagine that the forecasters are all in principle trying to apply the same procedures to the same data but are making numerous small mistakes.
Third, the averaging aggregators do not often perform very well in practice. For one thing, Hong and Page, (2009) demonstrate that the standard assumption of conditional independence poses an unrealistic structure on interpreted forecasts. Any averaging aggregator is also constrained to the convex hull of the individual forecasts, which further contradicts the interpreted signal framework (Parunak et al.,, 2013) and can be far from optimal on many datasets.
2.3 Empirical Approaches
If one is not concerned with theoretical justification, an obvious approach is to perturb one of these estimators and observe whether the adjusted estimator performs better on some data set of interest. Given that the measurement error framework produces under-confident aggregators, a popular adjustment is to extremize, that is, to shift the average aggregates closer to the nearest extreme (either zero or one). For instance, Ranjan and Gneiting, (2010) extremize with the CDF of a beta distribution; Satopää et al., 2014a use a logistic regression model to derive an aggregator that extremizes ; Baron et al., (2014) give two intuitive justifications for extremizing and discuss an extremizing technique that has previously been used by a number of investigators (Erev et al., 1994; Shlomi and Wallsten, 2010; and even Karmarkar, 1978); Mellers et al., (2014) show empirically that extremizing can improve aggregate forecasts of international events.
These and many other studies represent the unwieldy position of the current state-of-the-art aggregators: they first compute an average based on a model that is likely to be at odds with the actual process of probability forecasting, and then aim to correct the induced bias via ad hoc extremizing techniques. Not only does this leave something to be desired from an explanatory point of view, these approaches are also subject to overfitting. Most importantly, these techniques provide little insight beyond the amount of extremizing itself and hence lack a clear direction of continued improvement. The present paper aims to remedy this situation by explaining extremization with the aid of a theoretically based estimator, namely the oracular aggregator.
3. THE GAUSSIAN PARTIAL INFORMATION MODEL
3.1 Motivating Examples
A central component of the partial information models is the structure of the information overlap that is assumed to hold among the individual forecasters. It therefore behooves us to begin with some simple examples to show that the optimal aggregate is not well defined without assumptions on the information structure among the forecasters.
Example 3.1.
Consider a basket containing a fair coin and a two-headed coin. Two forecasters are asked to predict whether a coin chosen at random is in fact two-headed. Before making their predictions, the forecasters observe the result of a single flip of the chosen coin. Suppose the flip comes out HEADS. Based on this observation, the correct Bayesian probability estimate is . If both forecasters see the result of the same coin flip, the optimal aggregate is again . On the other hand, if they observe different (conditionally independent) flips of the same coin, the optimal aggregate is .
In this example, it is not possible to distinguish between the two different information structures simply based on the given predictions, and neither nor can be said to be a better choice for the aggregate forecast. Therefore, we conclude that it is necessary to incorporate an assumption as to the structure of the information overlap, and that the details must be informed by the particular instance of the problem. The next example shows that even if the forecasters observe marginally independent events, further details in the structure of information can still greatly affect the optimal aggregate forecast.
Example 3.2.
Let be a probability space with eight points. Consider a measure that assigns probabilities , , and so forth. Define two events
Therefore, is the event that the first coordinate is or , and is the event that the first coordinate is or . Consider two forecasters and suppose Forecaster observes . Therefore the th Forecaster’s information set is given by the -field containing and its complement. Their -fields are independent. Now, let be the event that the second coordinate is 1. Forecaster 1 reports if occurs; otherwise, . Forecaster 2, on the other hand, reports if occurs; otherwise, . If is added to and but subtracted from and , the forecasts and do not change, nor does it change the fact that each of the four possible pairs of forecasts has probability . Therefore all observables are invariant under this perturbation. If Forecasters and report and , respectively, then the aggregator knows, by considering the intersection , that the first coordinate is . Consequently, the optimal aggregate forecast is , which is most definitely affected by the perturbation.
This example shows that the aggregation problem can be affected by the fine structure of information overlap. It is, however, unlikely that the structure can ever be known with the precision postulated in this simple example. Therefore it is necessary to make reasonable assumptions that yield plausible yet generic information structures.
3.2 Gaussian Partial Information Model
The central component of the Gaussian model is a pool of information particles. Each particle, which can be interpreted as representing the smallest unit of information, is either positive or negative. The positive particles provide evidence in favor of the event , while the negative particles provide evidence against . Therefore, if the overall sum (integral) of the positive particles is larger than that of the negative particles, the event happens; otherwise, it does not. Each forecaster, however, observes only the sum of some subset of the particles. Based on this sum, the forecaster makes a probability estimate for . This is made concrete in the following model that represents the pool of information with the unit interval and generates the information particles from a Gaussian process.
The Gaussian Model. Identify the pool of information with the unit interval . Consider a centered Gaussian process that is defined on a probability space and indexed by the Borel subsets such that . Such a process can be constructed, for example, by considering a standard Brownian motion process on , and defining as the variation of over . Let denote the event that the sum of all the information is positive: . For each , let be some Borel subset of , and define the corresponding -field as . Forecaster then predicts .
The Gaussian model can be motivated by recalling the interpreted signal model of Broomell and Budescu, (2009). They assume that Forecaster forms an opinion based on , where each is a linear function of observable quantities or cues that determine the outcome of . If the observables (or any linear combination of them) are independent and have small tails, then as , the joint distribution of the linear combinations will be asymptotically Gaussian. Therefore, given that the number of cues in a real-world setup is likely to be large, it makes sense to model the forecasters’ observations as jointly Gaussian. The remaining component, namely the covariance structure of the joint distribution is then motivated by the partial information framework. Of course, other distributions, such as the -distribution, could be considered. However, given that both the multivariate and conditional Gaussian distributions have simple forms, the Gaussian model offers potentially the cleanest entry into the issues at hand.
Overall, modeling the forecasters’ predictions with a Gaussian distribution is rather common. For instance, Di Bacco et al., (2003) consider a model of two forecasters whose estimated log-odds follow a joint Gaussian distribution. The predictions are assumed to be based on different information sets; hence, the model can be viewed as a partial information model. Unfortunately, as a specialization of the partial information framework, this model is a fairly narrow due to its detailed assumptions and extensive computations. The end result is a rather restricted aggregator of two probability forecasts. On the contrary, the Gaussian model sustains flexibility by specializing the framework only as much as is necessary. The following enumeration provides further interpretation and clarifies which aspects of the model are essential and which have little or no impact.
-
(i)
Interpretations. It is not necessary to assume anything about the source of the information. For instance, the information could stem from survey research, records, books, interviews, or personal recollections. All these details have been abstracted away.
-
(ii)
Information Sets. The set holds the information used by Forecaster , and the covariance represents the information overlap between Forecasters and . Consequently, the complement of holds information not used by Forecaster . No assumption is necessary as to whether this information was unknown to Forecaster instead of known but not used in the forecast.
-
(iii)
Pool of Information. First, the pool of information potentially available to the forecasters is the white noise on . The role of the unit interval is for the convenient specification of the sets . The exact choice is not relevant, and any other set could have been used. The unit interval, however, is a natural starting point that links the information structure to many known results in combinatorics and geometry (see, e.g., Proposition 3.3). Second, there is no sense of time or ranking of information within the pool. Instead, the pool is a collection of information, where each piece of information has an a priori equal chance to contribute to the final outcome. Quantitatively, information is parametrized by the length measure on .
-
(iv)
Invariant Transformations. From the empirical point of view, the exact identities of the individual sets are irrelevant. All that matters are the covariances . The explicit sets are only useful in the analysis, e.g., when computing the oracular aggregator.
-
(v)
Scale Invariance. The model is invariant under rescaling, replacing by and by . Therefore, the actual scale of the model (e.g., the fact that the covariances of the variables are bounded by one) is not relevant.
-
(vi)
Specific vs. General Model. A specific model requires a choice of an event and Borel sets . This might be done in several ways: a) by choosing them in advance, according to some criterion; b) estimating the parameters , , and from data; or c) using a Bayesian model with a prior distribution on the unknown parameters. This paper focuses mostly on a) and b) but discusses c) briefly in Section 6. Section 4 provides one result, namely Proposition 4.2 that holds for any (nonrandom) choices of the sets .
-
(vii)
Choice of Target Event. There is one substantive assumption in this model, namely the choice of the half-space for the event . Choosing for some makes the prior probability equal to . The current paper defers the analysis of to future work and focuses on the centered model for simplicity. Furthermore, choosing implies a prior probability , which seems as uninformative as possible and therefore provides a natural starting point. Note that specifying a prior distribution for cannot be avoided as long as the model depends on a probability space. This includes essentially any probability model for forecast aggregation.
3.3 Preliminary Observations
The Gaussian process exhibits additive behavior that aligns well with the intuition of an information pool. To see this, consider a finite partition of the full information . Each subset represents a set of information particles such that and . Therefore can be regarded as the sum of the particles in the subset , and different ’s relate to each other in a manner that is consistent with this interpretation.
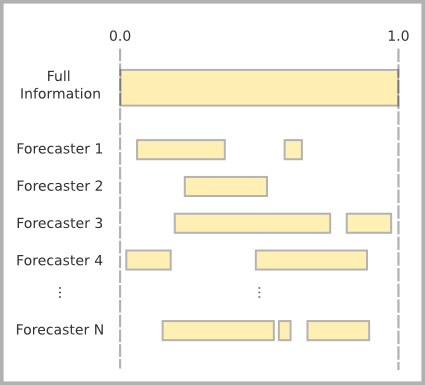
The relations among the relevant variables are summarized by a multivariate Gaussian distribution:
| (7) |
where is the amount of information used by Forecaster , and is the amount of information overlap between Forecasters and . One possible instance of this setup is illustrated in Figure 1. Note that does not have to be a contiguous subset of . Instead, each forecaster can use any Borel measurable subset of the full information.
Under the Gaussian model, the sub-matrix is sufficient for the information structure. Therefore the exact identities of the Borel sets do not matter, and learning about the information among the forecasters is equivalent to estimating a covariance matrix under several restrictions. In particular, if the information in can be translated into a diagram such as Figure 1, the matrix is called coherent. This property is made precise in the following proposition. The proof of this and other propositions are deferred to Appendix A of the Supplementary Material.
Proposition 3.3.
The overlap structure is coherent if and only if , where denotes the convex hull and is known as the correlation polytope. It is described by vertices in dimension .
The correlation polytope has a very complex description in terms of half-spaces. In fact, complete descriptions of the facets of are only known for and conjectured for and (Ziegler,, 2000). Fortunately, previous literature has introduced both linear and semidefinite relaxations of (Laurent et al.,, 1997). Such relaxations together with modern optimization techniques and sufficient data can be used to estimate the information structure very efficiently. This, however, is not in the scope of this paper and is therefore left for subsequent work.
The multivariate Gaussian distribution (7) relates to the forecasts by
| (8) |
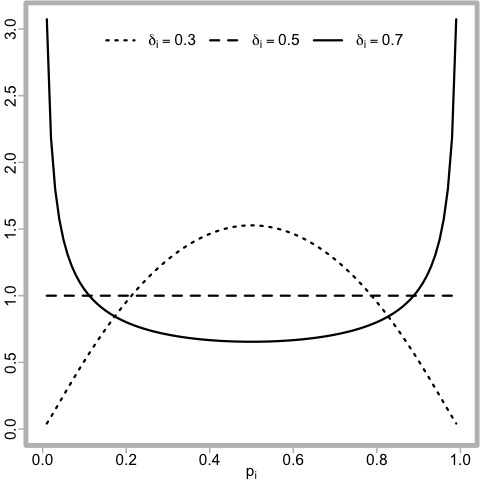
The marginal density of ,
has very intuitive behavior: it is uniform on if , but becomes unimodal with a minimum (maximum) at when (). As , converges to a point mass at . On the other hand, as , converges to a correct forecast whose distribution has atoms of weight at zero and one. Therefore a forecaster with no information “withdraws” from the problem by predicting a non-informative probability while a forecaster with full information always predicts the correct outcome with absolute certainty. Figure 2 illustrates the marginal distribution when is equal to , , and .
4. PROBABILITY EXTREMIZING
4.1 Oracular Aggregator for the Gaussian Model
Recall from Section 1.3 that the oracular aggregator is the conditional expectation of given all the forecasters’ information. Under the Gaussian model, this can be emulated with a hypothetical oracle forecaster whose information set is . The oracular aggregator is then nothing more than the probability forecast made by the oracle. That is,
where . Given that the oracle’s information set cannot be used to reconstruct the individual sets , some potentially relevant information may appear to have been lost. Under the Gaussian model, however, only the total variation over is relevant to aggregation. The next proposition shows that contains all the information in and hence leads to an actual oracular aggregator.
Proposition 4.1.
The event is conditionally independent of the collection given
The oracular aggregator provides a reference point that allows us to identify information structures under which other aggregation techniques perform relatively well. In particular, if an aggregator is likely to be near under a given , then that information structure reflects favorable conditions for the aggregator. This ideas is used in the following subsections to develop intuition about probability extremizing.
4.2 General Information Structure
A probability is said to be extremized by another probability if and only if is closer to zero when and closer to one when . This translates to the probit scores as follows: extremizes if and only if is on the same side but further away from zero than . The amount of (multiplicative) extremization can then be quantified with the probit extremization ratio defined as .
Given that no aggregator can improve upon the oracular aggregator, it provides an ideal reference point for analyzing extremization. This section specifically uses it to study extremizing of because a) it is arguably more reasonable than the simple average ; and b) it is very similar to but results in cleaner analytic expressions. Therefore, of particular interest is the special case , where . From now on, unless otherwise stated, this expression is referred simply with . Therefore, the probit opinion pool requires extremization if and only if , and the larger is, the more should be extremized.
Note that is a random quantity that spans the entire real line; that is, it is possible to find a set of forecasts and an information structure for any possible value of . Evidently, extremizing is not guaranteed to always improve . To understand when extremizing is likely to be beneficial, the following proposition provides the probability distribution of .
Proposition 4.2.
The law of the extremization ratio is a Cauchy with parameters and , where the location parameter is at least one, equality occurring only when for all . Consequently, if for some , then the probability that requires extremizing is strictly greater than .
This proposition shows that, on any non-trivial problem, a small perturbation in the direction of extremizing is more likely to improve than to degrade it. This partially explains why extremizing aggregators perform well on large sets of real-world prediction problems. It may be unsurprising after the fact, but the forecasting literature is still full of articles that perform probability averaging without extremizing. The next two subsections examine special cases in which more detailed computations can be performed.
4.3 Zero and Complete Information Overlap
If the forecasters use the same information, i.e., for all , their forecasts are identical, , and no extremization is needed. Therefore, given that the oracular aggregator varies smoothly over the space of information structures, averaging techniques, such as , can be expected to work well when the forecasts are based on very similar sources of information. This result is supported by the fact that the measurement error framework, which essentially describes the forecasters as making numerous small mistakes while applying the same procedure to the same data (see Section 2.2), results in averaging-based aggregators.
If, on the other hand, the forecasters have zero information overlap, i.e., for all , the information structure is diagonal and
where the identities and result from the additive nature of the Gaussian process (see Section 3.3). This aggregator can be described in two steps: First, the numerator conducts voting, or range voting to be more specific, where the votes are weighted according to the importance of the forecasters’ private information. Second, the denominator extremizes the consensus according to the total amount of information in the group. This clearly leads to very extreme forecasts. Therefore more extreme techniques can be expected to work well when the forecasters use widely different information sets.
The analysis suggests a spectrum of aggregators indexed by the information overlap: the optimal aggregator undergoes a smooth transformation from averaging (low extremization) to voting (high extremization) as the information overlap decreases from complete to zero overlap. This observation gives qualitative guidance in real-world settings where the general level of overlap can be said to be high or low. For instance, predictions from forecasters working in close collaboration can be averaged while predictions from forecasters strategically accessing and studying disjoint sources of information should be aggregated via more extreme techniques such as voting. See Parunak et al., 2013 for a discussion of voting-like techniques. For a concrete illustration, recall Example 3.1 where the optimal aggregate changes from (high information overlap) to (low information overlap).
4.4 Partial Information Overlap
To analyze the intermediate scenarios with partial information overlap among the forecasters, it is helpful to reduce the number of parameters in . A natural approach is to assume compound symmetry, where the information sets have the same size and that the amount of pairwise overlap is constant. More specifically, let and , where is the amount of information used by each forecaster and is the overlapping proportion of this information. The resulting information structure is , where is the identity matrix and is matrix of ones. It is coherent if and only if
| (9) |
See Appendix A of the Supplementary Material for the derivation of these constraints.
Under these assumptions, the location parameter of the Cauchy distribution of simplifies to .
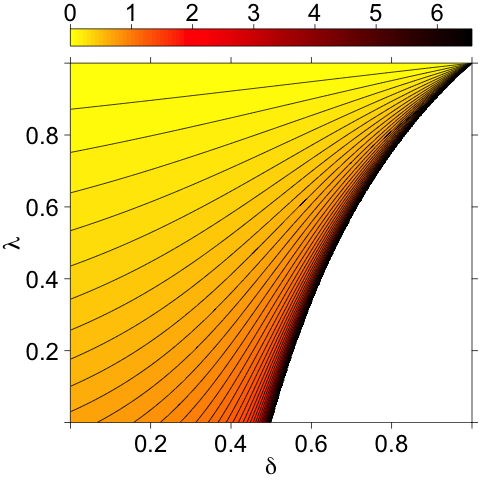
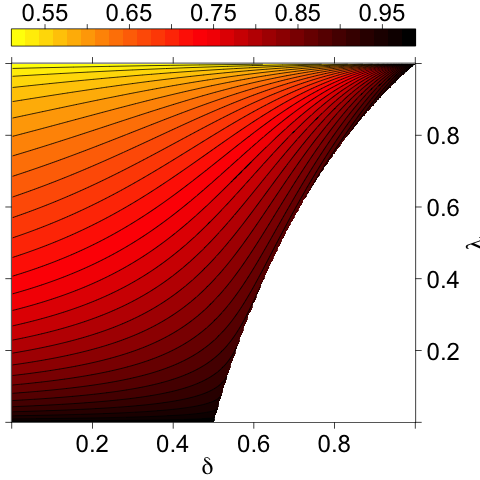
Of particular interest is to understand how this changes as a function of the model parameters. The analysis is somewhat hindered by the unknown details of the dependence between and the other parameters , , and . However, given that is defined as , its value increases in and but decreases in . In particular, as , the value of converges to one at least as fast as because . Therefore the term and, consequently, increase in . Similarly, can be shown to increase in but to decrease in . Therefore and move together, and the amount of extremizing can be expected to increase in . As the Cauchy distribution is symmetric around , the probability behaves similarly to and also increases in . Figure 3 illustrates these relations by plotting both and for forecasters under all plausible combinations of and . The white space collects all pairs that do not satisfy (9) and hence represent incoherent information structures. Note that the results are completely general for the two-forecaster case, apart from the assumption . Relaxing this assumption does not change the qualitative nature of the results.
The total amount of information used by the forecasters , however, does not provide a full explanation of extremizing. Information diversity is an important yet separate determinant. To see this, observe that fixing to some constant defines a curve on the two plots in Figure 3. For instance, letting gives the boundary curve on the right side of each plot. This curve then shifts inwards and rotates slightly counterclockwise as decreases. At the top end of each curve all forecasters use the total information, i.e., and . At the bottom end, on the other hand, the forecasters partition the total information and have zero overlap, i.e., and . Given that moving down along these curves simultaneously increases information diversity and , both information diversity and the total amount of information used by the forecasters are important yet separate determinants of extremizing. This observation can guide practitioners towards proper extremization because many application specific aspects are linked to these two determinants. For instance, extremization can be expected to increase in the number of forecasters, subject-matter expertise, and human diversity, but to decrease in collaboration, sharing of resources, and problem difficulty.
5. PROBABILITY AGGREGATION
5.1 Revealed Aggregator for the Gaussian Model
Recall the multivariate Gaussian distribution (7) and collect all into a column vector . If is a coherent overlap structure and exists, then the revealed aggregator under the Gaussian model is
| (10) |
Applying (10) in practice requires an estimate of . If the forecasters make predictions about multiple events, it may be possible to model the different prediction tasks with a hierarchical structure and estimate a fully general form of . This can be formulated as a constrained (semi-definite) optimization problem, which, as was mentioned in Section 3.3, is left for subsequent work. Such estimation, however, requires the results of a large multi-prediction experiment which may not always be possible in practice. Often only a single prediction per forecaster is available. Consequently, accurate estimation of the fully general information structure becomes difficult. This motivates the development of aggregation techniques for a single event. Under the Gaussian model, a standard approach is to assume a covariance structure that involves fewer parameters. The next subsection discusses a natural and non-informative choice.
5.2 Symmetric Information
This subsection assumes a type of exchangeability among the forecasters. While this is somewhat idealized, it is a reasonable choice in a low-information environment where there is no historical or self-report data to distinguish the forecasters. The averaging aggregators described in Section 2, for instance, are symmetric. Therefore, to the extent that they reflect an underlying model, the model assumes exchangeability. Under the Gaussian model, exchangeability suggests the compound symmetric information structure discussed in Section 4.4. This structure holds if, for example, the forecasters use information sources sampled from a common distribution. The resulting revealed aggregator takes the form
| (11) |
where for all .
Given these interpretations, it may at first seem surprising that the values of and can be estimated in practice. Intuitively, the estimation relies on two key aspects of the model: a) a better-informed forecast is likely to be further away from the non-informative prior (see Figure 2); and b) two forecasters with high information overlap are likely to report very similar predictions. This provides enough leverage to estimate the information structure via the maximum likelihood method. Complete details for this are provided in Appendix B of the Supplementary Material. Besides exchangeability, is based on very different modeling assumptions than the averaging aggregators. The following proposition summarizes some of its key properties.
Proposition 5.1.
-
The probit extremization ratio between and is given by the non-random quantity , where ,
-
extremizes as long as for some , and
-
can leave the convex hull of the individual probability forecasts.
Proposition 5.1 suggests that is appropriate for combining probability forecasts of a single event. This is illustrated on real-world forecasts in the next subsection. The goal is not to perform a thorough data analysis or model evaluation, but to demonstrate on a simple example.
5.3 Real-World Forecasting Data
Probability aggregation appears in many facets of real-world applications, including weather forecasting, medical diagnosis, estimation of credit default, and sports betting. This section, however, focuses on predicting global events that are of particular interest to the Intelligence Advanced Research Projects Activity (IARPA). Since 2011, IARPA has posed about 100-150 question per year as a part of its ACE forecasting tournament. Among the participating teams, the Good Judgment Project (GJP) (Ungar et al., 2012; Mellers et al., 2014) has emerged as the clear winner. The GJP has recruited thousands of forecasters to estimate probabilities of the events specified by IARPA. The forecasters are told that their predictions are assessed using the Brier score (see Section 1.2). In addition to receiving $150 for meeting minimum participation requirements that do not depend on prediction accuracy, the forecasters receive status rewards for good performance via leader-boards displaying Brier scores for the top 20 forecasters. Every year the top 1% of the forecasters are selected to the elite group of “super-forecasters”. Note that, depending on the details of the reward structure, such a competition for rank may eliminate the truth-revelation property of proper scoring rules (see, e.g., Lichtendahl Jr and Winkler, 2007).
This subsection focuses on the super-forecasters in the second year of the tournament. Given that these forecasters were elected to the group of super-forecasters based on the first year, their forecasts are likely, but not guaranteed, to be relatively good. The group involves 44 super-forecasters collectively making predictions about 123 events, of which 23 occurred. For instance, some of the questions were: “Will France withdraw at least 500 troops from Mali before 10 April 2013?”, and “Will a banking union be approved in the EU council before 1 March 2013?”. Not every super-forecaster made predictions about every event. In fact, the number of forecasts per event ranged from 17 to 34 forecasts, with a mean of 24.2 forecasts. To avoid infinite log-odds and probit scores, extreme forecasts and were censored to and , respectively.
In this section aggregation is performed one event at a time without assuming any other information besides the probability forecasts themselves. This way any performance improvements reflect better fit of the underlying model and the aggregator’s relative advantage in forecasting a single event. Aggregation accuracy is measured with the mean Brier score (BS): Consider events and collect all probability forecasts for event into a vector . Then, BS for aggregator is
| BS |
This score is defined on the unit interval with lower values indicating higher accuracy. For a more detailed performance analysis, it decomposes into three additive components: reliability (REL), resolution (RES), and uncertainty (UNC). This assumes that the aggregate forecast for all can only take discrete values with . Let be the number of times occurs, and denote the empirical frequency of the corresponding events with . Let be the overall empirical frequency of occurrence, i.e., . Then,
| BS | |||
In this decomposition low REL represents good calibration. If a calibrated aggregate is also confident, it exhibits high RES. Therefore the combination of good calibration and high confidence leads to low BS. The corresponding forecasts are likely to be very close to and , which is more useful to the decision-maker than the naive forecast . The final term UNC equals the BS for and hence provides a reference point for interpreting the performance of the aggregator.
| Aggregator | BS | REL | RES | UNC |
|---|---|---|---|---|
| 0.132 | 0.026 | 0.045 | 0.152 | |
| 0.128 | 0.025 | 0.048 | 0.152 | |
| 0.128 | 0.023 | 0.047 | 0.152 | |
| 0.123 | 0.020 | 0.049 | 0.152 |
Table 1 presents results for , , , and under the super-forecaster data. Empirical approaches were not considered for two reasons: a) they do not reflect an actual model of forecasts; and b) they require a training set with known outcomes and hence cannot be applied to a single event. Overall, presents the worst performance. Given that and are very similar, it is not surprising that they have almost identical scores. The revealed aggregator is both the most resolved and calibrated, thus achieving the lowest BS among all the aggregators. This is certainly an encouraging result. It is important to note that is only the first attempt at partial information aggregation. More elaborate information structures and estimation procedures, such as shrinkage estimators, are very likely to lead to many further improvements.
6. SUMMARY AND DISCUSSION
This paper introduced a probability model for predictions made by a group of forecasters. The model allows for interpretation of some of the existing work on forecast aggregation and also clarifies empirical approaches such as the ad hoc practice of extremization. The general model is more plausible on the micro-level than any other model has been to date. Under this model, some general results were provided. For instance, the oracular aggregate, which uses all the forecasters’ information (Proposition 4.1), is more likely to be more extreme than one of the common benchmark aggregates, namely (Proposition 4.2). Even though no real world aggregator has access to all the information of the oracle, this result explains why extremization is almost certainly called for. More detailed analyses were performed under several specific model specifications such as zero and complete information overlap (Section 4.3), and fully symmetric information (Section 4.4). Even though the zero and complete information overlap models are not realistic, except under a very narrow set of circumstances, they form logical extremes that illustrate the main drivers of good aggregation. The symmetric model is somewhat more realistic. It depends only on two parameters and therefore allows us to visualize the effect of model parameters on the optimal amount of extremization (Figure 3). Finally, the revealed aggregator, which is the best in-practice aggregation under the partial information model, was discussed. The discussion provided a general formula for this aggregator (Equation 10) as well as its specific formula under symmetric information (Equation 11). The specific form was applied to real-world forecasts of one-time events and shown to outperform other model-based aggregators.
It is interesting to relate our discussion to the many empirical studies conducted by the Good Judgment Project (GJP) (see Section 5.3). Generally extremizing has been found to improve the average aggregates (Mellers et al.,, 2014; Satopää et al., 2014a, ; Satopää et al., 2014b, ). The average forecast of a team of super-forecasters, however, often requires very little or no extremizing. This can be explained as follows. The super-forecasters are highly knowledgeable (high ) individuals who work in groups (high and ). Therefore, in Figure 3 they are situated around the upper-right corners where almost no extremizing is required. In other words, there is very little left-over information that is not already used in each forecast. Their forecasts are highly convergent and are likely to be already very near the oracular forecast. The GJP forecast data also includes self-assessments of expertise. Not surprisingly, the greater the self-assessed expertise, the less extremizing appears to have been required. This is consistent with our interpretation that high values of and suggest lower extremization.
The partial information framework offers many directions for future research. One involves estimation of parameters. In principle, can be estimated from the distribution of a reasonably long probability stream. Similarly, can be estimated from the correlation of the two parallel streams. Estimation of higher order intersections, however, seems more dubious. In some cases the higher order intersections have been found to be irrelevant to the aggregation procedure. For instance, DeGroot and Mortera, (1991) show that it is enough to consider only the pairwise conditional (on the truth) distributions of the forecasts when computing the optimal weights for a linear opinion pool. Theoretical results on the significance or insignificance of higher order intersections under the partial information framework would be desirable.
Another promising avenue is the Bayesian approach. In many applications with small or moderately sized datasets, Bayesian methods have been found to be superior to the likelihood-based alternatives. Therefore, given that the number of forecasts on a single event is typically quite small, a Bayesian approach is likely to improve the predictions of one-time events. Currently, we have work in progress analyzing a Bayesian model but there are many, many reasonable priors on the information structures. This avenue should certainly be pursued further, and the results tested against other high performing aggregators.
7. SUPPLEMENTARY MATERIALS
REFERENCES
- Armstrong, (2001) Armstrong, J. S. (2001). Combining forecasts. In Armstrong, J. S., editor, Principles of Forecasting: A Handbook for Researchers and Practitioners, pages 417–439. Kluwer Academic Publishers, Norwell, MA.
- Baron et al., (2014) Baron, J., Mellers, B. A., Tetlock, P. E., Stone, E., and Ungar, L. H. (2014). Two reasons to make aggregated probability forecasts more extreme. Decision Analysis, 11(2):133–145.
- Broomell and Budescu, (2009) Broomell, S. B. and Budescu, D. V. (2009). Why are experts correlated? Decomposing correlations between judges. Psychometrika, 74(3):531–553.
- Dawid et al., (1995) Dawid, A., DeGroot, M., and Mortera, J. (1995). Coherent combination of experts’ opinions (with discussion). TEST, 4(2):263–313.
- Dawid, (1982) Dawid, A. P. (1982). The well-calibrated bayesian. Journal of the American Statistical Association, 77(379):605–610.
- DeGroot, (1988) DeGroot, M. H. (1988). A bayesian view of assessing uncertainty and comparing expert opinion. Journal of statistical planning and inference, 20(3):295–306.
- DeGroot and Mortera, (1991) DeGroot, M. H. and Mortera, J. (1991). Optimal linear opinion pools. Management Science, 37(5):546–558.
- Di Bacco et al., (2003) Di Bacco, M., Frederic, P., and Lad, F. (2003). Learning from the probability assertions of experts. Research Report. Available at: http://www.math.canterbury.ac.nz/research/ucdms2003n6.pdf.
- Erev et al., (1994) Erev, I., Wallsten, T. S., and Budescu, D. V. (1994). Simultaneous over- and underconfidence: The role of error in judgment processes. Psychological Review, 101(3):519–527.
- Foster and Vohra, (1998) Foster, D. P. and Vohra, R. V. (1998). Asymptotic calibration. Biometrika, 85(2):379–390.
- Hong and Page, (2009) Hong, L. and Page, S. (2009). Interpreted and generated signals. Journal of Economic Theory, 144(5):2174–2196.
- Hwang and Pemantle, (1997) Hwang, J. and Pemantle, R. (1997). Estimating the truth of an indicator function of a statistical hypothesis under a class of proper loss functions. Statistics & Decisions, 15:103–128.
- Jolliffe and Stephenson, (2012) Jolliffe, I. T. and Stephenson, D. B. (2012). Forecast verification: a practitioner’s guide in atmospheric science. John Wiley & Sons.
- Karmarkar, (1978) Karmarkar, U. S. (1978). Subjectively weighted utility: A descriptive extension of the expected utility model. Organizational Behavior and Human Performance, 21(1):61–72.
- Lai et al., (2011) Lai, T. L., Gross, S. T., Shen, D. B., et al. (2011). Evaluating probability forecasts. The Annals of Statistics, 39(5):2356–2382.
- Laurent et al., (1997) Laurent, M., Poljak, S., and Rendl, F. (1997). Connections between semidefinite relaxations of the max-cut and stable set problems. Mathematical Programming, 77(1):225–246.
- Lichtendahl Jr and Winkler, (2007) Lichtendahl Jr, K. C. and Winkler, R. L. (2007). Probability elicitation, scoring rules, and competition among forecasters. Management Science, 53(11):1745–1755.
- Mellers et al., (2014) Mellers, B., Ungar, L., Baron, J., Ramos, J., Gurcay, B., Fincher, K., Scott, S. E., Moore, D., Atanasov, P., Swift, S. A., Murray, T., Stone, E., and Tetlock, P. E. (2014). Psychological strategies for winning a geopolitical forecasting tournament. Psychological Science, 25(5):1106–1115.
- Murphy and Winkler, (1987) Murphy, A. H. and Winkler, R. L. (1987). A general framework for forecast verification. Monthly Weather Review, 115(7):1330–1338.
- Parunak et al., (2013) Parunak, H. V. D., Brueckner, S. A., Hong, L., Page, S. E., and Rohwer, R. (2013). Characterizing and aggregating agent estimates. In Proceedings of the 2013 International Conference on Autonomous Agents and Multi-agent Systems, pages 1021–1028, Richland, SC. International Foundation for Autonomous Agents and Multiagent Systems.
- Ranjan and Gneiting, (2010) Ranjan, R. and Gneiting, T. (2010). Combining probability forecasts. Journal of the Royal Statistical Society: Series B (Statistical Methodology), 72(1):71–91.
- (22) Satopää, V. A., Baron, J., Foster, D. P., Mellers, B. A., Tetlock, P. E., and Ungar, L. H. (2014a). Combining multiple probability predictions using a simple logit model. International Journal of Forecasting, 30(2):344–356.
- (23) Satopää, V. A., Jensen, S. T., Mellers, B. A., Tetlock, P. E., Ungar, L. H., et al. (2014b). Probability aggregation in time-series: Dynamic hierarchical modeling of sparse expert beliefs. The Annals of Applied Statistics, 8(2):1256–1280.
- Shlomi and Wallsten, (2010) Shlomi, Y. and Wallsten, T. S. (2010). Subjective recalibration of advisors’ probability estimates. Psychonomic Bulletin & Review, 17(4):492–498.
- Ungar et al., (2012) Ungar, L., Mellers, B., Satopää, V., Tetlock, P., and Baron, J. (2012). The good judgment project: A large scale test of different methods of combining expert predictions. The Association for the Advancement of Artificial Intelligence Technical Report FS-12-06.
- Ziegler, (2000) Ziegler, G. M. (2000). Lectures on 0/1-polytopes. In Kalai, G. and Ziegler, G. M., editors, Polytopes - Combinatorics and Computation, volume 29, pages 1–41, Basel. Springer, Birkhäuser.