Reverberation Measurements of the Inner Radius of the Dust Torus in 17 Seyfert Galaxies
Abstract
We present the results of a dust reverberation survey for 17 nearby Seyfert 1 galaxies, which provides the largest homogeneous data collection for the radius of the innermost dust torus. A delayed response of the -band light curve after the -band light curve was found for all targets, and 49 measurements of lag times between the flux variation of the dust emission in the band and that of the optical continuum emission in the band were obtained by the cross-correlation function analysis and also by an alternative method for estimating the maximum likelihood lag. The lag times strongly correlated with the optical luminosity in the luminosity range of to mag, and the regression analysis was performed to obtain the correlation assuming , which was theoretically expected. We discuss the possible origins of the intrinsic scatter of the dust lag-luminosity correlation, which was estimated to be approximately dex, and we find that the difference of internal extinction and delayed response of changes in lag times to the flux variations could have partly contributed to intrinsic scatter. However, we could not detect any systematic change of the correlation with the subclass of the Seyfert type or the Eddington ratio. Finally, we compare the dust reverberation radius with the near-infrared interferometric radius of the dust torus and the reverberation radius of broad Balmer emission lines. The interferometric radius in the band was found to be systematically larger than the dust reverberation radius in the same band by about a factor of two, which could be interpreted by the difference between the flux-weighted radius and the response-weighted radius of the innermost dust torus. The reverberation radius of the broad Balmer emission lines was found to be systematically smaller than the dust reverberation radius by about a factor of –, which strongly supports the unified scheme of the Seyfert type of active galactic nuclei (AGNs). Moreover, we examined the radius-luminosity correlations for the hard X-ray (– keV) and the [O IV] m emission-line luminosities, which would be applicable for obscured AGNs.
Subject headings:
dust, extinction — galaxies: active — galaxies: Seyfert — infrared: galaxies1. Introduction
An active galactic nucleus (AGN) is known as one of the most luminous populations in the Universe, and its enormous radiative energy is powered by mass accretion onto the supermassive black hole (SMBH). Many observations have indicated that an optically and geometrically thick torus consisting of gas and dust surrounds the SMBH and accretion disk (e.g., Telesco et al., 1984; Antonucci & Miller, 1985; Miller & Goodrich, 1990), which could be a gas reservoir for supplying accreting mass onto the accretion disk (e.g., Krolik & Begelman, 1988). This dust torus is regarded as a key structure for the unified scheme of AGNs, which explains differences between type-1 and type-2 AGNs with respect to the viewing angle and obscuration by the dust torus (e.g., Antonucci, 1993). In this scheme, type-1 AGNs with broad emission lines (BELs) are classified as type-2 AGNs if the broad emission-line region (BLR) is obscured by the dust torus.
The nature of the dust torus has been extensively investigated by observational and theoretical methods. The near-infrared continuum emission of type-1 AGNs is considered to be dominated by the thermal re-radiation of hot dust driven by the reprocessing of the ultraviolet (UV)–optical continuum emission from the accretion disk (e.g., Rees et al., 1969; Barvainis, 1987; Kobayashi et al., 1993; Landt et al., 2011). In addition, significant research has been conducted to explain the infrared spectral energy distribution (SED) of AGNs and to understand the dust torus structure (e.g., Pier & Krolik, 1992; Nenkova et al., 2002, 2008; Dullemond & van Bemmel, 2005; Schartmann et al., 2005, 2008; Hönig et al., 2006; Mor et al., 2009; Deo et al., 2011). However, since the apparent size of the dust torus is so compact, it has been almost impossible to resolve and examine the detailed structure of the dust torus directly by imaging observation.
Reverberation mapping observation provides a unique and important tool for investigating the structures of innermost dust tori (Clavel et al., 1989; Baribaud et al., 1992; Glass, 1992; Sitko et al., 1993; Oknyanskii, 1993; Nelson, 1996a; Oknyanskij et al., 1999; Nelson & Malkan, 2001; Oknyanskij & Horne, 2001; Glass, 2004; Lira et al., 2011; Pozo Nuñez et al., 2014). A time lag between the variation of optical flux originating in the accretion disk and that of near-infrared flux in the innermost dust torus can be interpreted as the light-travel time from the accretion disk to the dust torus, which corresponds to the radius of the innermost dust torus. The Multicolor Active Galactic Nuclei Monitoring (MAGNUM) project (Yoshii 2002; Yoshii, Kobayashi, & Minezaki 2003) conducted extensive monitoring observations in optical and near-infrared wavelengths for a number of type-1 AGNs to obtain precise estimates of the radius of the innermost dust torus. Indeed, lag times of weeks to months corresponding to – pc were obtained for several Seyfert galaxies from optical and near-infrared monitoring observations, in which a strong correlation between lag time and optical luminosity was found to be consistent with (Minezaki et al., 2004; Suganuma et al., 2004, 2006; Koshida et al., 2009). Moreover, Suganuma et al. (2006) reported that the dust lag placed an upper boundary on the lag of the BELs, which strongly supports the unified scheme of AGNs.
Recent advancement in infrared interferometry has enabled milliarcsecond-scale measurement of the dust tori for bright AGNs, which has become an important tool for studying the structure of the dust torus. Near-infrared interferometric observations have been applied to less than 10 type-1 AGNs for estimating the radius of the innermost dust torus (Swain et al., 2003; Kishimoto et al., 2009; Pott et al., 2010; Kishimoto et al., 2011; Weigelt et al., 2012). These radii were found to be scaled approximately as , and their values were found to be of the same order as the dust reverberation radii (Kishimoto et al., 2009, 2011).
Such luminosity correlation is expected from a model in which the dust temperature and the inner radius of the dust torus are determined by radiation equilibrium and sublimation of dust, respectively. Barvainis (1987) quantitatively estimated the inner radius of the dust torus by considering the wavelength-dependent absorption efficiency of dust grains, and Kishimoto et al. (2007) expressed dependency on dust grain size as
| (1) |
where , , and are the UV luminosity of the accretion disk, sublimation temperature of dust, and dust grain size, respectively. Although the previously observed luminosity dependency of the radius of the innermost dust torus is consistent with the theoretical expectation, Kishimoto et al. (2007) found that the innermost torus radii based on dust reverberation were systematically smaller than those based on the theoretical prediction of Equation (1), assuming K and m, by a factor of . They proposed that this discrepancy could be explained by a higher sublimation temperature or a larger grain size, although the former case would be disfavored by the near-infrared colors of AGNs. On the contrary, Kawaguchi & Mori (2010, 2011) developed a reverberation model for a clumpy dust torus considering the anisotropic illumination of the accretion disk. They presented that dust clouds could survive closer to the accretion disk on the equatorial plane than at the expected sublimation radius by assuming isotropic illumination, which could explain the dust lag discrepancy. They further reported that according to the model, the dust lag increases with the viewing angle of the dust torus, and they suggested that the difference in the viewing angle is primarily responsible for the scatter of the dust lag-luminosity correlation.
In this study, we present 49 measurements of lag time between optical and near-infrared light curves for 17 nearby AGNs obtained by the MAGNUM project, which is the largest collection of systematic survey data of dust reverberation. By estimating the radii of the innermost dust tori from the data, we discuss the structure of AGN dust tori. In Section 2, we describe the target AGNs and the procedures of observation, reduction, and photometry. In addition, we describe the subtraction of contaminated flux by the host-galaxy starlight and narrow emission lines for estimating the optical continuum emission from the accretion disk. In Section 3, we measure the lag time between optical and near-infrared flux variations by using cross-correlation function (CCF) analysis. In Section 4, we examine the lag-luminosity correlation and its scatter on the basis of our uniformly analyzed largest dust reverberation sample. In Section 5, we compare the structure around the BLR and the innermost dust torus determined by our reverberation results with those of near-infrared interferometry and BEL reverberation. In addition, we discuss the secondary dependence of the dust lag on the Seyfert subclass and the mass accretion rate. We summarize the results in Section 6. We assume the cosmology of km s-1 Mpc-1, , and according to Spergel et al. (2007) throughout this study.
2. Observations and Photometry
We briefly describe the procedures of observation, data reduction, photometry, and estimation of host-galaxy and narrow emission-line fluxes. These procedures follow those presented in previous studies (Suganuma et al., 2006; Koshida et al., 2009; Sakata et al., 2010).
2.1. Targets
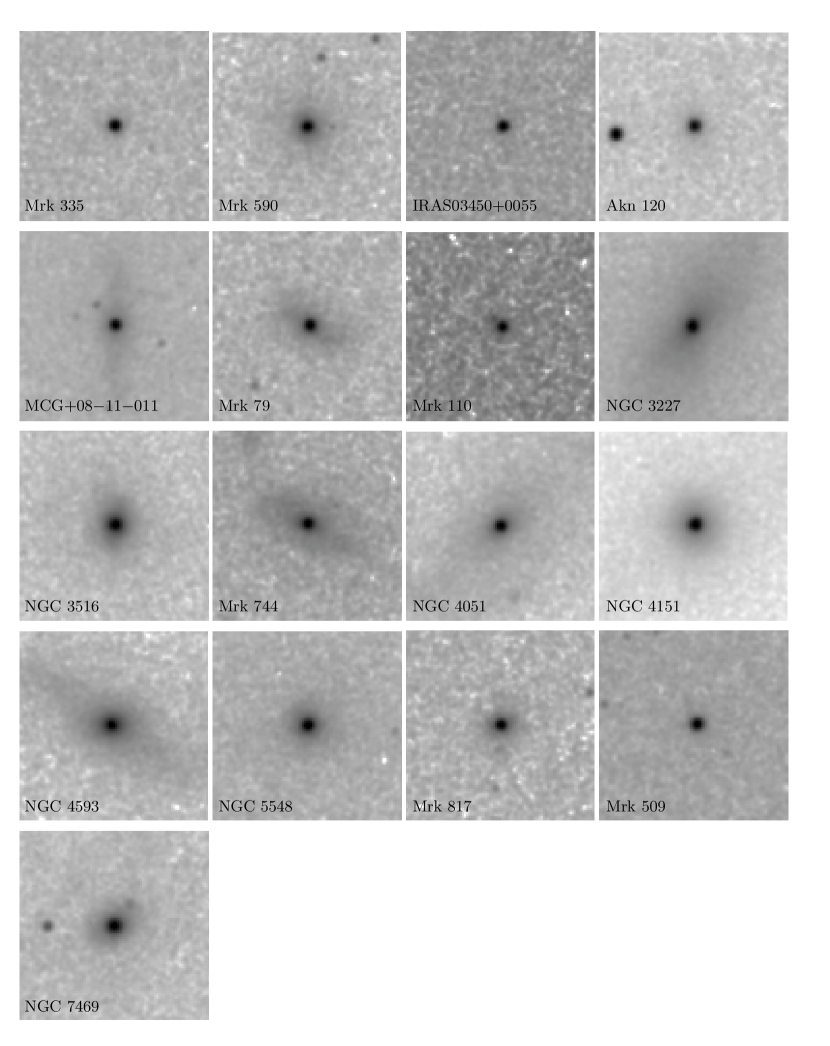
We focus on type-1 AGNs from the MAGNUM targets that exist in the local Universe with redshifts of less than 0.05. The target AGNs and their basic parameters are listed in Table Reverberation Measurements of the Inner Radius of the Dust Torus in 17 Seyfert Galaxies, and their portrait images are presented in Figure 1. Because these nearby Seyfert galaxies are less luminous, their timescales of flux variation are considered to be relatively short, and multiple features such as local peaks and valleys in the light curve enable the precise measurement of the lag times. In addition, their host-galaxy flux can be estimated by surface brightness fitting more reliably than that of distant quasi-stellar objects (QSOs). Of the 17 target AGNs, 14 were selected from the type-1 AGNs for which the BEL lag had been determined by reverberation mapping observations (Wandel et al., 1999; Onken et al., 2003; Denney et al., 2006); two targets, IRAS 034500055 and Mrk 744, were selected from those for which dust reverberation mapping observations had been performed (Nelson, 1996a, b); and the last target, MCG 08-11-011, was taken from Enya et al. (2002) for which large amplitudes of flux variation in near-infrared wavebands had been detected. The optical luminosity of the targets ranged from to after the host-galaxy flux was subtracted (see Section 2.4).
2.2. Observations
Monitoring observations were conducted by using the multicolor imaging photometer (MIP) mounted on the MAGNUM telescope (Kobayashi et al., 1998a, b). The MIP has a field-of-view of 1.51.5 arcmin2; it is capable of simultaneously obtaining images in optical (, , , , and ) and near-infrared (, , and ) bands by splitting the incident beam into two different detectors including an SITe CCD (10241024 pixels, 0.277 arcsec pixel-1) and an SBRC InSb array (256256 pixels, 0.346 arcsec pixel-1).
Observations were conducted most frequently in the and bands. The band aims to obtain optical continuum emission from the accretion disk, avoiding the contamination of variable BELs such as the Balmer series. On the contrary, the band aims to obtain reprocessed thermal emission of hot dust located at the innermost region of the dust torus, in which such thermal emission dominates over the power-law continuum emission from the accretion disk. In this study, we focus on the results derived from the light curves in these bands.
Monitoring observations with the MAGNUM telescope began in 2001–2003, although that for NGC 3516 and NGC 4593 began in 2005. We present the data obtained through 2006–2007 to include monitoring spans of 3–7 years. The typical monitoring intervals were configured to be shorter for less luminous targets for which shorter lag times were expected, and they were from a few days to 20 days. The observational parameters are listed in Table 2.
2.3. Reduction and Photometry
The images were reduced using IRAF 111IRAF is distributed by the National Optical Astronomy Observatories, which are operated by the Association of Universities for Research in Astronomy, Inc., under cooperative agreement with the National Science Foundation.. We followed the standard procedures for image reduction such as bias or sky subtraction and flat fielding, with small corrections applied for non-linear detector response.
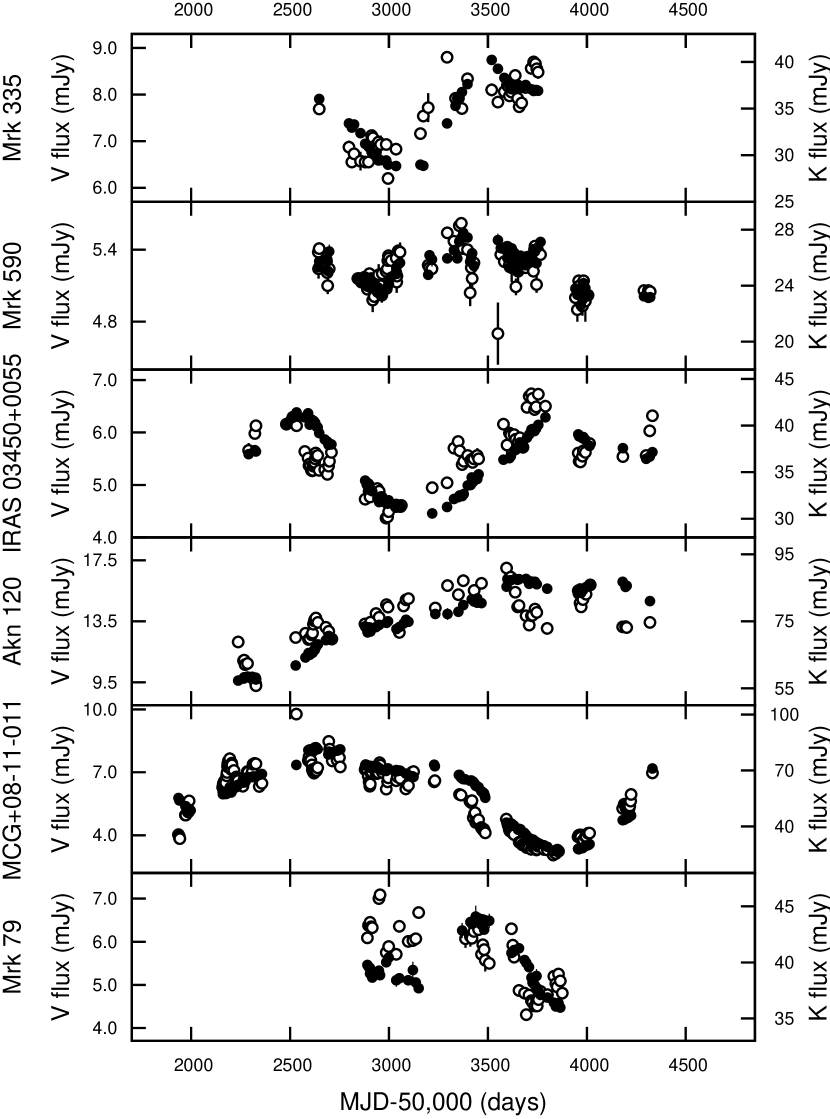
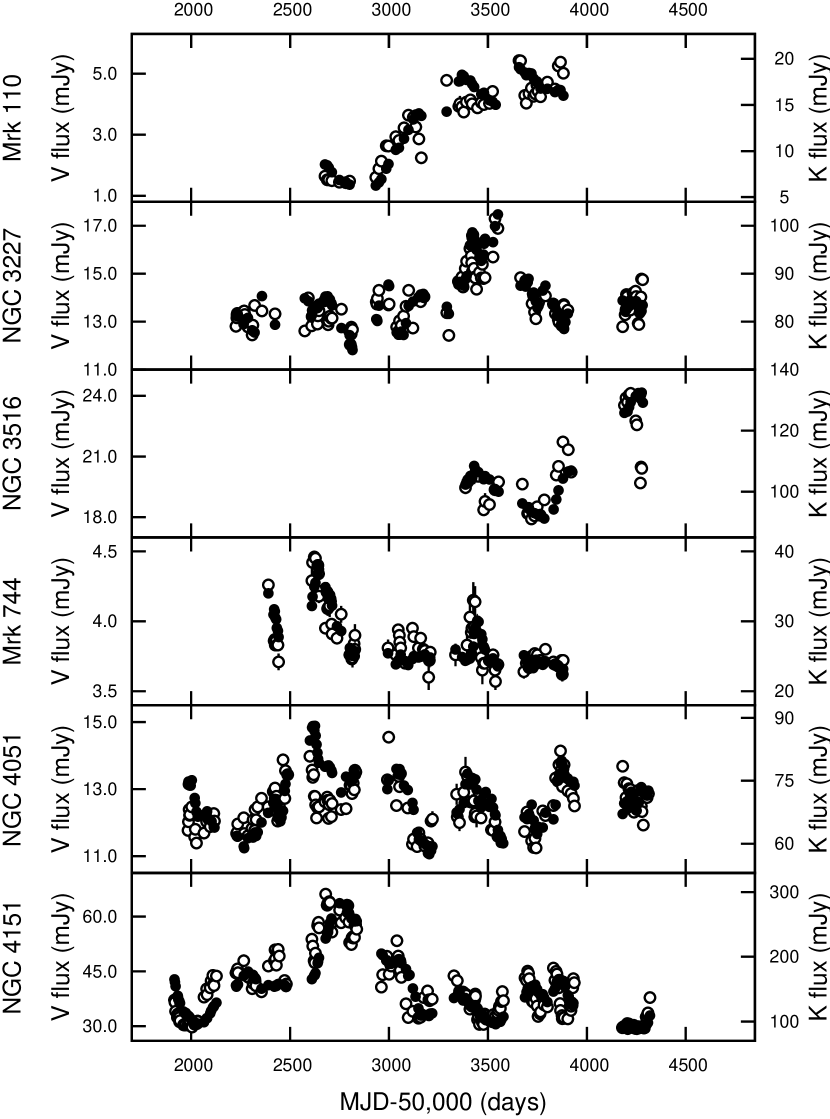
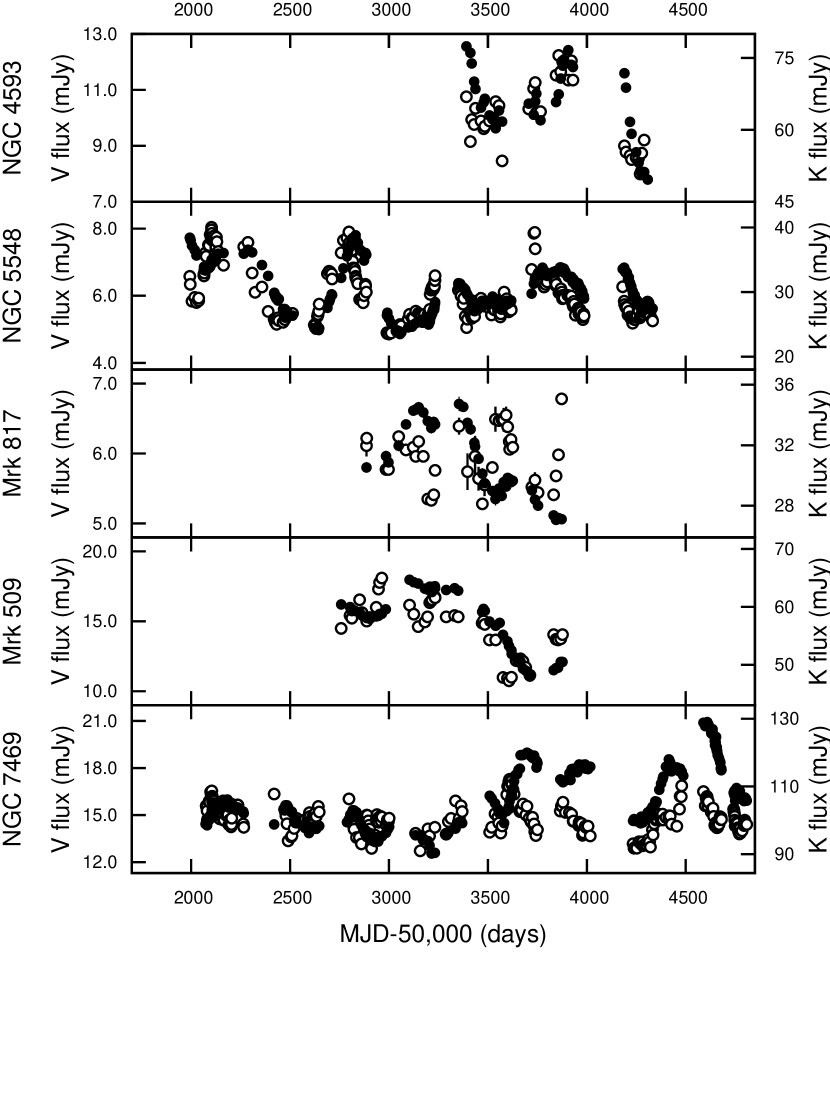
As shown in Figure 1, the MIP’s limited field-of-view prevented us from obtaining suitable stars for the reference of the point-spread function (PSF) shape and photometry in the same images as those of bright and extended targets. Therefore, we observed the target AGN and its reference stars alternately to measure the nuclear flux of the target with respect to these reference stars, and aperture photometry with a circular aperture of in diameter with a sky reference area of a annulus was applied instead of difference imaging photometries 222 We also note that the PSFs of the target image and the reference star image are slightly different because they were not simultaneously obtained, which makes it difficult to employ difference imaging photometries.. Although a relatively large aperture was selected to keep the photometry stable against the seeing variation, the photometric error of the nuclear flux relative to the reference stars was typically mag. The fluxes of the reference stars were calibrated with respect to photometric standard stars designated by Landolt (1992) and Hunt et al. (1998) for the and bands, respectively, and the errors in flux calibration were typically less than mag. The positions and magnitudes of the reference stars are listed in Table 3. The resultant light curves of the 17 target AGNs in the and bands are presented in Figures 2–4, and their data are listed in Table 4.
2.4. Subtraction of Host-Galaxy Flux
The flux obtained by aperture photometry contained a significant contribution of host-galaxy starlight and thus was subtracted. Nine of the 17 target AGNs are common to those of Sakata et al. (2010), who estimated the host-galaxy fluxes in the optical , , and bands within the same photometric aperture by surface brightness fitting to the high-resolution Hubble Space Telescope (HST) Advanced Camera for Surveys images as well as those obtained by MAGNUM. We adopted the same -band fluxes of host galaxies reported by Sakata et al. (2010) for these targets. In addition, we adopted the results by Suganuma et al. (2006), who estimated the host-galaxy flux of NGC 7469 in the band within the same photometric aperture.
For the remaining seven target AGNs, we estimated the host-galaxy flux in the band by surface brightness fitting in the same manner as that reported by Suganuma et al. (2006). We first selected the data obtained at night with good and stable seeing conditions, typically with a PSF full-width at half-maximum of less than 1.5 arcsec. All target AGN and reference-star images obtained during the same night were then combined into one image. The target AGN image was fitted by the GALFIT two-dimensional image decomposition program (Peng et al., 2002) with analytic functions for the galaxy component of bulge (de Vaucouleurs’ R1/4 profile) and disk (exponential profile), plus a PSF for the AGN nucleus, using the images of the reference stars simultaneously observed as the PSF reference. Finally, aperture photometry was applied to the nucleus-free image created by subtracting the best-fit PSF component from the original image. We adopted the average and scatter of the aperture fluxes of the nuclear-free images over the data obtained during various nights as the host-galaxy flux and its error.
For the host-galaxy fluxes in the band, we adopted the results of Minezaki et al. (2004) for NGC4151; those of Suganuma et al. (2006) for NGC 5548, NGC 4051, NGC 3227, and NGC 7469; those of Tomita et al. (2006) for MCG 08-11-011; and those of Tomita (2005) for IRAS 034500055, Akn 120. For the remaining 9 target AGNs, we estimated the host-galaxy flux in the band by surface brightness fitting in the same manner as that conducted for the band. The host-galaxy fluxes within the aperture and their errors are listed in Table Reverberation Measurements of the Inner Radius of the Dust Torus in 17 Seyfert Galaxies.
2.5. Subtraction of Narrow Emission-Line Flux
In addition to subtracting the contaminated flux of host-galaxy starlight, we subtracted the contribution of the two strong narrow emission lines, [O III] and , from the -band flux for estimating the flux of the optical continuum emission from the accretion disk. Sakata et al. (2010) estimated the contribution of the narrow emission lines in the band; therefore, we adopted their estimates for the nine common targets.
For the remaining eight target AGNs, we estimated the contribution of the narrow emission lines in the band in the same manner as that conducted by Sakata et al. (2010). The flux of [O III] was compiled from previous research (Boroson & Meyers, 1992; Whittle, 1992; Kaspi et al., 1996; Marziani et al., 2003; Schmitt et al., 2003; Kaspi et al., 2005), and the flux of [O III] was calculated by assuming a theoretical line ratio of [O III][O III] (Storey & Zeippen, 2000). We then estimated their flux contributions by convolving a narrow-line spectrum with the transmission curve of the -band filter. Following Sakata et al. (2010), we adopted % of the flux of the narrow-line component as its error. Contributions of the narrow emission lines are also listed in Table Reverberation Measurements of the Inner Radius of the Dust Torus in 17 Seyfert Galaxies.
3. Dust Reverberation Analysis
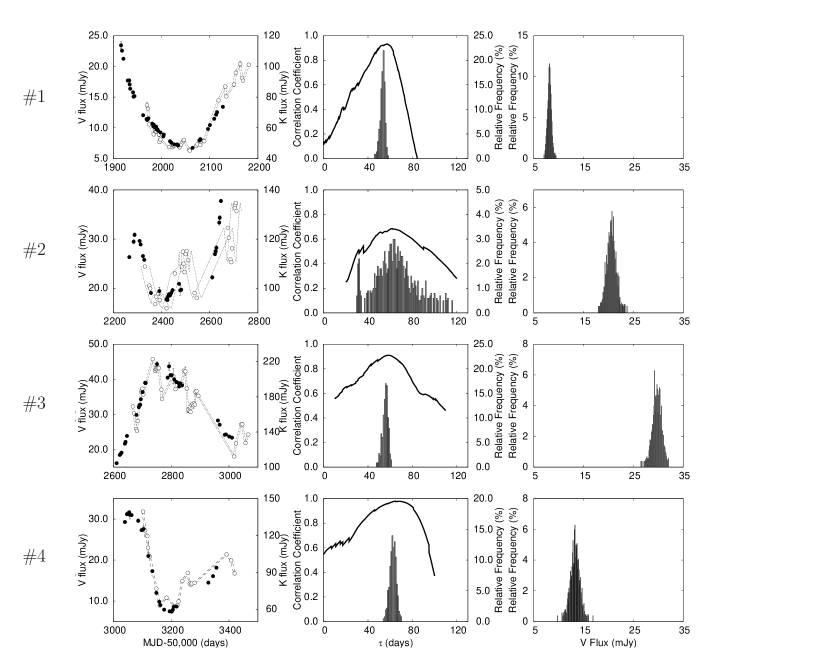
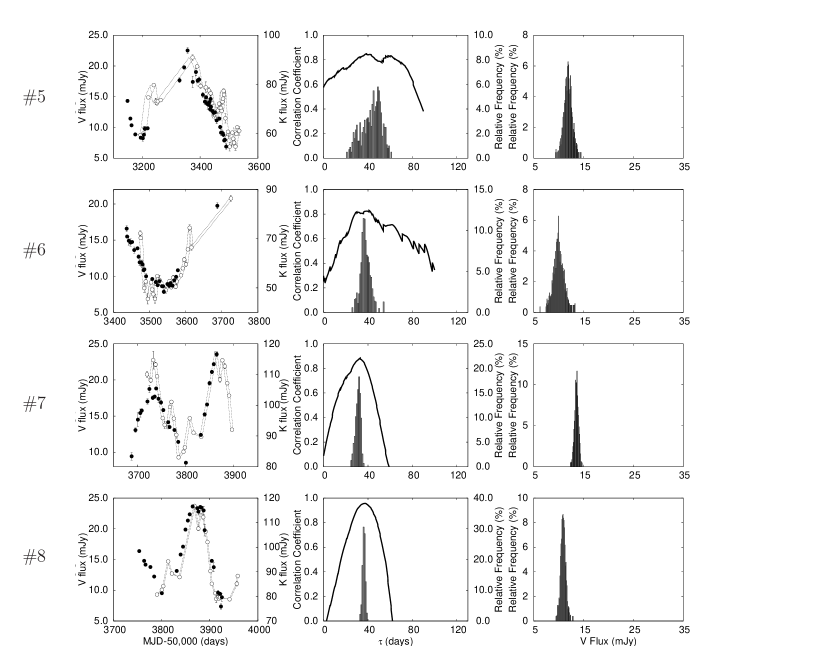
As presented in Figures 2–4, all targets showed significant flux variations in both bands and delayed responses of the -band light curve after that of the band, which indicate that the reprocessed thermal radiation of hot dust dominated in the -band flux.
In this section, we estimate the lag time between the - and -band light curves, which corresponds to the radius of the innermost dust torus, by using CCF analysis (White & Peterson, 1994; Peterson, 2001) as well as by an alternative method for estimating the maximum likelihood lag that was recently developed by Zu, Kochanek, & Peterson (2011).Following the method of Koshida et al. (2009), we first subtracted the accretion-disk component of flux in the band to derive the dust torus component, then we applied the CCF analysis and the alternative method to the -band light curve and that of the dust torus component in the band. In this study, we summarize only the procedures; details for the subtraction of the accretion-disk component and the CCF analysis have been reported in previous studies (Suganuma et al., 2006; Koshida et al., 2009), and those for the alternative method are described in Zu et al. (2011).
3.1. Subtraction of the Accretion-Disk Component from the K-Band Flux
Although the thermal radiation of the dust torus usually dominates in the -band flux of type-1 AGNs, it contains emission from the accretion disk (Tomita et al., 2006; Kishimoto et al., 2008; Lira et al., 2011). While the host-galaxy flux has no influence on CCF analysis because it is not variable, the superimposed flux variation by the accretion-disk component in the -band flux would make the lag time obtained by CCF analysis shorter than the actual lag of the dust-torus emission. Such a result occurs, because the power-law continuum emission from the accretion disk in the near-infrared spectra varies with time and is nearly synchronous with that in the optical (Tomita et al., 2006; Minezaki et al., 2006; Lira et al., 2011).
Therefore, we estimated the contribution of the accretion disk in the -band flux at a certain epoch, , and subtracted it from the observed -band flux prior to CCF analysis. In this study, was estimated from the -band flux by assuming a power-law spectrum of the accretion-disk emission as
| (2) |
where is the -band flux at the same epoch after the host-galaxy and narrow emission-line fluxes were subtracted; and are effective frequencies of the and bands, respectively; and is the power-law index. If no optical photometric data were available at the same epoch, was obtained by the linear interpolation of the photometric data observed at the closest epochs. Prior to the estimation and subsequent subtraction of the accretion-disk component, , the observed - and -band fluxes were corrected for the Galactic extinction according to the NASA/IPAC Extragalactic Database (NED; based on Schlegel et al., 1998).
The spectral shape of the flux variation of accretion-disk emission in optical and near-infrared wavelengths has not been well established. Tomita et al. (2006) applied the multiple regression analysis to the flux variations observed in optical and near-infrared wavebands of a Seyfert galaxy MCG 08–11–011 to estimate the power-law index of the accretion-disk component of the flux variation in optical and near-infrared spectra as to . From the same analysis applied to a number of nearby Seyfert galaxies by Tomita (2005), the value could be estimated as . According to the standard accretion model (Shakura & Sunyaev, 1973), the power-law index increases with wavelength and converges asymptotically on in the limit of long wavelength, and the power-law index of the flux variation would be the same in the long-wavelength limit when the standard accretion model is retained during flux variations. Wilhite et al. (2005) derived the composite differential spectrum of QSOs observed by the Sloan Digital Sky Survey and found that it could be fitted well by the power-law form of , although the wavelength range was UV to optical. Kishimoto et al. (2008) conducted spectropolarimetry for radio-loud and -quiet QSOs and obtained , although the observation was single epoch. From these considerations, we calculated assuming both and to examine a systematic difference in the dust lag estimation.
3.2. Measuring the Dust Lag by the CCF Analysis
After subtracting the accretion-disk component from the -band flux, we measured the lag time between the flux variation of the thermal emission from the dust torus in the band and that of the optical continuum emission from the accretion disk in the band. First, we applied widely used, conventional CCF methods that have been employed (White & Peterson, 1994; Peterson, 2001; Rafter et al., 2011; Barth et al., 2011a, b; Doroshenko et al., 2012; Edri et al, 2012; Grier et al., 2012a; Du et al., 2014). For comparison with our new results, the bi-directional interpolation (BI) method was adopted, which is the same method as that used in our previous studies (Suganuma et al., 2006; Koshida et al., 2009). The BI method is used to calculate the CCF of the light curves with irregular sampling obtained by monitoring observations, and it incorporates interpolation errors caused by the target’s flux variation, as is described subsequently.
With an arbitrary shift of time between the light curves in two different bands, , we generated the data pairs of fluxes whereby the flux in one band was obtained by actual observation and that in the other band was estimated by the linear interpolation of the light curve. Once the data pairs were produced for all observed data of both bands, a cross correlation for was calculated by using the set of data pairs. The CCF could then be calculated for any . Finally, the lag time was determined as the centroid around the peak of the CCF, , which was calculated by utilizing a part of the CCF near the peak with a value larger than 0.8 times the peak value of the CCF.
The uncertainty of the lag time was estimated by Monte Carlo simulation (Maoz & Netzer, 1989). A pair of artificial light curves was generated for the and bands, and the CCF was calculated to determine the centroid lag, . The cross-correlation centroid distribution (CCCD) was then derived from a large number of realizations of the simulation, and the uncertainty of the lag time was determined from the CCCD.
Artificial light curves were calculated by the flux randomization (FR) method (Peterson et al., 1998) combined with a method based on the structure function (SF), which simulates the flux variability between the observed data points (Suganuma et al., 2006). According to Gaussian distributions with standard deviations given by the flux-measurement errors for respective data points, the FR method randomly modifies the observed fluxes in each realization. The basic concept of simulating the flux uncertainty at interpolated data points caused by the variability in using SF is described in the following equation. Here, we define SF as
| (3) |
where is the flux at epoch , is the average of the observed flux errors of the pair, and is the number of data pairs; the sum is given by the overall pairs for which . According to this definition, can be interpreted as the standard deviation of flux variation between two observational epochs with a time interval of . Then, an artificial flux for an arbitrary epoch apart from actual observational epochs can be stochastically realized according to the Gaussian distribution, in which the standard deviation is given by . A detailed procedure for calculating the artificial light curve has been reported by Suganuma et al. (2006).
In Figure 5, the -band SF for NGC 4151 is presented as an example of the SF. The power-law form of was fitted in the range of the time interval between two times the median of the observational intervals and times the entire observation span, in which SF is considered to be significant (Collier & Peterson, 2001). The regression line of the power-law fitting for NGC 4151 is also presented in Figure 5, and the parameters of the power-law fitting of the SFs for all the 17 targets are listed in Table 6. Because the -band light curves were smooth and appeared to be well sampled, we applied the SF method described above only for the -band data (Koshida et al., 2009).
We conducted 1000 realizations of the Monte Carlo simulation for each target to obtain the CCCD. Realizations were omitted if the significance of the correlation coefficient at the CCF peak was less than or if the CCF showed a plateau or multiple peaks. Finally, the lag time of the flux variation of the dust-torus emission in the band after that of the emission from the accretion disk, , was estimated by a median of the CCCD, and its uncertainty was estimated by 34.1 percentiles in the upper and lower sides of the median of the CCCD.
As shown in Figures 2–4, multiple features in the light curves such as local peaks and valleys were apparent in several AGNs; we estimated their lag times at different epochs. We separated the entire monitoring period into several sections, each of which contained a small number of features of flux variation and more than 30 data pairs for sufficient calculation of significant CCFs. In Figures 6 and 7, CCFs and CCCDs for the individual light curve sections are presented for NGC 4151 as examples. As a result, 49 data of were obtained for the 17 target AGNs. The lag times and their errors for all measurements, in addition to the weighted averages of the lag times at different epochs for the individual targets, are listed in Table 7.
To compare the lag times , assuming and for subtracting the accretion-disk component in the -band flux, we plotted all 49 measurements of in Figure 8. The lag times in which was assumed and those in which was assumed strongly correlated, and the best fit linear regression for Figure 8 was . Therefore, the maximum systematic error for caused by the uncertainty of the spectral shape of the flux variation of accretion-disk emission in optical and near-infrared spectra for the subtraction of the accretion-disk component in the -band fluxes can be estimated as approximately 5%.
3.3. Measuring the Dust Lag by JAVELIN
Next, we applied an alternative method for measuring lag times developed by Zu et al. (2011), the JAVELIN software (formerly known as SPEAR), which is employed in recent reverberation studies (Grier et al., 2012a, b; Dietrich et al., 2012; Grier et al., 2013; Zhang, 2013a, b; Shapovalova et al., 2013). Its formalism was originally developed by Rybicki & Kleyna (1994) based on the studies of Press et al. (1992) and Rybicki & Press (1992), and has the advantage that the uncertainties in the interpolation of the light curve data and thus the statistical confidence limits on the lag time including them can be self-consistently estimated under a statistical model of variability.
JAVELIN adopts a damped random walk (DRW) model for flux variation of the UV-optical continuum emission, which has been demonstrated to be a good statistical model for AGN variability (e.g., Kelly et al., 2009; Kozłowski et al., 2010; MacLeod et al., 2010, 2012; Zu et al., 2013), and also assumes a top hat transfer function in the transfer equation of reverberation mapping. Then, it fits the continuum and response light curves using the Markov chain Monte Carlo (MCMC) method to obtain the likelihood distribution for the lag time as well as those for the two DRW model parameters for the continuum variability, the width of the transfer function, and the scaling coefficient that determines the response for a given change in the continuum.
The parameter values of the DRW model and their uncertainties are supplied to the lag-time fitting process as prior distributions, thus they are usually obtained from the continuum light curve before the lag-time fitting. In this study, we obtain lag times for separated monitoring sections, and each of them has less observational data points than those for the entire monitoring period. Therefore, we first obtained the best-fit values of the DRW model parameters from the entire -band light curve of each target, then we supplied those best-fit values with very small uncertainties to the lag-time fitting process as prior distributions, thus the DRW model parameters were effectively fixed to those values during the lag-time fitting process. This is a similar way to the SF parameters and the CCCD analysis as described in the previous subsection.
The resultant lag times obtained by JAVELIN are also listed in Table 7. In most cases, a single and unambiguous peak of the likelihood distribution for could be found. However, the likelihood distribution was sometimes not stable depending on the MCMC control parameters. Additionally, ambiguous multiple peaks sometimes appeared in the likelihood distribution, some of which might be regarded as a single but broad peak in the CCCD. As Zu et al. (2011) reported on an aliasing problem of JAVELIN, it tends to map the -band light-curve data into the sampling gaps of the -band light curve to decrease the data overlap, then poor light curve sampling would lead to those problems in the lag-time analysis.
In Figure 9, we plotted all 49 measurements of based on the two different methods and found that the lag time obtained by JAVELIN is generally in accordance with that obtained by the CCF analysis, although the scatter of the data points around the best fit regression is larger than that expected from their estimated errors. The best fit linear regressions for them are with an additional scatter of dex in both directions for the reduced to achieve unity, and with dex for and , respectively. Therefore, the systematic difference for between the two different lag analysis methods can be estimated as approximately 10%. In addition, as will be presented in the next section, the scatter around the dust lag-luminosity correlation for is as much as that for . By these considerations, we use the data obtained by using JAVELIN as well as those obtained by using the CCF analysis in the subsequent discussions, although the data plots are represented by for clarity.
4. Lag-Luminosity Correlation for the Dust Torus
We present 49 measurements of dust reverberation for the 17 type-1 AGNs, the data for which were analyzed carefully and uniformly to obtain precise estimates of lag times. This sample is the largest homogeneous collection of dust reverberation and observations for the size of the inner dust torus. By using these results, we examined the correlation between the dust lag and optical luminosity, which has been reported in previous studies (Suganuma et al., 2006; Kishimoto et al., 2011). In the subsequent sections, the lag times were corrected for time dilation according to the object redshift, the maximum of which was approximately 5%.
4.1. Estimation of the Optical Luminosities of an AGN
We first calculated an “average” -band flux, , for each corresponding period in which the was obtained, following Koshida et al. (2009). Rather than obtaining a simple average of the observed fluxes, which could be biased by unequal intervals of observation, an average flux from the interpolated -band light curve with equal intervals generated in the process of the CCF analysis was calculated as a measure of . We obtained the distribution of the average -band flux from all realizations of the Monte Carlo simulation, and and its error were estimated by a centroid and percentiles in both sides of the distribution. In Figures 6 and 7, the distributions of the average -band flux for respective epochs are presented for NGC 4151 as an example.
The absolute magnitude in the band, , was then calculated from and the recession velocity of the target, assuming the cosmological parameters. The recession velocity was obtained from the local flow corrected velocity of the Virgo infall Great Attractor Shapley supercluster displayed by the NED, which was originally based on Mould et al. (2000). The -band absolute magnitude and their errors of the targets for all epochs of lag-time measurements, in addition to the weighted averaged for the individual targets, are listed in Table 7. The error of was estimated from a root sum square of the errors of , host-galaxy flux, narrow emission-line flux, and flux calibration caused by uncertainty of the reference star magnitudes.
4.2. Correlation between the Dust Lag and Optical Luminosity
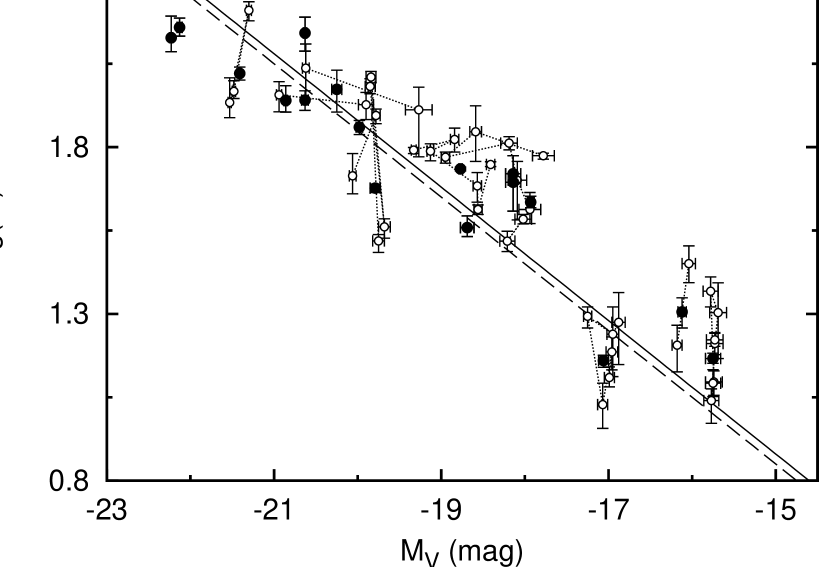
In Figure 10, the dust lags of the target AGNs were plotted against their -band absolute magnitudes . A clear correlation between and over an absolute magnitude range of to was detected for the 49 measurements of dust lags and the weighted averaged lags for the 17 individual target AGNs, represented in the figure by open and filled circles, respectively. This correlation has been presented in previous studies for a smaller sample (Oknyanskij & Horne, 2001; Minezaki et al., 2004; Suganuma et al., 2006).
To examine the correlation between the dust lag and optical luminosity, a regression analysis was applied with a linear equation in the form of
| (4) |
This regression analysis was applied to the data assuming and for both and . We assumed the slope of the regression line as , following Minezaki et al. (2004), because the slope is expected from the simple model of the dust sublimation radius, as presented in Equation (1). In addition, Kishimoto et al. (2011) reported that such correlation is consistent with the slope for the data combined with the dust reverberation and near-infrared interferometry, including AGNs with higher luminosity. The regression was calculated by the generalized multivariate least-squares method presented by Jefferys (1980), weighted by the errors of and . A detailed discussion on the slope of the correlation will be available in a forthcoming paper based on the systematic measurements of dust reverberation with the data for AGNs with higher luminosity.
We first fit the model to the data of the measurements of dust lags and to those of the weighted averaged lags for the 17 targets; the results are listed in Table 9. The derived parameters agreed well; however, the reduced of the fitting was significantly larger than unity. That is, the fitting residuals were much larger than those expected from the measurement errors of and .
Peculiar velocity was a source of error for our estimation of , whereby the effect was larger for closer objects. Since the values presented for the peculiar velocity dispersion, , differ slightly (e.g., Watkins, 1997; Gibbons et al., 2001; Radburn-Smith et al., 2004; Masters et al., 2006), we assumed km s-1 and km s-1 to estimate the uncertainty of caused by peculiar velocity. Then, incorporating this error by root-sum-square, we fit the model to the data of the weighted averaged lags for the 17 targets. These results are also listed in Table 9. The reduced of the fitting decreased considerably when the peculiar velocity dispersion was incorporated; however, it remained much larger than unity. Therefore, significant intrinsic scatter was expected to reside in the dust lag-luminosity correlation.
We then fitted the model to the data of the weighted averaged lags for the 17 targets, adding an error to the error of data by root-sum-square for the reduced to achieve unity. The fitting was also applied to the data incorporating the peculiar velocity dispersion; the fitting results as well as are listed in Table 9. The derived parameters and agreed well among them, and we adopted with dex ( assumed) and with dex ( assumed) for , and with dex ( assumed) and with dex ( assumed) for , from the fittings incorporating the peculiar velocity dispersion. The best-fit regression lines are also presented in Figure 10. The systematic difference between two linear regressions between the data assuming and was dex, and that between the CCF analysis and JAVELIN was dex. We adopted (Tomita, 2005) tentatively for the spectral shape of the flux variation of accretion-disk emission in optical and near-infrared spectra for the subtraction of the accretion disk, and we estimated for and for . Then, we adopt for the parameter of the dust lag-luminosity correlation in Equation (4). The parameter of was consistent with that presented in a previous study (; Minezaki et al., 2004). In addition, regarding the scatter between and as the systematic scatter associated with the lag-analysis methods, dex can be interpreted as intrinsic scatter in the dust lag-luminosity correlation.
4.3. Possible Origin of Intrinsic Scatter in the Dust Lag-Luminosity Correlation
Although the central engine of the type-1 AGN is not considered to be as heavily obscured by the dust torus as that of the type-2 AGN, a small but different amount of extinction could exist in type-1 AGNs to create a possible source of scatter in the dust lag-luminosity correlation. Cackett et al. (2007) estimated the intrinsic color excess of 14 AGNs by the flux variation gradient (FVG) method (Winkler et al., 1992) and the Balmer decrement method. The estimates obtained from both methods were consistent; therefore, the difference between the estimates by the two methods could be regarded as the sum of the intrinsic uncertainties of the methods themselves. We estimated the standard deviation of the uncertainty of the FVG method as mag. In fact, of the 14 target AGNs of Cackett et al. (2007), 11 AGNs are in common with our targets. For these targets, the standard deviation of color excess obtained by the FVG method was estimated as mag, and the intrinsic standard deviation of color excess was estimated as mag. Assuming , this value corresponds to the scatter of approximately mag in or dex in , which is insufficient for explaining the scatter of dex in the correlation.
The difference in the spectral shape of the flux variation of accretion-disk emission between targets, which would be caused by a different amount of intrinsic extinction or by other reasons, would contribute the scatter in the dust lag-luminosity correlation. For example, the intrinsic standard deviation of , which could be caused by the intrinsic standard deviation of color excess of mag, would originate the scatter of approximately dex in . This result is also insufficient for explaining the scatter of dex in the correlation.
We then focused on the changes in dust torus size with the flux variation as an additional possible source of scatter in the dust lag-luminosity correlation. Koshida et al. (2009) found that although the dust lag changed with the flux variation in the band, the dust lags at different epochs did not follow the relation of for NGC 4151. They suggested that the destruction and formation of the dusty clouds composing the dust torus would not respond instantaneously with the variation of incident flux. In addition, Pott et al. (2010) and Kishimoto et al. (2011) did not detect the size change of the inner dust torus during the flux variation in the multi-epoch near-infrared interferometric data for the same object, and at last Kishimoto et al. (2013) found its size change from the longer term monitoring observation by the near-infrared interferometry, which did not follow the relation of as well. Indeed, as shown in Figure 10, the multi-epoch data of and for a target AGN appeared to scatter around the global dust lag-luminosity correlation. This behavior of the dust torus size would broaden the correlation unless the dust lag and luminosity for an object were time-averaged over a long span. The scatter was then estimated from the multi-epoch data for the 11 target AGNs. The median of the standard deviations of distance from the correlation for respective targets was 0.11 dex, which is significant but still has some room to account for the dex scatter.
Even after these possible contributions to the scatter were subtracted, an intrinsic scatter of dex in was expected to remain in the dust lag-luminosity correlation and would be produced by diversities of characteristics in type-1 AGNs such as the viewing angle of the accretion disk and dust torus or by the Eddington ratio of the mass accretion rate. The dependency of dust lag on these parameters is discussed in Section 5.
5. Discussion
5.1. Change in Dust Lag with Viewing Angle and Mass Accretion Rate
The dust reverberation models predicted that the transfer function, a response of flux variation of the dust emission on an impulse of the UV-optical continuum emission, would change with the viewing angle of the dust torus (Barvainis, 1992; Kawaguchi & Mori, 2011). In particular, Kawaguchi & Mori (2011) reported that the centroid of the transfer function, which should be interpreted as the lag between flux variations, increases with the viewing angle according to the reverberation model with a clumpy torus, because the self-occultation and waning effects selectively decrease the emission from dusty clouds with a shorter lag at the side in closest proximity to the observer.
We then examined a possible systematic change in dust lag with the viewing angle. In Figure 11, we plotted the residuals of the dust lag from the best-fit regression line (for the data assuming ) against the subclass of the Seyfert type as an indicator of viewing angle. The subclasses of intermediate Seyfert galaxies (S1.0, S1.2, S1.5, and S1.8) for the 14 target AGNs were obtained from Véron-Cetty & Véron (2010). Among them, Mrk 335 and NGC 4051 were classified as narrow-line Seyfert 1 (S1n) by Véron-Cetty & Véron (2010), and a subclass of S1.0 was assigned following Osterbrock & Martel (1993). The error of the residual was estimated from those of the lag time and .
As shown in Figure 11, we did not detect systematic changes of dust lag with the subclass of the Seyfert type, although Kawaguchi & Mori (2011) estimated that the dust lag systematically shifted approximately dex with a change of in the viewing angle. However, a possible correlation between the dust lag and viewing angle could not be ruled out, because a certain amount of scatter in the relationship between the Seyfert type and viewing angle was expected from a realistic clumpy dust torus model, which consists of dusty clouds stochastically distributed following the probability distribution as a function of the angle from the equatorial plane (Elitzur, 2012). A better estimate of the viewing angle is required for further investigation.
Next, we focused on the Eddington ratio, which is the mass accretion rate relative to the mass of the central black hole. When the mass accretion rate exceeds the Eddington rate, a slim disk that is optically and geometrically thick appears (Abramowicz et al., 1988). Its disk illumination toward the dust torus located on the equatorial plane would be suppressed by disk self-occultation (Kawaguchi & Mori, 2011; Kawakatu & Ohsuga, 2011); therefore, we can expect that the inner radius of the dust torus decreases as the mass accretion rate increases according to the stronger anisotropy of disk illumination. However, Kawaguchi & Mori (2011) reported that according to their reverberation model, the change in dust lag would not be as significant as the mass accretion rate.
In Figure 12, we plotted the residuals of the dust lag from the best-fit regression line (for the data assuming ) against the Eddington ratio, , for the 13 target AGNs with black-hole masses measured by BLR reverberation mapping (Peterson et al., 2004; Bentz et al., 2006a, 2007; Denney et al., 2010; Grier et al., 2012b). NGC 4593 was omitted because of its large error in black-hole mass. The bolometric luminosity was estimated from the luminosity of the optical continuum emission as (Kaspi et al., 2000), where was calculated from by assuming a power-law spectrum of . The error of the Eddington ratio was estimated from those of and black-hole mass.
As shown in Figure 12, we did not detect systematic changes in dust lag with the Eddington ratio. In fact, the Eddington ratios of all 13 targets were smaller than and were believed to be too small for slim disk formation. Because a standard accretion disk with a small mass accretion rate would not change the illumination anisotropy as much as the mass accretion rate (Kawaguchi & Mori, 2011), the absence of a systematic trend of dust lag with the Eddington ratio in Figure 12 is consistent with the model. The observation of an AGN with a super-Eddington mass accretion rate is required to investigate the effect of anisotropic illumination of the slim disk.
5.2. Structure of the BLR and Inner Dust Torus
Reverberation observations for BELs and dust thermal emission provide an important tool for investigating the structure of the BLR and innermost dust torus. Suganuma et al. (2006) compared the results of the dust reverberation with those for BELs and demonstrated that the innermost dust torus was located just outside of the BLR. Infrared interferometry is also an important tool for investigating the dust torus. Kishimoto et al. (2011) reported that the radius of the innermost dust torus obtained by near-infrared interferometry was consistent with the dust reverberation radius; however, the former tended to be roughly equal to or slightly larger than the latter. On the basis of our new results of the largest homogeneous sample of dust reverberation, we discuss in this section the structure of the BLR and the innermost dust torus.
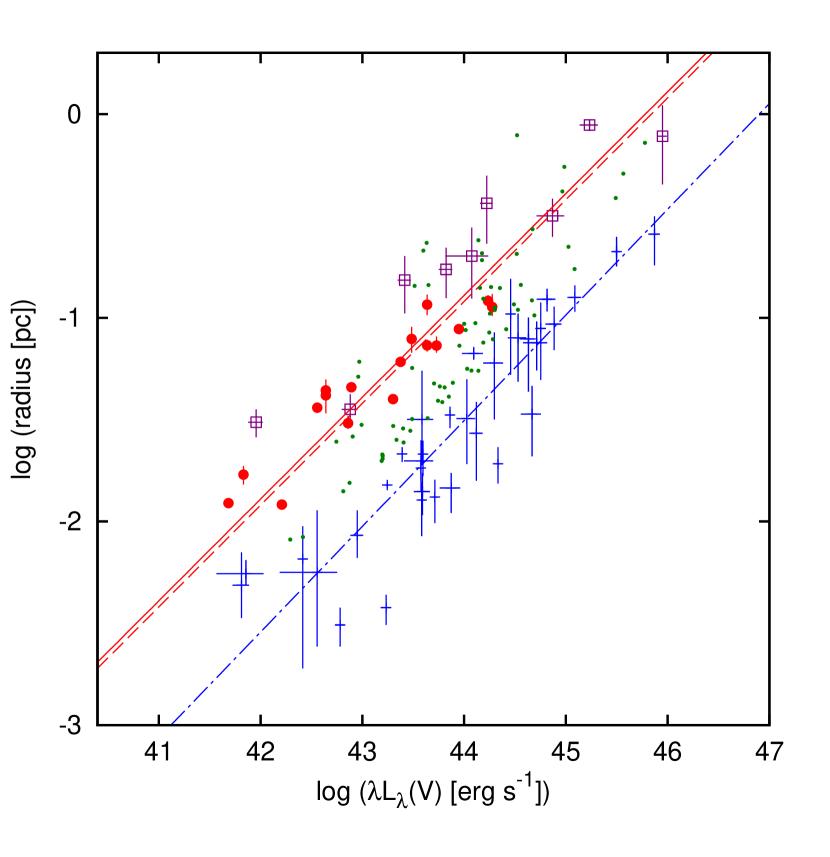
In Figure 13, we plotted the radii of the innermost dust torus obtained by reverberation and near-infrared interferometry, as well as the reverberation radius of the BLR, against the optical -band luminosity. The dust reverberation radii and optical luminosities were obtained from our results, and those of the near-infrared interferometry were obtained from the data compiled by Kishimoto et al. (2011) and Weigelt et al. (2012). The lag-luminosity correlation of BLR has been investigated by many authors. Among the data presented in such studies, we used that obtained by the reverberation observation of Balmer emission lines (mostly H) compiled by Bentz et al. (2009a), because they presented an accurate estimation of the optical luminosity by using the images to carefully subtract the host-galaxy flux.
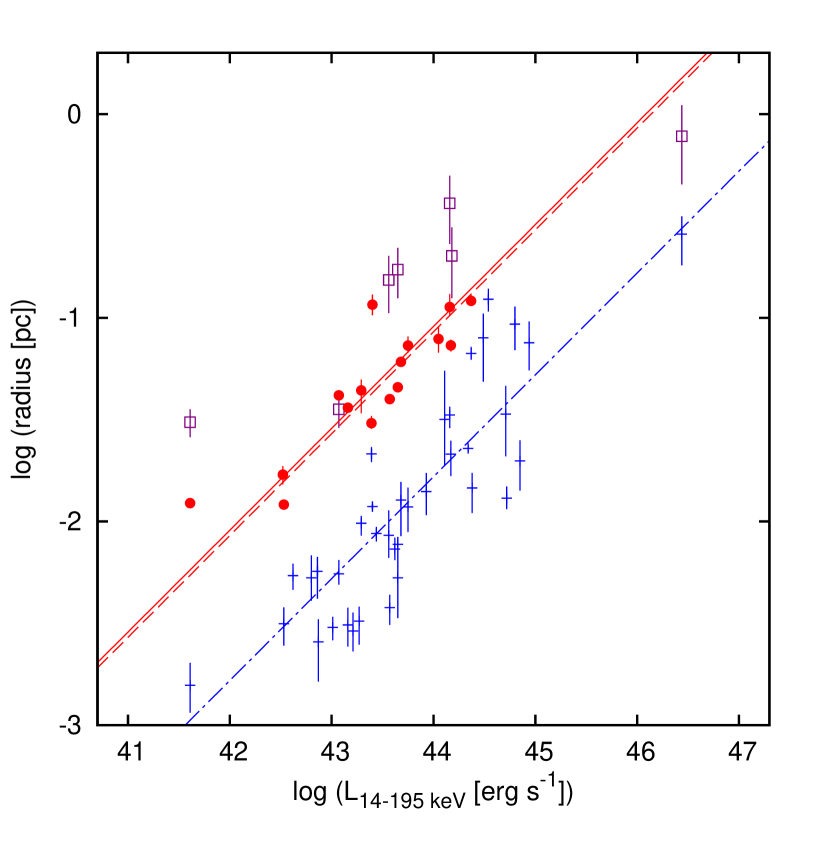
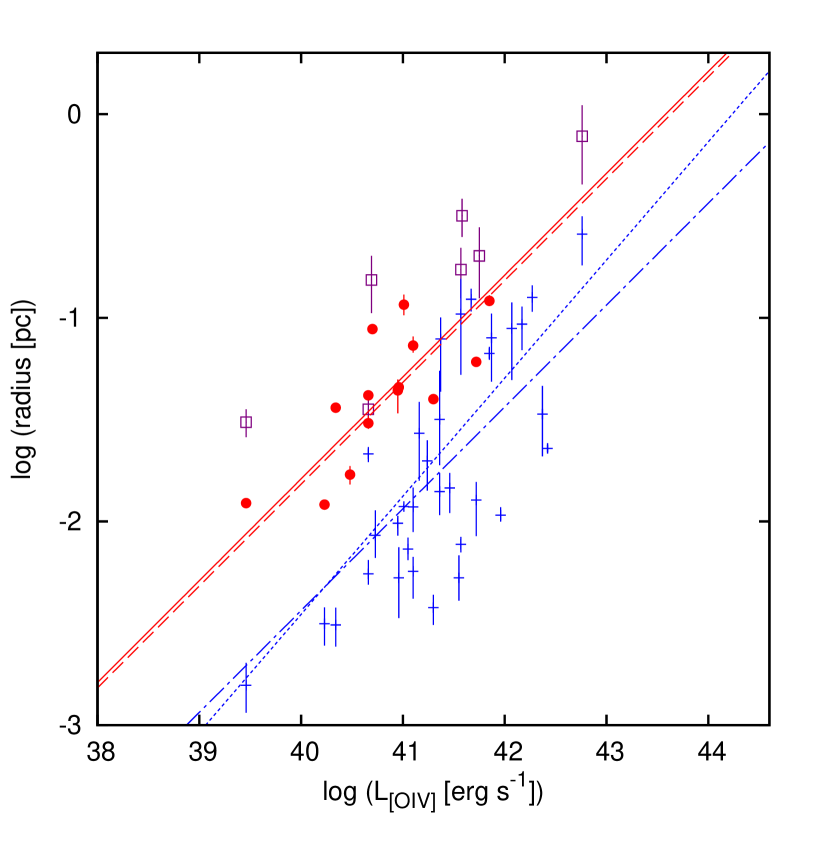
In Figure 14, the radii of the innermost dust torus and BLR (H) were plotted against the hard X-ray (14–195 keV) luminosity, and in Figure Reverberation Measurements of the Inner Radius of the Dust Torus in 17 Seyfert Galaxies, they were plotted against the luminosity of [O IV] m emission line. Although the hard X-ray emission and [O IV] emission line are not directly related to the ionization state of the BLR clouds or dust temperature, their luminosities are expected to correlate with that of the accretion disk emission, and they would be far less obscured by the dust torus. Therefore, they could serve as luminosity indicators unbiased to dust obscuration (e.g., Melèndez et al., 2008; Diamond-Stanic et al., 2009; Rigby et al., 2009) and would be useful for estimating the radii of the BLR and innermost dust torus for type-2 AGNs and ultraluminous infrared galaxies. We enlarged the data for reverberation radii of the BLR by adding the results of the recent reverberation observations for H emission lines (Bentz et al., 2006b, 2007, 2009a, 2009b; Denney et al., 2010; Barth et al., 2011a, b; Grier et al., 2012b). The hard X-ray luminosity was obtained from the Swift BAT 58-Month Hard X-ray Survey (Baumgartner et al. submitted) 333 http://heasarc.gsfc.nasa.gov/docs/swift/results/bs58mon/ , and that of the [O IV] emission line was taken from previous research (Deo et al., 2007; Melèndez et al., 2008; Diamond-Stanic et al., 2009; Gallimore et al., 2010; Greene et al., 2010; Liu & Wang, 2010; Tommasin et al., 2010).
As shown in Figures 13–Reverberation Measurements of the Inner Radius of the Dust Torus in 17 Seyfert Galaxies, the radii of the BLR (H) and innermost dust torus showed significant correlation with these luminosities, and the reverberation radius of the BLR was found to be systematically smaller than that of the innermost dust torus, as presented by Suganuma et al. (2006). In addition, we found that the reverberation radius of the innermost dust torus appeared to be systematically smaller than the interferometric radius of the innermost dust torus, as presented by Kishimoto et al. (2011). We then applied the regression analysis for the radius-luminosity relationship to quantitatively estimate their differences.
For the regression analysis, a linear equation,
| (5) |
was adopted and fitted to the data, assuming in the same manner as that described in Section 4. We omitted the data for 3C 273, the most luminous target in Figures 13–Reverberation Measurements of the Inner Radius of the Dust Torus in 17 Seyfert Galaxies, from the fitting with the hard X-ray luminosities, because it is sometimes classified as a blazer, and its hard X-ray is apparently more luminous than the extension of the correlation of the interferometric radius of the innermost dust torus444 Because Kishimoto et al. (2011) noted that 3C 273 was in a quiescent state at the observing epoch of near-infrared interferometry and that the contribution of the synchrotron emission was expected to be small in the optical spectra, we included 3C 273 for calculating regressions of the radii with optical luminosity. . Rather than fitting the data, the regression equation for the correlation of the dust reverberation radius and optical luminosity was converted from the result given in Section 4, and that for the correlation of the BLR reverberation radius and the optical luminosity was obtained from Bentz et al. (2009a). In addition, the regression line for the BLR radius and the [O IV] luminosity independently fitted by Greene et al. (2010) are presented for comparison.
The fitted parameters are presented in Table Reverberation Measurements of the Inner Radius of the Dust Torus in 17 Seyfert Galaxies. We found that the BLR reverberation radius was smaller than the dust reverberation radius by – dex, or a factor of –, and that the dust reverberation radius was smaller than the interferometric radius of the innermost dust torus by – dex, or about a factor of two.
The difference between the reverberation radius and interferometric radius of the dust torus observed in the same band can be understood by examining the difference between the response-weighted and flux-weighted radii (Kishimoto et al., 2011). Because the dust temperature in the torus is the highest at the inner boundary of the dust torus and becomes lower at larger radii, the flux-weighted radius would be larger than the inner boundary radius of the dust torus caused by the flux contribution from lower temperature dust at larger radii. In contrast, the reverberation radius analyzed by the CCF analysis would be more weighted on a larger amplitude of flux variation, which is expected to originate from a more compact emitting region or at smaller radii in the dust torus. Therefore, the reverberation radius is expected to be a better estimate for the inner boundary radius of the dust torus.
In addition to the factor of – difference for the mean reverberation radii of the innermost dust torus and BLR, a gap between their distributions is shown in Figure 13. However, on the basis of the following discussions, we suggest that these data do not necessarily indicate a gap of matter between the dust torus and the BLR.
The ionized gas clouds in the BLR are considered to be extended larger than the reverberation radius of Balmer emission lines. Clavel et al. (1991) conducted the reverberation mapping of various BELs in the UV spectrum for NGC 5548 and found that the lags tended to be shorter for higher ionization lines and longer for lower ionization lines. The lag times for the Si IVO IV], C III], and Mg II emission lines were larger by a factor of two or more for H in similar epoch observations (Peterson et al., 2004). In addition, Hu et al. (2008) and Zhu et al. (2009) recently proposed a component of intermediate velocity width in conventional broad Balmer emission lines and suggested that the intermediate line region is located on the outer part of the BLR in the vicinity of the dust torus. Moreover, the ionized gas clouds of the BLR could be distributed at radii larger than the reverberation radius because the lag time corresponds to the centroid of the transfer function, which is considered to be the average radius of the distribution of the gas clouds (e.g., Horne, 1999).
On the contrary, the dust with temperature higher than that of the black body radiation corresponding to the -band wavelength is expected to be in a more inner location than that of the dust reverberation radius measured in the band. Tomita et al. (2006) used the multicomponent fitting of the flux variation to find that the -band flux variation for MCG 0811011 was followed by the -band flux variation approximately 6 days later. Their results indicate that the reverberation radius in the band was approximately 7% smaller than that in the band obtained in this study. The same trend was reported by Tomita (2005) for additional AGNs. The -band flux from the higher temperature of dust was detected by Sakata et al. (2010), who also used the multicomponent fitting of the flux variation. The dust temperature was estimated to be approximately – K for seven Seyfert galaxies, which is consistent with the sublimation temperature of graphite grains (Salpeter, 1977).
Further, Koshida et al. (2009) discovered a rapid variation of dust lags obtained by the dust reverberation observation of NGC 4151. Because this variation was found to be significantly faster than the dynamical timescale at the radii of the BLR and inner dust torus, they concluded that the formation and destruction of dust grains in the gas clouds changed the radius of the innermost dust torus. These results suggest that the gas clouds are distributed continuously and that the inner boundary of the dust torus is determined by the sublimation of the hottest grains in the clouds (Netzer & Laor, 1993), which were located between the reverberation radii of the -band dust emission region and the H BLR.
Mor et al. (2009) reported near-infrared excess emission in the infrared SEDs of AGNs that could not be explained by the components of emission from a clumpy dust torus model (Nenkova et al., 2002, 2008) or by the dusty narrow emission-line region (NLR). Mor & Netzer (2012) introduced a gas cloud with hot pure-graphite grains to account for such excess emission and constructed an SED model consisting of a hot-dust cloud, a clumpy dust torus, and a dusty NLR to fit the infrared SED of type-1 AGNs. Figure 13 shows the location of the hot-dust clouds obtained from such fittings reported by Mor & Netzer (2012). Indeed, the hot dust clouds were located between the two reverberation radii, which also suggests that the inner radius of the dust torus is smaller than the -band dust reverberation radius but larger than the Balmer-line reverberation radius.
The inner radius of the dust torus was expected to be smaller than that of Equation (1), assuming K and m, by a factor of more than . However, a higher sublimation temperature is probable as described. In addition, a larger grain size of m could be adopted on the basis of the analysis of reddening curves for quasars (Gaskell et al., 2004). By assuming K for the dust temperature that was evaluated from the NIR colors of the variable flux component for Seyfert 1 galaxies (Tomita, 2005; Tomita et al., 2006), and m for the grain size, the sublimation radius predicted by Equation (1) can be written as , where (Kishimoto et al., 2007), which was found to be close to the -band dust reverberation radius. It should be noted that in Equation (1) is an effective luminosity of the UV-optical continuum emission multiplied by the wavelength-dependent absorption efficiency of dust grains. Therefore, a detailed calculation of radiation equilibrium in dusty clouds is necessary and will appear in a forthcoming paper.
6. Summary
We presented the results of a dust reverberation survey for 17 nearby Seyfert 1 galaxies, which provides the largest homogeneous data collection for the radius of the innermost dust torus. For all targets, long-term monitoring observations in optical and near-infrared wavelengths showed a delayed response of the -band light curve after that of the band. The minor contribution of the accretion disk in the -band flux was subtracted to derive the variation of the dust torus emission, and the CCF analysis was applied to obtain 49 measurements of reverberation lags for the innermost dust torus. The optical luminosity of the continuum emission from the accretion disk was estimated by subtracting the host-galaxy and narrow-line flux contributions in the -band fluxes. We found that the reverberation lags for the innermost dust torus strongly correlated with the optical luminosity in the range of to mag. We applied the regression analysis to our new data to obtain the correlation of or , assuming the slope of to be same as that reported in previous studies. The intrinsic scatter of the correlation was estimated to be approximately dex, and its possible origins were discussed. The difference in internal extinction and the delayed response of changes in lag times to the flux variations could have partly contributed to the intrinsic scatter; however, we could not detect systematic changes in the lag-luminosity correlation with the subclass of the Seyfert type and the Eddington ratio.
Furthermore, we compared our results with the radius-luminosity correlations for the near-infrared interferometry and BLR reverberation. In addition to that with the optical luminosity, we examined such correlations with the hard X-ray (14–195 keV) and [O IV] m emission-line luminosities, which are known as isotropic luminosity indicators and are applicable to obscured AGNs. We found that the interferometric radius in the band was systematically larger than the reverberation radius in the same band by approximately 0.3 dex, which could be interpreted as the difference between the flux-weighted radius and the response-weighted radius, as suggested by Kishimoto et al. (2011). We suggest that the reverberation radius provides a better estimate for the inner boundary radius of the dust torus.
As expected from the unified scheme of the Seyfert type of AGNs, the BLR reverberation radius was found to be systematically smaller than the dust reverberation radius, as reported by Suganuma et al. (2006), with a difference of approximately 0.6-0.7 dex. However, we suggest that gas clouds with the hottest dust, and those emitting BELs of lower ionization species or intermediate lines, are located between them, wherein the inner radius of the dust torus is determined by the sublimation of dust grains. The higher dust temperature of K and the larger grain size of m are preferred for the parameters of the dust sublimation radius expressed in Equation (1); however, detailed calculation of radiation equilibrium in dusty clouds is desired.
References
- Abramowicz et al. (1988) Abramowicz, M. A., Czerny, B., Lasota, J. P., & Szuszkiewicz, E. 1988, ApJ, 332, 646
- Antonucci & Miller (1985) Antonucci, R. R. J., & Miller, J. S. 1985, ApJ, 297, 621
- Antonucci (1993) Antonucci, R. 1993, ARA&A, 31, 473
- Baribaud et al. (1992) Baribaud, T., Alloin, D., Glass, I., & Pelat, D. 1992, A&A, 256, 375
- Barth et al. (2011a) Barth, A. J., Nguyen, M. L., Malkan, M. A. et al. 2011, ApJ, 732, 121
- Barth et al. (2011b) Barth, A. J., Pancoast, A., Thorman, S. J. et al. 2011, ApJ, 743, L4
- Barvainis (1987) Barvainis, R. 1987, ApJ, 320, 537
- Barvainis (1992) Barvainis, R. 1992, ApJ, 400, 502
- Bentz et al. (2006a) Bentz, M. C., Denney, K. D., Cackett, E. M. et al. 2006, ApJ, 651, 775
- Bentz et al. (2006b) Bentz, M. C., Peterson, B. M., Pogge, R. W., Vestergaard, M., & Onken, C. A. 2006, ApJ, 644, 133
- Bentz et al. (2007) Bentz, M. C., Denney, K. D., Cackett, E. M. et al. 2007, ApJ, 662, 205
- Bentz et al. (2009a) Bentz, M. C., Peterson, B. M., Netzer, H., Pogge, R. W., & Vestergaard, M. 2009, ApJ, 697, 160
- Bentz et al. (2009b) Bentz, M. C., Walsh, J. L., Barth, A. J., et al. 2009, ApJ, 705, 199
- Boroson & Meyers (1992) Boroson, T. A., & Meyers, K. A. 1992, ApJ, 397, 442
- Cackett et al. (2007) Cackett, E. M., Horne, K., & Winkler, H. 2007, MNRAS, 380, 669
- Clavel et al. (1989) Clavel, J., Wamsteker, W., & Glass, I. S. 1989, ApJ, 337, 236
- Clavel et al. (1991) Clavel, J., Reichert, G. A., Alloin, D., et al. 1991, ApJ, 366, 64
- Collier & Peterson (2001) Collier, S., & Peterson, B. M. 2001, ApJ, 555, 775
- Denney et al. (2006) Denney, K. D., Bentz, M. C., Peterson, B. M., et al. 2006, ApJ, 653, 152
- Denney et al. (2010) Denney, K. D., Peterson, B. M., Pogge, R. W., et al. 2010, ApJ, 721, 715
- Deo et al. (2007) Deo, R. P., Crenshaw, D. M., Kraemer, S. B., Dietrich, M., Elitzur, M., Teplitz, H., Turner, T. J. 2007, ApJ, 671, 124
- Deo et al. (2011) Deo, R. P., Richards, G. T., Nikutta, R., et al. 2011, ApJ, 729, 108
- Diamond-Stanic et al. (2009) Diamond-Stanic, A. M., Rieke, G. H., & Rigby, J. R. 2009, ApJ, 698, 623
- Dietrich et al. (2012) Dietrich, M., Peterson, B. M., Grier, C. J., et al. 2012, ApJ, 757, 53
- Doroshenko et al. (2012) Doroshenko, V. T., Sergeev, S. G., Klimanov, S. A., Pronik, V. I., & Efimov, Yu. S. 2012, MNRAS, 426, 416
- Du et al. (2014) Du, P., Hu, C., Lu, K.-X., et al. 2014, ApJ, 782, 45
- Dullemond & van Bemmel (2005) Dullemond, C. P. & van Bemmel, I. M. 2005, A&A, 436, 47
- Edri et al (2012) Edri, H., Rafter, S. E., Chelouche, D., Kaspi, S., & Behar, E. 2012, ApJ, 756, 73
- Elitzur (2012) Elitzur, M. 2012, ApJ, 747, L33
- Enya et al. (2002) Enya, K., Yoshii, Y., Kobayashi, Y., et al. 2002, ApJS, 141, 31
- Gallimore et al. (2010) Gallimore, J. F., Yzaguirre, A., Jakoboski, J., Stevenosky, M. J., Axon, D. J., Baum, S. A., Buchanan, C. L., Elitzur, M., Elvis, M., O’Dea, C. P., & Robinson, A. 2010, ApJS, 187, 172
- Gaskell et al. (2004) Gaskell, C. M., Goosmann, R. W., Antonucci, R. R. J., & Whysong, D. H. 2004, ApJ, 616, 147
- Gibbons et al. (2001) Gibbons, R. A., Fruchter, A. S., & Bothun, G. D. 2001, AJ, 121, 649
- Glass (1992) Glass, I. S. 1992, MNRAS, 256, 23P
- Glass (2004) Glass, I. S. 2004, MNRAS, 350, 1049
- Greene et al. (2010) Greene, J. E., Hood, C. E., Barth, A. J., Bennert, V. N., Bentz, M. C., Filippenko, A. V., Gates, E., Malkan, M. A., Treu, T., Walsh, J. L., & Woo, J.-H. 2010, ApJ, 723, 409
- Grier et al. (2013) Grier, C. J., Peterson, B. M., Horne, K., et al. 2013, ApJ, 764, 47
- Grier et al. (2012a) Grier, C. J., Peterson, B. M., Pogge, R. W., et al. 2012, ApJ, 744, 4
- Grier et al. (2012b) Grier, C. J., Peterson, B. M., Pogge, R. W., et al. 2012, ApJ, 755, 60
- Hönig et al. (2006) Hönig, S. F., Beckert, T., Ohnaka, K., Weigelt, G. 2006, A&A, 452, 459
- Horne (1999) Horne, K. 1999, in ASP Conf. Ser. 162, Quasars and Cosmology, ed. G. Ferland & J. Baldwin (San Francisco, CA: ASP), 189
- Hu et al. (2008) Hu, C., Wang, J.-M., Ho, L. C., Chen, Y.-M., Bian, W.-H, & Xue, S.-J. 2008, ApJ, 683, L115
- Hunt et al. (1998) Hunt, L. K., Mannucci, F., Testi, L., et al. 1998, AJ, 115, 2594
- Jefferys (1980) Jefferys, W. H. 1980, AJ, 85, 177
- Kaspi et al. (1996) Kaspi, S., Maoz, D., Netzer, H., et al. 1996, ApJ, 470, 336
- Kaspi et al. (2000) Kaspi, S., Smith, P. S., Netzer, H., Maoz, D., Jannuzi, B. T., & Giveon, U. 2000, ApJ, 533, 631
- Kaspi et al. (2005) Kaspi, S., Maoz, D., Netzer, H., et al. 2005, ApJ, 629, 61
- Kawaguchi & Mori (2010) Kawaguchi, T., & Mori, M. 2010, ApJ, 724, L183
- Kawaguchi & Mori (2011) Kawaguchi, T., & Mori, M. 2011, ApJ, 737, 105
- Kawakatu & Ohsuga (2011) Kawakatu, N., & Ohsuga, K. 2012, MNRAS, 417, 2562
- Kelly et al. (2009) Kelly, B. C., Bechtold, J., & Siemiginowska, A. 2009, ApJ, 698, 895
- Kishimoto et al. (2007) Kishimoto, M., Hönig, S. F., Beckert, T., & Weigelt, G. 2007, A&A, 476, 713
- Kishimoto et al. (2008) Kishimoto, M., Antonucci, Ro., Blaes, O., Lawrence, A., Boisson, C., Albrecht, M., Leipski, C. 2008, Nature, 454, 492
- Kishimoto et al. (2009) Kishimoto, M., Hönig, S. F., Antonucci, R., et al. 2009, A&A, 507, L57
- Kishimoto et al. (2011) Kishimoto, M., Hönig, S. F., Antonucci, R., et al. 2011, A&A, 536, A78
- Kishimoto et al. (2013) Kishimoto, M., Hönig, S. F., Antonucci, R., et al. 2013, ApJ, 775, L36
- Kobayashi et al. (1993) Kobayashi, Y., Sato, S., Yamashita, T., Shiba, H., & Takami, H., 1993, ApJ, 404, 94
- Kobayashi et al. (1998a) Kobayashi, Y., et al., 1998, Proc. SPIE, 3352, 120
- Kobayashi et al. (1998b) Kobayashi, Y., Yoshii, Y., Peterson, B. A., Minezaki, T., Enya, K., Suganuma, M., & Yamamuro, T., 1998, Proc. SPIE, 3354, 769
- Koshida et al. (2009) Koshida, S., Yoshii, Y., Kobayashi, Y., et al. 2009, ApJ, 700, L109
- Kozłowski et al. (2010) Kozłowski, S., Kochanek, C. S., Udalski, A., et al. 2010, ApJ, 708, 927
- Krolik & Begelman (1988) Krolik, J. H., & Begelman, M. C. 1988, ApJ, 329, 702
- Landolt (1992) Landolt, A. U. 1992, AJ, 104, 372
- Landt et al. (2011) Landt, H., Bentz, M. C., Peterson, B. M., et al. 2011, MNRAS, 413, L106
- Lira et al. (2011) Lira, P., Arévalo, P., Uttley, P., McHardy, I., Breedt, E. 2011, MNRAS, 415, 1290
- Liu & Wang (2010) Liu, T., & Wang, J.-X. 2010, ApJ, 725, 2381
- MacLeod et al. (2012) MacLeod, C. L., Ivezić, Ž., Sesar, B., et al. 2012, ApJ, 753, 106
- MacLeod et al. (2010) MacLeod, C. L., Ivezić, Ž., Kochanek, C. S., et al. 2010, ApJ, 721, 1014
- Maoz & Netzer (1989) Maoz, D., & Netzer, H. 1989, MNRAS, 236, 21
- Marziani et al. (2003) Marziani, P., Sulentic, J. W., Zamanov, R., et al. 2003, ApJS, 145, 199
- Masters et al. (2006) Masters, K. L., Springob, C. M., Haynes, M. P., & Giovanelli, R. 2006, ApJ, 653, 861
- Melèndez et al. (2008) Melèndez, M., Kraemer, S. B., Armentrout, B. K., Deo, R. P., Crenshaw, D. M., Schmitt, H. R., Mushotzky, R. F., Tueller, J., Markwardt, C. B. & Winter, L. 2008, ApJ, 682, 94
- Miller & Goodrich (1990) Miller, J. S., & Goodrich, R. W. 1990, ApJ, 355, 456
- Minezaki et al. (2004) Minezaki, T., Yoshii, Y., Kobayashi, Y., et al. 2004, ApJ, 600, L35
- Minezaki et al. (2006) Minezaki, T., Yoshii, Y., Kobayashi, Y., et al. 2006, ApJ, 643, L5
- Mor et al. (2009) Mor, R., Netzer, H., & Elitzur, M. 2009, ApJ, 705, 298
- Mor & Netzer (2012) Mor, R., & Netzer, H. 2012, MNRAS, 420, 526
- Mould et al. (2000) Mould, J. R., Huchra, J. P., Freedman, W. L., et al. 2000, ApJ, 529, 786, with an erratum
- Nelson (1996a) Nelson, B. O. 1996, ApJ, 465, L87
- Nelson (1996b) Nelson, B. O. 1996, Ph.D. dissertation, University of California, Los Angeles
- Nelson & Malkan (2001) Nelson, B. O., & Malkan, M. A. 2001, in ASP Conf. Ser. 224, Probing the Physics of Active Galactic Nuclei, ed. B. M. Peterson, R. W. Pogge, & R. S. Polidan (San Francisco, CA: ASP), 141
- Nenkova et al. (2002) Nenkova, M., Ivezić, Ž., & Elitzur, M. 2002, ApJ, 570, L9
- Nenkova et al. (2008) Nenkova, M., Sirocky, M. M., Nikutta, R., Ivezić, Ž., & Elitzur, M. 2008, ApJ, 685, 160
- Netzer & Laor (1993) Netzer, H., & Laor, A. 1993, ApJ, 404, L51
- Oknyanskii (1993) Oknyanskij, V. L. 1993, Astronomy Letters, 19, 416
- Oknyanskij et al. (1999) Oknyanskij, V. L., Lyuty, V. M., Taranova, O. G., & Shenavrin, V. I. 1999, Astronomy Letters, 25, 483
- Oknyanskij & Horne (2001) Oknyanskij, V. L., & Horne, K. 2001, in ASP Conf. Ser. 224, Probing the Physics of Active Galactic Nuclei, ed. B. M. Peterson, R. W. Pogge, & R. S. Polidan (San Francisco, CA: ASP), 149
- Onken et al. (2003) Onken, C. A., Peterson, B. M., Dietrich, M., Robinson, A., & Salamanca, I. M. 2003, ApJ, 585, 121
- Osterbrock & Martel (1993) Osterbrock, D. E., & Martel, A. 1993, ApJ, 414, 552
- Peng et al. (2002) Peng, C. Y., Ho, L. C., Impey, C. D., & Rix, H.-W. 2002, AJ, 124, 266
- Peterson et al. (1998) Peterson, B. M., Wanders, I., Horne, K., Collier, S., Alexander, T., Kaspi, S., & Maoz, D. 1998, PASP, 110, 660
- Peterson (2001) Peterson, B. M., 2001, in Advanced Lectures on the Starburst-AGN Connection, ed. I. Aretxaga,, D. Kunth, & Mújica (Singapore: World Scientific), 3
- Peterson et al. (2004) Peterson, B. M., Ferrarese, L., Gilbert, K. M., et al. 2004, ApJ, 613, 682
- Pier & Krolik (1992) Pier, E. A. & Krolik, J. H. 1992, ApJ, 401, 99
- Pott et al. (2010) Pott, J.-U., Malkan, M. A., Elitzur, M., Ghez, A. M., Herbst, T. M., Schödel, R., & Woillez, J. 2010, ApJ, 715, 736
- Pozo Nuñez et al. (2014) Pozo Nuñez, F., Haas, M., Chini, R., Ramolla, M., Westhues, C., Steenbrugge, K., Kaderhandt, L., Drass, H., Lemke, R., & Murphy, M. 2014, A&A, 561, L8
- Press et al. (1992) Press, W. H., Rybicki, G. B., & Hewitt, J. N. 1992, ApJ, 385, 404
- Radburn-Smith et al. (2004) Radburn-Smith, D. J, Lucey, J. R., & Hudson, M. J. 2004, MNRAS, 355, 1378
- Rafter et al. (2011) Rafter, S. E., Kaspi, S., Behar, E., Kollatschny, W., & Zetzl, M. 2011, ApJ, 741, 66
- Rees et al. (1969) Rees, M. J., Silk, J. I., Werner, M. W., Wickramasinghe, N. C. 1969, Nature, 223, 788
- Rigby et al. (2009) Rigby, J. R., Diamond-Stanic, A. M., & Aniano, G. 2009, ApJ, 700, 1878
- Rybicki & Kleyna (1994) Rybicki, G. B., & Kleyna, J. T. 1994, in ASP Conf. Ser. 69, Reverberation mapping of the broad-line region in active galactic nuclei, ed. P. M. Gondhalekar, K. Horne, & B. M. Peterson (San Francisco, CA: ASP), 85
- Rybicki & Press (1992) Rybicki, G. B., & Press, W. H. 1992, ApJ, 398, 169
- Sakata et al. (2010) Sakata, Y., Minezaki, T., Yoshii, Y., Kobayashi, Y., Koshida, S., Aoki, T., Enya, K., Tomita, H., Suganuma, M., Katsuno Uchimoto, Y., & Sugawara, S. 2010, ApJ, 711, 461
- Salpeter (1977) Salpeter, E. E. 1977, ARA&A, 15, 267
- Schartmann et al. (2005) Schartmann, M., Meisenheimer, K., Camenzind, M., Wolf, S., Henning, T. 2005, A&A, 437, 861
- Schartmann et al. (2008) Schartmann, M., Meisenheimer, K., Camenzind, M., Wolf, S., Tristram, K. R. W., Henning, T. 2008, A&A, 482, 67
- Schlegel et al. (1998) Schlegel, D. J., Finkbeiner, D. P., & Davis, M. 1998, ApJ, 500, 525
- Schmitt et al. (2003) Schmitt, H. R., Donley, J. L., Antonucci, R. R. J., et al. 2003, ApJ, 597, 768
- Shakura & Sunyaev (1973) Shakura, N. I., & Sunyaev, R. A. 1973, A&A, 24, 337
- Shapovalova et al. (2013) Shapovalova, A. I., Popović, L. Č., Burenkov, A. N., et al. 2013, A&A, 559, A10
- Sitko et al. (1993) Sitko, M. L., Sitko, A. K., Siemiginowska, A., & Szczerba, R. 1993, ApJ, 409, 139
- Spergel et al. (2007) Spergel, D. N., Bean, R., Doré, O., et al. 2007, ApJS, 170, 377
- Suganuma et al. (2004) Suganuma, M., Yoshii, Y., Kobayashi, Y., et al. 2004, ApJ, 612, L113
- Suganuma et al. (2006) Suganuma, M., Yoshii, Y., Kobayashi, Y., et al. 2006, ApJ, 639, 46
- Storey & Zeippen (2000) Storey, P. J., & Zeippen, C. J. 2000, MNRAS, 312, 813
- Swain et al. (2003) Swain, M., Vasisht, G., Akeson, R., et al. 2003, ApJ, 596, L163
- Telesco et al. (1984) Telesco, C. M., Becklin, E. E., Wynn-Williams, C. G., & Harper, D. A. 1984, ApJ, 282, 427
- Tomita (2005) Tomita, H. 2005, Doctoral Dessertation, The University of Tokyo
- Tomita et al. (2006) Tomita, H., Yoshii, Y., Kobayashi, Y., Minezaki, T., Enya, K., Suganuma, M., Aoki, T., Koshida, S., & Yamauchi, M. 2006, ApJ, 652, L13
- Tommasin et al. (2010) Tommasin, S., Spinoglio, L., Malkan, M. A., & Fazio, G. 2010, ApJ, 709, 1257
- Véron-Cetty & Véron (2001) Véron-Cetty, M.-P., & Véron, P. 2001, A&A, 374, 92
- Véron-Cetty & Véron (2010) Véron-Cetty, M.-P., & Véron, P. 2010, A&A, 518, A10
- Wandel et al. (1999) Wandel, A., Peterson, B. M., & Malkan, M. A. 1999, ApJ, 526, 579
- Watkins (1997) Watkins, R. 1997, MNRAS, 292, L59
- Weigelt et al. (2012) Weigelt, G., Hofmann, K.-H., Kishimoto, M., Hönig, S., Schertl, D., Marconi, A., Millour, F., Petrov, R., Fraix-Burnet, D., Malbet, F., Tristram, K., Vannier, M. 2012, A&A, 541, L9
- White & Peterson (1994) White, R. J., & Peterson, B. M. 1994, PASP, 106, 879
- Whittle (1992) Whittle, M. 1992, ApJS, 79, 49
- Wilhite et al. (2005) Wilhite, B. C., Vanden Berk, D. E., Kron, R. G., Schneider, D. P., Pereyra, N., Brunner, R. J., Richards, G. T., & Brinkmann, J. V. 2005, ApJ, 633, 638
- Winkler et al. (1992) Winkler, H., Glass, I. S., van Wyk, F., et al. 1992, MNRAS, 257, 659
- Yoshii (2002) Yoshii, Y. 2002, in Proceedings of the 5th RESCEU International Symposium on New Trends in Theoretical and Observational Cosmology, ed. K. Sato & T. Shiromizu (Tokyo: Universal Academy Press), 235
- Yoshii, Kobayashi & Minezaki (2003) Yoshii, Y., Kobayashi, Y., & Minezaki, T. 2003, Bulletin of the American Astronomical Society, 35, 752
- Zhang (2013a) Zhang, X.-G. 2013, MNRAS, 431, L112
- Zhang (2013b) Zhang, X.-G. 2013, MNRAS, 434, 2664
- Zhu et al. (2009) Zhu, L., Zhang, S. N., & Tang, S. 2009, ApJ, 700, 1173
- Zu et al. (2011) Zu, Y., Kochanek, C. S., & Peterson, B. M. 2011, ApJ, 735, 80
- Zu et al. (2013) Zu, Y., Kochanek, C. S., Kozłowski, S., & Udalski, A. 2013, ApJ, 765, 106


| Name | R.A. | Decl. | DiameteraaMajor and minor diameters taken from the NED. | bb-band absolute magnitude reported by Véron-Cetty & Véron (2001). | Seyfert | Ref. | Ref. | ||
|---|---|---|---|---|---|---|---|---|---|
| (J2000) | (J2000) | (arcmin) | (mag) | type | |||||
| Mrk 335 | 1.2 | 1 | 3 | ||||||
| Mrk 590 | 1.2 | 2 | 4 | ||||||
| IRAS 034500055 | 1 | ||||||||
| Akn 120 | 1 | 4 | |||||||
| MCG 08–11–011 | 1.5 | 2 | |||||||
| Mrk 79 | 1.2 | 2 | 4 | ||||||
| Mrk 110 | 1.0 | 2 | 4 | ||||||
| NGC 3227 | 1.5 | 2 | 5 | ||||||
| NGC 3516 | 1.5 | 2 | 5 | ||||||
| Mrk 744 | 1.8 | 2 | |||||||
| NGC 4051 | 1.5 | 1 | 5 | ||||||
| NGC 4151 | 1.5 | 2 | 6 | ||||||
| NGC 4593 | 1 | 4 | |||||||
| NGC 5548 | 1.5 | 2 | 7 | ||||||
| Mrk 817 | 1.5 | 2 | 5 | ||||||
| Mrk 509 | 1.2 | 2 | 4 | ||||||
| NGC 7469 | 1.2 | 2 | 4 |
| Object | Band | Observing period | aaNumber of observations. | bbMedian monitoring interval, excluding lengthy observation gaps caused by solar conjunction and occasional facility maintenance. |
|---|---|---|---|---|
| Mrk 335 | 2003.01.08—2006.01.18 | 41 | 15.0 | |
| 2003.01.08—2006.01.18 | 40 | 15.0 | ||
| Mrk 590 | 2003.01.03—2007.08.08 | 92 | 6.5 | |
| 2003.01.03—2007.08.08 | 94 | 6.0 | ||
| IRAS 034500055 | 2002.01.16—2007.08.19 | 88 | 9.8 | |
| 2002.01.16—2007.08.19 | 86 | 9.8 | ||
| Akn 120 | 2001.11.24—2007.08.07 | 67 | 13.5 | |
| 2001.11.24—2007.08.07 | 69 | 13.5 | ||
| MCG 08–11–011 | 2001.01.26—2007.08.19 | 178 | 4.0 | |
| 2001.01.26—2007.08.19 | 187 | 4.0 | ||
| Mrk 79 | 2003.09.08—2006.05.21 | 47 | 10.0 | |
| 2003.09.08—2006.05.11 | 47 | 10.0 | ||
| Mrk 110 | 2003.02.06—2006.05.26 | 49 | 15.8 | |
| 2003.02.06—2006.05.26 | 50 | 15.0 | ||
| NGC 3227 | 2001.11.13—2007.07.01 | 123 | 6.0 | |
| 2001.11.13—2007.07.01 | 132 | 6.0 | ||
| NGC 3516 | 2005.01.16—2007.06.26 | 35 | 14.0 | |
| 2005.01.16—2007.07.02 | 38 | 13.1 | ||
| Mrk 744 | 2002.04.26—2006.05.25 | 90 | 7.0 | |
| 2002.04.26—2006.05.25 | 94 | 7.9 | ||
| NGC 4051 | 2001.03.15—2007.07.30 | 158 | 7.0 | |
| 2001.03.15—2007.07.30 | 181 | 6.0 | ||
| NGC 4151 | 2001.01.06—2007.08.07 | 234 | 4.9 | |
| 2001.01.06—2007.08.07 | 239 | 4.9 | ||
| NGC 4593 | 2005.01.21—2007.07.09 | 35 | 13.0 | |
| 2005.01.21—2007.07.27 | 37 | 13.4 | ||
| NGC 5548 | 2001.03.24—2007.08.20 | 302 | 3.0 | |
| 2001.03.24—2007.08.20 | 311 | 3.0 | ||
| Mrk 817 | 2003.09.04—2006.05.17 | 38 | 16.0 | |
| 2003.09.04—2006.05.17 | 40 | 16.0 | ||
| Mrk 509 | 2003.04.29—2006.05.21 | 45 | 13.1 | |
| 2003.04.29—2006.05.21 | 49 | 13.5 | ||
| NGC 7469 | 2001.06.15—2008.12.08 | 296 | 4.0 | |
| 2001.06.12—2008.12.08 | 315 | 4.1 |
| Object | Reference | R.A. | Decl. | ||
|---|---|---|---|---|---|
| star | (J2000) | (J2000) | (mag) | (mag) | |
| Mrk 335 | A | ||||
| B | |||||
| Mrk 590 | A1aaThe reference star was changed from A1 to A2 on July 12, 2004. | ||||
| A2aaThe reference star was changed from A1 to A2 on July 12, 2004. | |||||
| B | |||||
| IRAS 034500055 | A | ||||
| B | |||||
| Akn 120 | A | ||||
| B | |||||
| MCG 08–11–011 | A | ||||
| B | |||||
| Mrk 79 | A | ||||
| B | |||||
| Mrk 110 | A | ||||
| B | |||||
| NGC 3227 | A | ||||
| B | |||||
| NGC 3516 | A | ||||
| B | |||||
| Mrk 744 | A | ||||
| B | |||||
| NGC 4051 | A | ||||
| B | |||||
| NGC 4151 | A | ||||
| B | |||||
| NGC 4593 | A | ||||
| B | |||||
| NGC 5548 | A | ||||
| B | |||||
| Mrk 817 | A | ||||
| B | |||||
| Mrk 509 | A | ||||
| B | |||||
| NGC 7469 | BbbThe reference star A for NGC 7469 was not used for photometry. |
| Object | Band | Observation Date | Flux | Flux Error |
|---|---|---|---|---|
| (MJD) | (mJy) | (mJy) | ||
| Mrk 335 | 52647.31 | 7.69 | 0.08 | |
| Mrk 335 | 52797.60 | 6.87 | 0.14 | |
| Mrk 335 | 52647.31 | 36.03 | 0.30 | |
| Mrk 335 | 52797.60 | 33.41 | 0.28 | |
Note. — Correction for the Galactic extinction has not been applied to the light curves, and the fluxes from the host galaxy and narrow emission lines have not been subtracted. The complete data of this table is available in a machine-readable form in the online journal. A portion is shown here for guidance.
| Object | Band | aaThe host-galaxy flux within the photometric aperture of . | Ref. | bbThe contribution of [O III] and emission lines to the -band flux. | Ref. | total |
|---|---|---|---|---|---|---|
| (mJy) | (mJy) | (mJy) | ||||
| Mrk 335 | 1 | 1 | ||||
| 1 | ||||||
| Mrk 590 | 2 | 2 | ||||
| 1 | ||||||
| IRAS 034500055 | 4 | 1 | ||||
| 4 | ||||||
| Akn 120 | 4 | 1 | ||||
| 4 | ||||||
| MCG 08–11–011 | 4 | 1 | ||||
| 4 | ||||||
| Mrk 79 | 1 | 1 | ||||
| 1 | ||||||
| Mrk 110 | 2 | 2 | ||||
| 1 | ||||||
| NGC 3227 | 2 | 2 | ||||
| 3 | ||||||
| NGC 3516 | 2 | 2 | ||||
| 1 | ||||||
| Mrk 744 | 1 | 1 | ||||
| 1 | ||||||
| NGC 4051 | 2 | 2 | ||||
| 3 | ||||||
| NGC 4151 | 2 | 2 | ||||
| 5 | ||||||
| NGC 4593 | 2 | 2 | ||||
| 1 | ||||||
| NGC 5548 | 2 | 2 | ||||
| 3 | ||||||
| Mrk 817 | 2 | 2 | ||||
| 1 | ||||||
| Mrk 509 | 1 | 1 | ||||
| 1 | ||||||
| NGC 7469 | 3 | 1 | ||||
| 3 |
Note. — Correction for the Galactic extinction has not been applied.
| Object | ||
|---|---|---|
| Mrk 335 | ||
| Mrk 590 | ||
| IRAS 034500055 | ||
| Akn 120 | ||
| MCG 08–11–011 | ||
| Mrk 79 | ||
| Mrk 110 | ||
| NGC 3227 | ||
| NGC 3516 | ||
| Mrk 744 | ||
| NGC 4051 | ||
| NGC 4151 | ||
| NGC 4593 | ||
| NGC 5548 | ||
| Mrk 817 | ||
| Mrk 509 | ||
| NGC 7469 |
| Object | Section aaThe row of the notation WA presents the weighted averaged -band absolute magnitude and the weighted averaged lag time for the individual targets. | MJD | bbAssuming for the subtraction of the accretion-disk component in the -band flux. | ccAssuming for the subtraction of the accretion-disk component in the -band flux. | bbAssuming for the subtraction of the accretion-disk component in the -band flux. | ccAssuming for the subtraction of the accretion-disk component in the -band flux. | |
|---|---|---|---|---|---|---|---|
| (mag) | (days) | (days) | (days) | (days) | |||
| Mrk 335 | 1 | 52647.3—53753.3 | |||||
| WA | |||||||
| Mrk 590 | 1 | 52842.6—53429.2 | |||||
| WA | |||||||
| IRAS 034500055 | 1 | 52290.4—52709.3 | |||||
| 2 | 52574.5—53453.2 | ||||||
| 3 | 53578.6—54013.4 | ||||||
| WA | |||||||
| Akn 120 | 1 | 53594.6—54319.6 | |||||
| WA | |||||||
| MCG 0811011 | 1 | 52158.6—53124.3 | |||||
| 2 | 53593.6—54224.3 | ddThe middle point of the 16 and 84 %-ile lag times of the likelihood distribution was adopted because ambiguous multiple peaks appeared. | |||||
| WA | |||||||
| Mrk 79 | 1 | 52890.6—53150.3 | |||||
| 2 | 53369.3—53876.3 | ||||||
| WA | |||||||
| Mrk 110 | 1 | 52676.3—53163.3 | |||||
| 2 | 53291.6—53881.3 | ddThe middle point of the 16 and 84 %-ile lag times of the likelihood distribution was adopted because ambiguous multiple peaks appeared. | |||||
| WA | |||||||
| NGC 3227 | 1 | 52226.6—52423.3 | |||||
| 2 | 52935.6—53176.3 | ||||||
| 3 | 53350.5—53485.4 | ||||||
| 4 | 53664.6—53790.4 | ||||||
| 5 | 53723.6—53904.3 | ||||||
| 6 | 54181.4—54282.3 | ||||||
| WA | |||||||
| NGC 3516 | 1 | 53386.4—53920.3 | |||||
| WA | |||||||
| Mrk 744 | 1 | 52994.5—53208.3 | |||||
| 2 | 53336.6—53550.3 | ||||||
| WA | |||||||
| NGC 4051 | 1 | 52286.6—52488.3 | ddThe middle point of the 16 and 84 %-ile lag times of the likelihood distribution was adopted because ambiguous multiple peaks appeared. | ||||
| 2 | 52599.6—52832.3 | ||||||
| 3 | 53341.6—53577.3 | ddThe middle point of the 16 and 84 %-ile lag times of the likelihood distribution was adopted because ambiguous multiple peaks appeared. | ddThe middle point of the 16 and 84 %-ile lag times of the likelihood distribution was adopted because ambiguous multiple peaks appeared. | ||||
| 4 | 53684.6—53937.3 | ||||||
| 5 | 54202.5—54252.4 | ||||||
| 6 | 54221.5—54278.3 | ||||||
| 7 | 54252.4—54311.3 | ||||||
| WA | |||||||
| NGC 4151 | 1 | 51915.6—52127.3 | |||||
| 2 | 52265.5—52646.6 | ||||||
| 3 | 52610.6—53010.5 | ||||||
| 4 | 53039.4—53356.5 | ||||||
| 5 | 53148.4—53490.3 | ||||||
| 6 | 53436.4—53687.6 | ||||||
| 7 | 53687.6—53864.4 | ddThe middle point of the 16 and 84 %-ile lag times of the likelihood distribution was adopted because ambiguous multiple peaks appeared. | |||||
| 8 | 53753.4—53921.3 | ||||||
| WA | |||||||
| NGC 4593 | 1 | 53391.5—53930.3 | |||||
| WA | |||||||
| NGC 5548 | 1 | 51992.5—52389.5 | |||||
| 2 | 52308.6—52797.4 | ||||||
| 3 | 52638.6—52999.6 | ||||||
| 4 | 53168.4—53437.5 | ddThe middle point of the 16 and 84 %-ile lag times of the likelihood distribution was adopted because ambiguous multiple peaks appeared. | ddThe middle point of the 16 and 84 %-ile lag times of the likelihood distribution was adopted because ambiguous multiple peaks appeared. | ||||
| 5 | 53350.6—53527.4 | ||||||
| 6 | 54181.6—54332.3 | ||||||
| WA | |||||||
| Mrk 817 | 1 | 53353.6—53872.5 | |||||
| WA | |||||||
| Mrk 509 | 1 | 52758.6—53867.6 | |||||
| WA |
| Object | Section aaThe row of the notation WA presents the weighted averaged -band absolute magnitude and the weighted averaged lag time for the individual targets. | MJD | bbAssuming for the subtraction of the accretion-disk component in the -band flux. | ccAssuming for the subtraction of the accretion-disk component in the -band flux. | bbAssuming for the subtraction of the accretion-disk component in the -band flux. | ccAssuming for the subtraction of the accretion-disk component in the -band flux. | |
|---|---|---|---|---|---|---|---|
| (mag) | (days) | (days) | (days) | (days) | |||
| NGC 7469 | 1 | 52072.5—52647.2 | |||||
| 2 | 52787.6—53369.3 | ||||||
| 3 | 53508.6—54017.3 | ddThe middle point of the 16 and 84 %-ile lag times of the likelihood distribution was adopted because ambiguous multiple peaks appeared. | |||||
| 4 | 54233.6—54808.3 | ||||||
| WA |
Note. — The lag times in the observed frame were presented.
| Lag Method | NaaThe number of the data pair for the fitting. indicates that all measured lag times and absolute magnitudes were used; indicates that the weighted averaged lag times and absolute magnitudes for individual targets were used. | ccAssuming for the subtraction of the accretion-disk component in the -band flux. | ccAssuming for the subtraction of the accretion-disk component in the -band flux. | reduced ccAssuming for the subtraction of the accretion-disk component in the -band flux. | ddAssuming for the subtraction of the accretion-disk component in the -band flux. | ddAssuming for the subtraction of the accretion-disk component in the -band flux. | reduced ddAssuming for the subtraction of the accretion-disk component in the -band flux. | |
|---|---|---|---|---|---|---|---|---|
| (km s-1) | ||||||||
| CCF | 49 | — | — | — | ||||
| 17 | — | — | — | |||||
| 17 | 200 | — | — | |||||
| 17 | 300 | — | — | |||||
| 17 | — | bb was added to the error of by root-sum-square for the reduced to achieve unity. | bb was added to the error of by root-sum-square for the reduced to achieve unity. | |||||
| 17 | 200 | bb was added to the error of by root-sum-square for the reduced to achieve unity. | bb was added to the error of by root-sum-square for the reduced to achieve unity. | |||||
| 17 | 300 | bb was added to the error of by root-sum-square for the reduced to achieve unity. | bb was added to the error of by root-sum-square for the reduced to achieve unity. | |||||
| JAVELIN | 49 | — | — | — | ||||
| 17 | — | — | — | |||||
| 17 | 200 | — | — | |||||
| 17 | 300 | — | — | |||||
| 17 | — | bb was added to the error of by root-sum-square for the reduced to achieve unity. | bb was added to the error of by root-sum-square for the reduced to achieve unity. | |||||
| 17 | 200 | bb was added to the error of by root-sum-square for the reduced to achieve unity. | bb was added to the error of by root-sum-square for the reduced to achieve unity. | |||||
| 17 | 300 | bb was added to the error of by root-sum-square for the reduced to achieve unity. | bb was added to the error of by root-sum-square for the reduced to achieve unity. |
Note. — The fitted model is .
| Source | NaaThe number of the data pair for the fitting. | bb is assumed for the fitting when that value is presented. | cc was added to the error of by root-sum-square for the reduced to achieve unity. | Ref. | ||
|---|---|---|---|---|---|---|
| (erg s-1) | ||||||
| near-infrared interferometry | 0.15 | 1 | ||||
| 0.21 | 1 | |||||
| 0.19 | 1 | |||||
| dust reverberationddThe lag times were derived by the two different lag-analysis methods assuming the two different values for the subtraction of the accretion-disk component in the -band flux. The values of and in four rows for each lag-luminosity correlation were obtained from the lag times of , , , and , respectively. | 0.14 | 1 | ||||
| 0.14 | 1 | |||||
| 0.16 | 1 | |||||
| 0.16 | 1 | |||||
| 0.16 | 1 | |||||
| 0.16 | 1 | |||||
| 0.19 | 1 | |||||
| 0.19 | 1 | |||||
| 0.21 | 1 | |||||
| 0.21 | 1 | |||||
| 0.25 | 1 | |||||
| 0.24 | 1 | |||||
| BLR reverberation | — | 2 | ||||
| 0.25 | 1 | |||||
| 0.36 | 1 | |||||
| 0.35 | 3 |
Note. — The fitted model is .