ATP concentration regulates enzyme kinetics
Abstract
Adenosine 5’-triphosphate (ATP) is the nearly ubiquitous “energy currency” of living organisms, and thus is a crucial participant in the majority of enzymatic reactions. The standard models in enzyme kinetics generally ignore the temporal dynamics of ATP because it is assumed to be present in large excess. However, this assumption may not hold in many situations of cellular stress where ATP concentrations may be comparable to substrate levels. Here, we demonstrate the importance of ATP concentration on the dynamics of multi-enzyme reactions by explicit consideration of ATP as a secondary substrate for an enzyme. We apply our model to the mitogen-activated protein (MAP) kinase cascade, which is involved in the regulation of a vast range of cellular activities. We show that three fundamental features of this signaling network — (i) duration of response, (ii) signal amplification, and (iii) ultrasensitivity to stimulus concentration — are all dependent on ATP concentration. Our results indicate that the concentration of ATP regulates the response of the MAP kinase activation network, and potentially suggests another possible mechanism for disruption of the cascade in pathogenic states.
1 Introduction
Information transfer in cellular systems often occurs through biochemical signaling pathways. A representative scheme of such pathways is one where an external stimulus, often a ligand (e.g., a hormone or another small molecule), binds to a cell surface receptor and activates a series of downstream components (likely associated enzymes). This eventually leads to a change in concentration of a second messenger and subsequently transcription factor activation (1, 2, 3).
Mathematical models that represent reaction networks as a series of ordinary differential equations have been successfully used to capture the dynamics of such signaling interactions (4, 5, 2). Perhaps one of the biggest successes in using this approach is that the modeling efforts not only explain the observed experimental time course but also make predictions that can be experimentally tested. These have led to the identification of emergent behavior and motifs in signaling networks (4, 5, 6).
One of the most popularly studied signaling networks is the mitogen-activated protein (MAP) kinase cascade. Huang and Ferrell (7) used mass-action kinetics to explain the ultrasensitive response of this cascade to an external stimulus that they observed in their experiments with Xenopus oocytes. Mathematical modeling also predicted the existence of bistability in MAP kinase activation in response to the MAPK phosphotase concentration (8, 9). This prediction was experimentally verified (10). Likewise, the existence of oscillatory dynamics in response to feedback loops was predicted theoretically (11), and later observed experimentally (12, 13). The MAP kinase cascade is but one prime example of how the power of mathematical modeling can be harnessed to elucidate the properties of biochemical signaling networks (1, 5, 3). Mathematical modeling of reaction networks has thus been the cornerstone of understanding information processing in cellular signaling systems. However, if we are to rely on the predictions of any mathematical model, we must first confirm that we can rely on its assumptions (6).
The standard operating procedure for modeling biochemical signaling networks has been to use mass-action type kinetics to represent binding and stoichiometric reactions and Michaelis-Menten kinetics to describe enzymatic reactions. These approaches have work well, as long as the assumptions underlying these kinetics are satisfied. Mass action kinetics assumes that the concentrations of the reactants are present in large amounts such that the reaction rate is proportional to the concentrations of the reactants. Michaelis-Menten kinetics is derived from mass-action kinetics by enforcing a time scale separation (14). In this study, we relax the assumptions underlying the Michaelis-Menten model and explore the resulting dynamics.
The Michaelis-Menten model is comprised of the following reaction scheme (15):
| (1) |
where E is the enzyme, S is the substrate, and P is the product. This model makes two primary assumptions:
-
•
The conversion of the enzyme-substrate complex to the product and free enzyme is irreversible.
-
•
The concentration of ATP is present in large amounts and therefore can be ignored.
The first assumption violates the principle of detailed balance; to overcome this, enzyme kinetics can be modeled using mass-action kinetic schemes (16). In this case, the concentration of ATP is usually assumed to be saturating and subsumed within the rate constants (17, 14).
Regardless of the choice of kinetic scheme, the above approaches have provided us insight into the relationship between the product concentration and the substrate concentration. However, an open question remains: what happens to enzyme kinetics under different ATP concentrations? In many states of cellular stress, including metabolic distress and apoptosis (18, 19, 20, 21), ATP concentration can be limiting. Experiments have shown that the concentration of ATP can affect the dynamics of several cellular processes, including caspase activation (22), the insulin response (23), and the movement of endocytic vesicles along microtubules (24). Such examples suggest that modeling efforts might need to consider the effect of ATP concentration on dynamics of signaling networks.
In this work, we study the role of ATP concentration in regulating enzyme kinetics. We model enzymes as two-substrate catalysts — the first is the substrate itself, and the second is ATP — to examine the effect of explicit inclusion of ATP in regulating enzyme kinetics. We explore the effects of ATP concentration in simple signaling modules and compare each module outcome with the corresponding Michaelis-Menten response. We then apply our approach to the MAP kinase signaling network and show how the concentration of ATP can influence several significant properties of this kinase cascade.
2 Model Development and Implementation
2.1 Overview and single-enzyme reactions
For a single enzyme catalyzing the conversion of a substrate to a product, the Michaelis-Menten model presumes the simple two-step reaction shown in Equation 1. A physiological requirement for the application of Michaelis-Menten kinetics is that the formation and disassociation of the enzyme-substrate complex E-S is rapid (25), allowing for the quasi-steady-state assumption . This results in the following reaction flux from the substrate to the product:
| (2) |
Here, [S] and [P] are the concentrations (in M) of the substrate and product, respectively; is the Michaelis constant (with units M); and is the maximal flux of the reaction (with units M s-1).
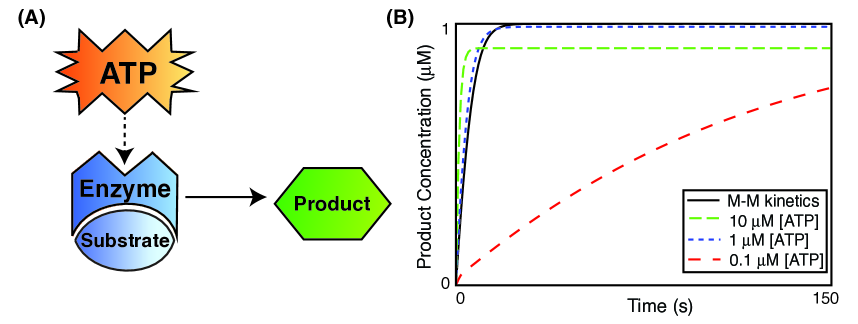
For a single-enzyme catalyzed reaction, we consider ATP explicitly as a second substrate (Figure 1A). To account for both parallel and sequential binding schemes, we allow for both reactions to take place; the full reaction scheme considered is provided in Table S1. The resulting transition complex, E-ATP-S, subsequently releases the product and ADP, thus regenerating the enzyme. Rather than include the details of various metabolic pathways, ATP regeneration is modeled as a single mass-action reaction where ADP and inorganic phosphate combine to form ATP.
2.2 Two-enzyme signaling modules
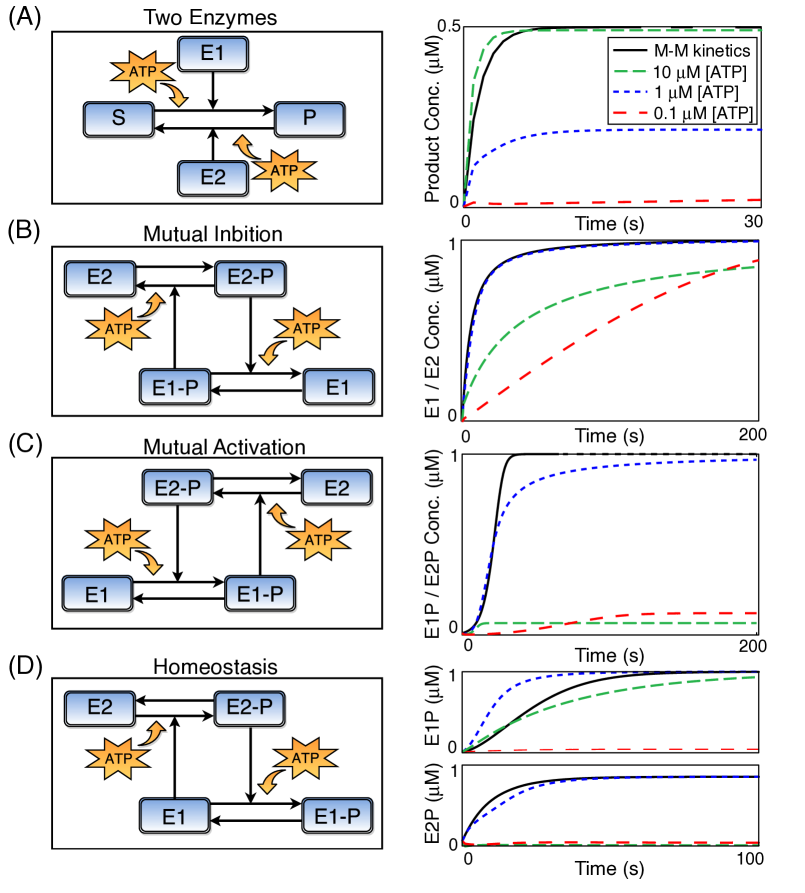
Enzymes do not act in isolation. Therefore, in addition to the single-enzyme catalyzed reaction, we consider several two-enzyme modules that appear frequently in biological signaling networks. Figure 2A depicts a two-enzyme reaction in which one enzyme catalyzes the forward reaction (S P) and the other catalyzes the backward reaction (P S). The schemes depicted in Figure 2B-D are modified from Tyson et al. (26).
Figures 2B and 2C depict two possible forms of positive feedback. In the first, mutual inhibition (Figure 2B), E1 and E2 are mutually antagonistic. That is, each species facilitates the degradation of the species that facilitates its own degradation. The second, mutual activation (Figure 2C), is the more traditionally recognized form of a positive feedback loop: each species helps generate the species that aids its generation. An example of negative feedback is homeostasis (Figure 2D) where a species (E2P) facilitates the degradation of the enzyme (E1) responsible for its generation. Full reaction schemes used for the above modules are shown in Tables S2 - S5.
2.3 MAP kinase activation network
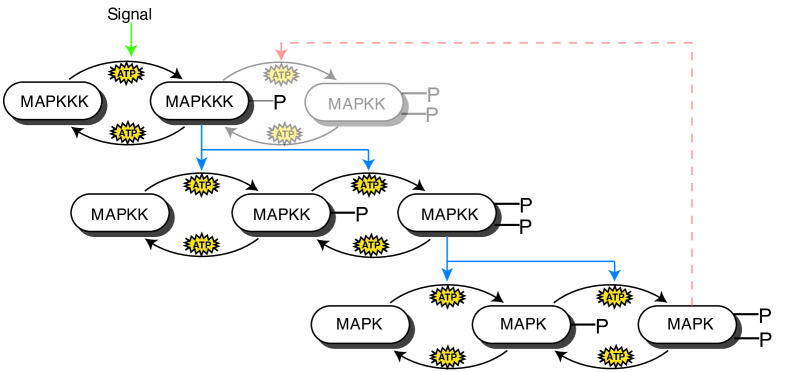
The mitogen-activated protein kinase (MAP kinase) cascade is a signaling cascade consisting of three kinases: MAPK kinase kinase (MAPKKK, KKK, or Raf), MAPK kinase (MAPKK, KK, or MEK), and MAPK (K or Erk) . A stimulus (either a small GTP-binding protein such as Ras or another kinase such as PKC) activates MAPKKK to initiate the cascade. Singly phosphorylated MAPKKK (MAPKKK-P or MAPKKK*) activates MAPKK by phosphorylation at two serine residues, and doubly phosphorylated MAPKK (MAPKK-PP or MAPKK**) activates MAPK by phosphorylation at threonine and tyrosine residues (27, 7, 28, 29).
Though its basic structure is highly conserved, the MAPK signaling cascade is associated with a large variety of biological responses. Consequently, this network has spurred the development of several mathematical models, the most well-known of which was developed by Huang and Ferrell (7) to describe MAPK activation in Xenopus oocytes. Bhalla and Iyengar (4) also considered the MAPK network in their study of second messenger cascades in neurons. Their model contains a negative feedback loop in addition to the Huang and Ferrell’s proposed model: MAPK** inhibits the cascade by doubly phosphorylating MAPKKK*.
Figure 3 provides an overview of the various phosphorylation and dephosphorylation events involved in the network. The feedback loop described by Bhalla and Iyengar is shown in light gray. Initial concentrations and kinetic parameters are taken from Bhalla and Iyengar (4). As their model assumed Michaelis-Menten kinetics, we chose mass-action kinetic parameters ( and ) for each module of the network which best matched the corresponding Michaelis constants while maintaining realistic physiological responses for the overall cascade. Reaction schemes and kinetic parameters used for the base model by Huang and Ferrell (7) are shown in Table LABEL:table:mapk; Table LABEL:table:mapkfb describes the additional feedback module from Bhalla and Iyengar (4).
2.4 Implementation
All reactions were modeled using mass action kinetics and the resulting ordinary differential equations were solved using the stiff solvers ‘ode15s’ and ‘ode23s’ routines in MATLAB (Mathworks, Natick, MA). For comparison, we also constructed and simulated Michaelis-Menten kinetics for the single-enzyme reaction in Figure 1 and for all the modules shown in Figure 2.
For all the signaling modules, we set rates such that all “forward” reactions are significantly faster than the associated reverse reactions. To further destabilize the transition complex, we multiply the forward reaction rate for its disassociation in all modules by . Kinetic parameters used for each module are provided in the corresponding Supplementary tables. All MATLAB code will be made available on request. Kinetic parameters for the MAP kinase reaction network were chosen as described above (4).
3 Effect of ATP concentration on independent signaling modules
In the following sections, we explore the effect of ATP concentration on independent motifs which are commonly found nested within large signaling networks. In particular, we characterize how limiting energy in the form of low ATP concentration can lead to non-Michaelis-Menten kinetics under various network topologies (e.g., systems with positive or negative feedback).
3.1 Reversible reactions catalyzed by one or two enzymes
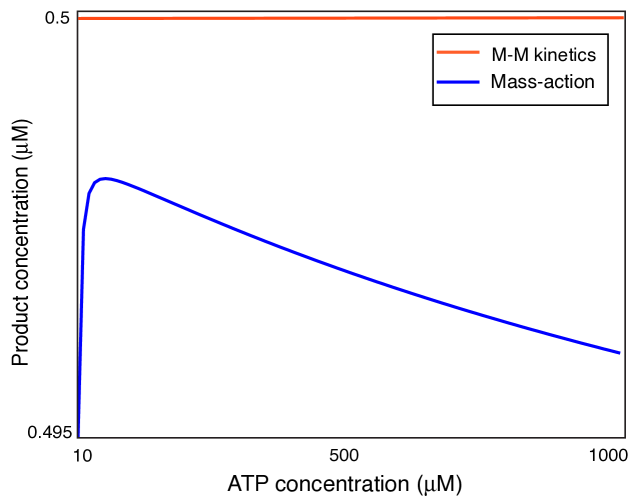
We first consider a reversible reaction involving catalysis by either a single enzyme or by two enzymes. In the single-enzyme case, the enzyme acts only in the forward direction (S P), but all reactions follow the law of mass action, and are reversible. This is in contrast to the Michaelis-Menten model, where the reverse reaction rate for the scheme E-S P + E is set to 0. This is clear from the time course for Michaelis-Menten kinetics (Figure 1B, solid black line): the product is formed until all substrate is converted.
When ATP is explicitly considered, we find that an ATP concentration on the same order of magnitude as the initial substrate concentration (the timecourse for [ATP] = [S] = 1 M is shown by a blue line in Figure 1B) matches Michaelis-Menten kinetics quite well (though the equilibrium value falls short of the Michaelis-Menten equilibrium value of 1 M). When ATP is limiting ([ATP] = 0.1 M, shown by the red line in Figure 1) the reaction proceeds far more slowly and takes significantly longer to reach equilibrium. When ATP is available in excess ([ATP] = 10 M, shown by the green line in Figure 1), the equilibrium value of formed product is lower than that observed for mid-range ATP concentrations, though the time to reach equilibrium is shorter.
The monotonic decrease in time to equilibrium with increase in ATP concentration is an expected feature of mass action kinetics: a high ATP concentration leads to a rapid formation of the transition complex, and consequently to a faster formation of product. The lower equilibrium value of product in environments with excess ATP compared to the Michaelis-Menten equilibrium is due to the inclusion of a reverse reaction for the complex dissociation (see Tables S1 and S2). While the Michaelis-Menten kinetic scheme faithfully reproduces the dynamics of many equilibrated chemical systems, it does not uphold the principle of detailed balance: the formation of product is not balanced by any reverse reaction (16). Removing this irreversibility assumption results in a non-zero concentration of substrate complexes at equilibrium. Furthermore, as the sequestration of enzyme in complexes (e.g., the transition complex or E-ADP) is ignored by Michaelis-Menten kinetics, a slight decrease in production past some “optimal” ATP concentration is also observed in the full mass-action system.
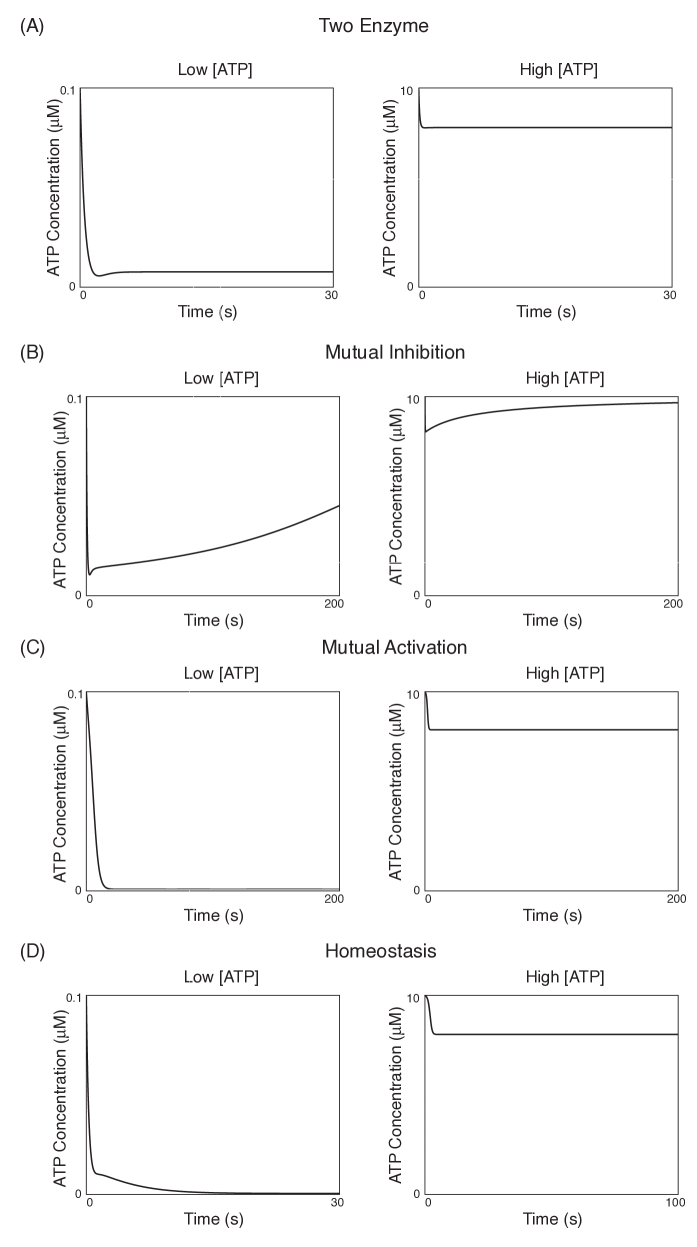
We further consider an extension of the same reversible reaction, where both the forward (S P) and backward (P S) reactions are catalyzed by two distinct enzymes, E1 and E2. Given symmetry of the forward and backward reactions, Michaelis-Menten kinetics result in equal equilibrium concentrations of substrate and product in this system (the time course for the generation of product is shown by the black line in Figure 2A). When ATP is explicitly considered, we observed that the time to equilibrium decreases with increasing ATP levels, as in the single-enzyme model.
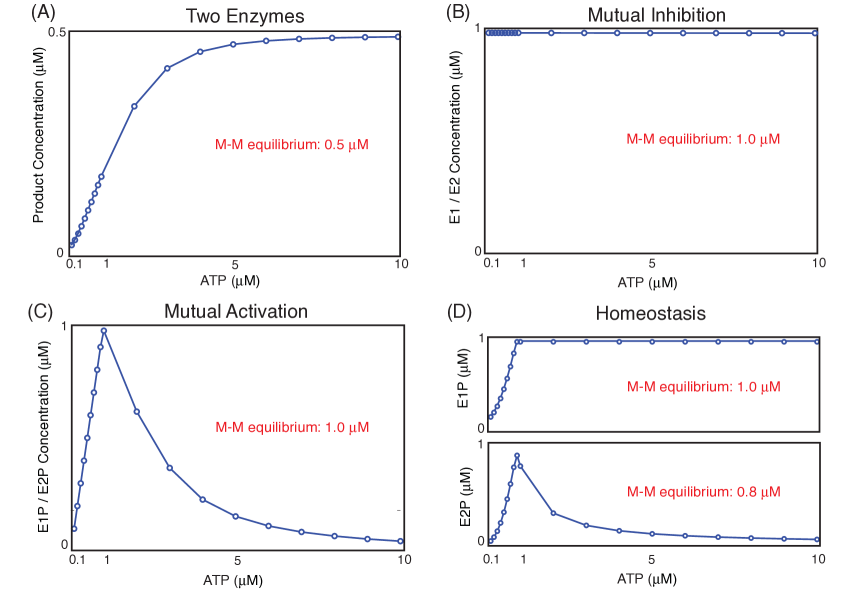
Similarly to the single-enzyme case, Michaelis-Menten kinetics always result in higher concentrations at equilibrium of the products of both reactions (here, S and P) relative to the full mass action system. However, in contrast to the single-enzyme case, our chosen “medium” level of ATP (equal to that of the initial substrate concentration, [ATP] = [S] = 1 M) is not sufficient to elicit the full response of the system. Figure 4 shows the equilibrium concentration of the “product” of each module as a function of ATP concentration; simulations were run for 20,000 s to ensure equilibration. As shown in Figure 4A, the system response saturates only at an ATP concentration of approximately 8 M. As ATP levels rise even further, the system response decreases, albeit slightly, just as in the single-enzyme system (see Figure S1 in the Supplementary Material). As seen previously, due to complex formation and lack of turnover, even the maximum response of the reversible system is lower than that of the Michaelis-Menten model (Figure 4). This over-prediction of system response by Michaelis-Menten kinetics due to sequestration has been observed experimentally as well (30).
3.2 Mutual inhibition and mutual activation
Figures 2B and 2C show two examples of simple positive feedback modules involving the phosphorylation and dephosphorylation of two enzymes. In Figure 2B (mutual inhibition), the phosphorylated version of each enzyme catalyzes the dephosphorylation of the other—each species depletes the species that depletes it. Figure 2C (mutual activation) is an example of more “traditional” positive feedback: each phosphorylated enzyme stimulates the phosphorylation of the other—each species generates the species that generates it.
For both systems, the dynamics associated with a medium ATP concentration ([ATP] = 1 M) are most in line with that of the Michaelis-Menten model. As seen previously, Michaelis-Menten kinetics overestimate the conversion to product in reversible systems. However, we find that the equilibrium value of dephosphorylated enzyme—the “product”—is independent of ATP concentration (Figure 4B) for mutual inhibition. In contrast, the equilibrium concentration of product of mutual activation (phosphorylated enzyme) appears dependent on the concentration of ATP (Figure 4C). Note that as the two reactions within each module are symmetric, the dynamics associated with both enzymes are equivalent.
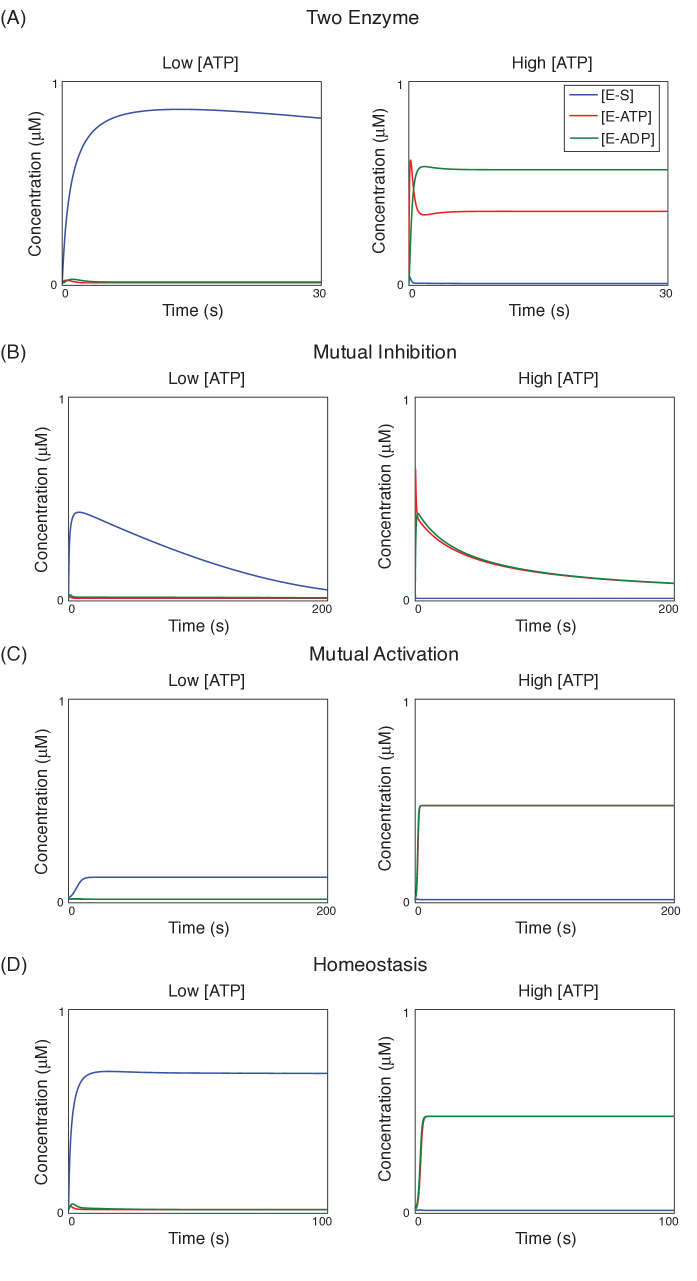
This discrepancy arises from two differences between the two schemes. Firstly, the mutual inhibition motif is comprised of two dephosphorylation reactions, while mutual activation is comprised of two phosphorylations. The regular release of inorganic phosphate during the time course of mutual inhibition results in rapid recycling of ATP. When ATP concentration is low, the lack of recycling in the mutual activation module results in fast depletion of ATP (see Figure S2 in the Supplementary Material). Secondly, the products of the forward (i.e., enzyme-catalyzed) reactions in the mutual inhibition module are the dephosphorylated enzymes E1 and E2, which do not form complexes with ATP. In contrast, the forward reactions in the “mutual activation” module are phosphorylations, which result in the production of the catalysts E1P and E2P. These products are promptly sequestered in complexes with ATP and ADP (see Figure S3 in the Supplementary Material). A study on the molecular chaperone GroEL under saturating ATP conditions found that the rate of ADP release is important in determining the rate of generation and equilibrium concentration of product (30).
However, while the equilibrium concentration of the product may be largely independent of ATP concentration, the convergence time to equilibrium is not: ATP concentrations higher and lower than 1 M result in a slower convergence to equilibrium (Figure 2B). With low initial ATP concentrations, cycling assures that there is a constant (albeit shallow) energy pool for reactions to continue. However, the maintained concentration of ATP is too low for a speedy convergence to equilibrium. When ATP concentration is very high, a signifiant portion of the enzyme very quickly becomes isolated in complexes, particularly E-ADP (Figure S3), and the slow breakdown of these complexes contributes to a slower convergence to equilibrium. Though the lower, “optimal” concentrations of ATP also result in the formation of such complexes, the initial amounts formed are significantly lower than with excess ATP, allowing for the presence of more free enzyme to continue catalysis.
3.3 Homeostasis
In contrast to the first two signaling modules considered, Figure 2D depicts a case of negative feedback (homeostasis): enzyme E2P phosphorlyates (and thus deactivates) E1, the catalyst for its creation. In the right panel of the figure, we show time courses for both E1P and E2P; because, unlike the other modules, the two reactions are not symmetric. Because it suppresses its own production, Michaelis-Menten kinetics predict slower dynamics and a lower equilibrium value for E2P as compared to other modules (Figure 2D).
The equilibrium concentrations for E2P for higher and lower ATP concentrations are significantly lower than that observed for mid-range ATP levels. This is once again due to isolation of enzyme in complex form (for high initial ATP) and rapid energy depletion (for low initial ATP). Interestingly, however, mid-range energy levels, result in higher equilibrium concentrations of E2P than predicted by the Michaelis-Menten model (Figure 4D).
The saturation of E2P is due to the conversion of E1 to E1P, as is shown in the time course of the reactions (Figure 2D). In the reversible model, however, a (small) subset of E1 sequestered in complex form continues to facilitate the conversion of E2 to E2P. This sequestration and subsequent slow release of free enzyme results in a long period of low influx into a small but non-negligible pool of catalytic units. Since such accumulation of complex is neglected in Michaelis-Menten kinetics, the E2P equilibrium concentration predicted by assuming irreversibility is actually lower than in the full reversible model at certain ATP concentrations. This suggests that, while in most cases, sequestration of enzyme simply results in equilibrium concentrations that are lower than expected, it may result in other indirect effects in certain network topologies (31).
4 Effect of ATP Concentration on the MAP Kinase Cascade
Biological signaling networks are composed of many modules. It is often the interplay between these modules within a highly organized structure that is responsible for the observed characteristics of a system. A prime example of this is the MAP kinase cascade, a signaling network that has been extensively studied both experimentally and theoretically because of its unique emergent properties. In their seminal work, Huang and Ferrell (7) identified the ultrasensitivity in this cascade. Subsequently, this network has been shown to have bistability in the presence of a feedback loop (4, 11). While there have been extensive mathematical models of epidermal growth factor (EGF) and other agonist-induced stimulation of the MAP kinase cascade, the role of ATP in facilitating the cascade has not been explicitly considered. In the following, we are concerned with how the concentration of ATP affects the signaling characteristics of MAP kinase activation. Specifically, we study three fundamental properties of this ubiquitous network: (i) time course and duration of response, (ii) ultrasensitivity, and (iii) signal amplification (32).
4.1 Time course and duration of MAPK activation
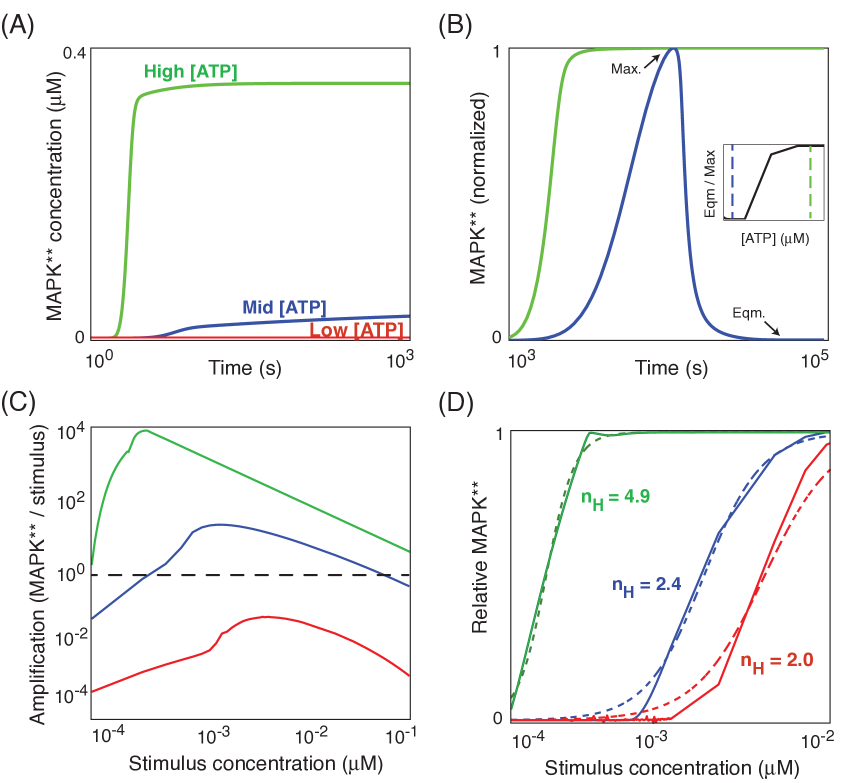
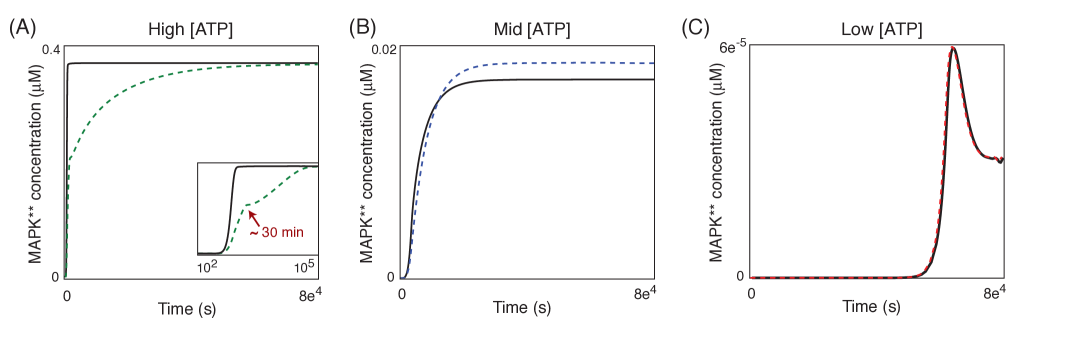
Since there are multiple sequential steps involved in the MAP kinase cascade, the time between the application of signal and the appearance of activated MAPK is not negligible. Figure 5A shows time courses for activated MAPK (i.e., MAPK**) after the application of a strong stimulus ([E = 0.1 M). The amplitude of the response increases with ATP concentration, while the time to maximal response decreases as ATP levels rise. Additionally, the steepness of the response increases with ATP concentration; at the highest ATP concentration considered, the activation of MAPK is more switch-like than in lower ATP environments.
Several mechanisms for dynamic temporal regulation have been suggested to act on the MAP kinase cascade; for an overview, we refer the reader to several excellent reviews on the topic (1, 33, 2, 3). Here, we considered how regulation by the negative feedback loop proposed by Bhalla and Iyengar (4) is affected by ATP concentration. In this feedback system, activated MAPK doubly phosphorylates MAPKKK*, stripping it of its catalytic abilities and down-regulating the cascade. The components of this regulatory loop are shown in faded grey in Figure 3.
When the feedback is applied at the strength proposed by Bhalla and Iyengar (4), it is effective only when ATP concentration is high; at lower concentrations, little discernible difference in the time course was observed (see Figure S4 in the Supplementary Material). At a lower signal strength, we also found that strengthened feedback resulted in a transient activation of MAPK, as opposed to a sustained response when feedback was not present (Figure S5).
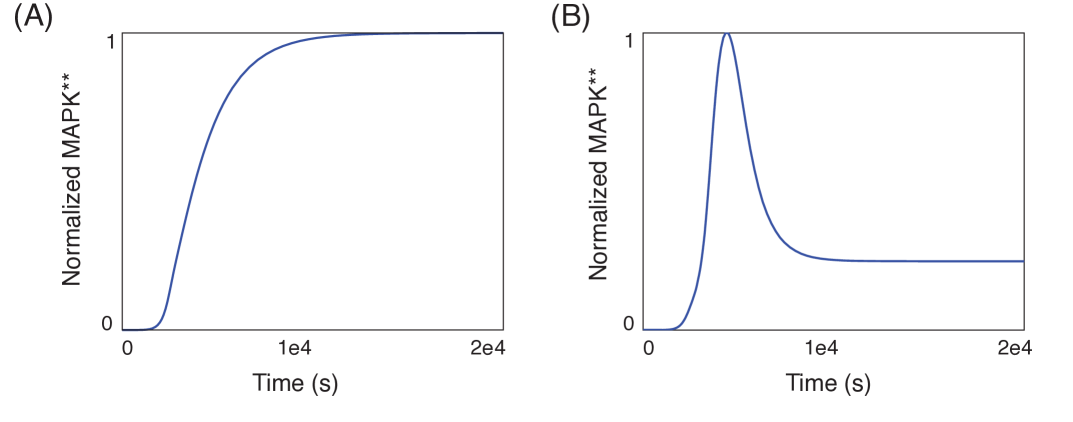
The transition between transient and sustained activation has been shown to occur in a switch-like manner with respect to signal strength (33). However, transient responses were also obtained without feedback for stronger, persistent signals when ATP concentration was low (see Figures 5B and S4C). Furthermore, we observed that the shift from a transient to sustained response is sharp with respect to ATP concentration as well (see inlay of Figure 5B). This may point to another method to achieve specificity in MAPK pathways (34). This transition in particular has been famously implicated in cell fate decisions: transient activation of MAPK by EGF leads to cell proliferation, while sustained activation in response to nerve growth factor leads to cell differentiation (35).
4.2 Amplification
As mentioned above, a common objective of signaling cascades is stimulus amplification. Figure 5C shows the system amplification (calculated as the ratio of the concentrations of MAPK** to E1) as a function of stimulus concentration. Maximal amplification in the Michaelis-Menten model (apparent Hill coefficient, ) is achieved in the case of a low saturated kinase, while in more sigmoidal responses () maximal amplification occurs near K10, the stimulus concentration generating 10% of the maximum response (36). The peak amplificiation is found approximately at this point for all three ATP concentrations considered ([ATP] M, 0.2 M, and 0.05 M; shown in green, blue, and red in Figure 5C, respectively).
In principle, a three-tiered cascade can generate an immense degree of signal amplification; that is, a very small concentration of signal (here E1) can bring about a far larger concentration of activated MAPK** (37, 32). Indeed, when ATP concentration is sufficiently high (green line, Figure 5C), we see that the MAPK** concentration can be over 10,000 times that of the input stimulus.
In practice, however, such high amplification is not necessary and is rarely observed—most experimental studies find approximately a 10- to 30-fold response relative to stimulus (38, 29, 39, 40). Under high ATP concentrations, this range of amplification occurs when the stimulus concentration is relatively high compared to the concentration of kinase, which is often the case in experiments (7, 38). However, at mid-range ATP concentrations (blue line, Figure 5C; [ATP] M [kinase]), the amplification observed in physiological systems is very close to the maximum that can be obtained, leaving far less room for error in stimulus concentration. Furthermore, in an ATP-limited environment (red), the cascade fails to amplify any input, regardless of signal strength.
4.3 Ultrasensitivity
While the most intuitive function of the MAP kinase cascade is signal amplification, its crucial involvement in cellular decision-making processes such as cell cycle control and cell fate induction points to another fundamental feature: the generation of a ultrasensitive switch-like response to stimuli (41, 36). In Xenopus oocytes, MAP kinase cascade indeed acts as an all-or-none switch. Huang and Ferrell (7) predicted that MAP kinase activation was best predicted by a Hill coefficient of approximately 5, a robust result which holds for a large range of kinetic parameters. However, both their model calculations and experiments were performed with ATP at constant concentration (i.e., abundantly available such that depletion could be considered negligible).
At high ATP concentrations, our simulations confirm their results ([ATP] = 0.6 M, shown in green in Figure 5D), producing a stimulus-response curve comparable to a Hill curve with . Apparent Hill coefficients were calculated as
| (3) |
where K90 and K10 denote the stimulus concentrations that generate 90% and 10% of the maximum system response, respectively (36). Note that both K90 and K10, as well as their ratio, vary with ATP concentration (Figure 5C). However, at lower ATP concentrations ([ATP] = 0.2 M and 0.05 M, respectively shown in blue and red in Figure 5D), we observed a significant decrease in the apparent Hill coefficient, indicating a steady decay of the all-or-none response to a more graded one. Zero-order ultrasensitivity has been found to be partially responsible for the switch-like response of the MAP kinase network (7, 42). This mechanism is observed only when the enzyme is operating near saturation—that is, when [S] [E] (43). Because ATP acts as a secondary substrate, our observed decline of the all-or-none response in the MAP kinase cascade with ATP concentration may be attributed to the loss of the contribution from zero-order ultrasensitivity.
5 Discussion
Organisms respond to their environment by performing computations through signaling networks in response to mechanical or chemical stimuli. Due to the incredible complexity of these computations, mathematical models of reaction networks often employ certain simplifications in order to generate interpretable results. One such model, the Michaelis-Menten scheme, has stood the test of time to emerge as the standard model in enzyme kinetics—many scientific articles provide values for the Michaelis constant , with little or no mention of the traditional kinetic constants from elementary mass-action (15).
However, while Michaelis-Menten kinetics quite faithfully reproduce the equilibrium dynamics of many enzymatic processes, we must be acutely aware of the assumptions used to derive it. In particular, the Michaelis-Menten model relies crucially on time-scale separation: we must assume that the formation of enzyme-substrate complex and the subsequent release of product and free enzyme occur so rapidly that the amount of sequestered enzyme is negligible (14). Furthermore, the standard Michaelis-Menten model assumes that secondary substrates (e.g., ATP) are available in excess so as not to be rate-limiting; their dynamics are generally ignored along with those of the enzyme.
The removal of this “single-substrate enzyme” approximation, however, immediately calls into question the near-universal application of Michaelis-Menten kinetics: if ATP (or any other secondary substrate) is required for formation of the transition complex E-ATP-S and subsequent release of product, then it must play a crucial role in enzyme kinetics. In particular, ATP is not always abundant in the cellular milieu (44, 20, 23), which can lead to the sequestration of a non-negligible amount of enzyme in E-S complex form. Such sequestration, unsurprisingly, results in a time course that diverges significantly from that predicted by Michaelis-Menten kinetics (45). For instance, lack of ATP cycling results in the isolation of enzyme in E-ADP complexes and a consequent decrease in the amount of activated target from predicted values (30).
At this point, it is good to note an important assumption made in our model. Throughout this paper, we have utilized the principle of mass-action. That is, we have assumed that the dynamics considered involve concentrations that are adequately characterized by large molecular particle numbers. Assuming a local volume of 1 L, even a concentration of 10M (far lower than any we have considered in this paper) corresponds to approximately 60,000 molecules. However, inclusion of randomness is a natural step towards understanding any biological system. In particular, an analysis of the effect of ATP concentration on the noise-filtering ability of an enzyme cascade would be interesting given our results on the deterioration of ultrasensitivity in the MAP kinase network with decreasing ATP levels (46, 47) and will be explored in a future work.
Despite the immense complexity of most signaling networks, several simple motifs and pathways often serve as biochemical “building blocks”, and are conserved and used across molecular functions and cell types. In this paper, we have examined the role of ATP concentration in modulating the dynamics of enzymatic processes under some of these common network topologies. We surprisingly find that, while limiting ATP concentrations usually result in a lowered or delayed system response, certain network structures (e.g., the negative feedback module shown in Figure 2D) may be able to exploit a small range of “medium” ATP concentrations to increase their output relative to the system response in ATP-rich environments.
Such bidirectional regulation by ATP concentration, where both low and high ATP levels result in reduced function, has been observed in several cellular processes, including dynein walking (48) and the ubiquitin-proteasome system (49). In the latter, the basal level of ATP was shown to constitutively repress proteasome function, allowing for the upregulation of the proteasome at ATP concentrations characteristic in cellular stress (10-100 M). This upregulation has also been implicated in pathogenesis. For instance, muscle wasting observed in acute respiratory distress syndrome (ARDS) is linked to increased proteasome activity (50, 51). Furthermore, this regulatory role of ATP suggests that raising intracellular ATP concentration may inhibit proteasome activity in cancer cells. This could serve as an alternative treatment to pharmacological inhibitors, which often have negative side effects (52). Our results point to one possible mechanism underlying the bidirectional control of ATP concentration on protein activity.
We further explored the effect of ATP concentration on the MAP kinase cascade, a signaling module which is activated in response to almost any extra- or intracellular stimulus. Our results suggest that the ATP concentration modulates at least three fundamental properties of the cascade: (i) duration of the response, (ii) signal amplification, and (iii) ultrasensitivity with respect to stimulus concentration. The duration and amplitude of activation have been shown computationally to be sensitive to changes in the phosphatase reactions at the MAPKK and MAPK level, respectively (32). As ATP is involved in reactions at all levels, it is not surprising that these properties are dependent on its concentration.
In contrast, ultrasensitivity has been previously shown to be robust to a wide range of kinetic parameters under the assumption of constant ATP concentration (7). We found, however, that this switch-like response to stimulus concentration fades into a more graded one as ATP concentration decreases. As ATP is a substrate of the reaction, enzymes operate at saturation only when the ATP concentration is high (a prerequisite for zero-order ultrasensitivity). Furthermore, as our model considers reversible mass-action kinetics, the sequestration of enzyme and substrate in complex form results in a further loss of zero-order ultrasensitivity (8, 45). Our results suggest that ATP concentration may serve as another possible mechanism for MAPK regulation in normal cells, or for disruption of the cascade in pathological states.
Thus far, we have assumed that all enzymes have equivalent access to ATP. Signaling pathways are highly compartmentalized, with certain receptors bound to membrane and others freely floating in the cytosol. For instance in the MAPK cascade, kinases are membrane-bound, associated with scaffolding proteins, while phosphatases are cytosolic (53). As the individual steps of the cascade have been associated independently with certain observed system properties (32), the regulatory effects of heterogenous ATP distribution are certainly worth exploring.
ACKNOWLEDGMENTS
We would like to thank the American Institute of Mathematics for organizing and inviting us to participate in their 2013 workshop, “Mathematical problems arising from biochemical reaction networks”. The idea of exploring the role of ATP concentration in enzyme reactions arose from discussions during this workshop. We also acknowledge funding from an NSF IGERT from the CiBER center at UC Berkeley (to J.A.N.) and the University of California Chancellor’s Postdoctoral Fellowship (to P.R.).
Supplementary Material
Tables
For all modules, the units for and must be such that (where has units M s-1) is balanced. Here, and denote reactant and product species and and denote their respective balanced coefficients. For example, if a reaction has two reactants and one product species, has units M-1 s-1 and has units s-1. Likewise, if a reaction has one reactant and two (three) products,
has units s-1 and has units M-1 s-1 (M-2 s-1).
All initial concentrations that are not provided are set to .
| Initial concentrations (all in M): [E] = 1; [S] = 1; [P] = 0; [Ph] = [ATP] | |||
|---|---|---|---|
| Reaction | k | k | Notes |
| E + S E-S | 1.0 | 0.2 | Enzyme binds substrate |
| E + ATP E-ATP | 1.0 | 0.2 | Enzyme binds ATP |
| E-ATP + S E-ATP-S | 1000 | 0.2 | Enzyme-ATP complex binds substrate |
| E-S + ATP E-ATP-S | 1.0 | 0.2 | Enzyme-substrate complex binds ATP |
| E-ATP-S E-ADP + P + | 1.0 | 0.2 | Catalysis; product is released |
| E-ADP E + ADP | 1.0 | 0.2 | Disassociation of ADP from enzyme |
| E-ATP E-ADP + | 1.0 | 0.2 | Autocatalysis |
| ATP ADP + | 1.0 | 0.2 | Regeneration of ATP (metabolism) |
| Michaelis-Menten parameters: ; | |||
| Initial concentrations (all in M): [E1] = [E2] = 1; [S] = 1; [P] = 0; [Ph] = [ATP] | |||
|---|---|---|---|
| Reaction | k | k | Notes |
| E1 + S E1-S | 0.001 | 1e-4 | Enzyme 1 binds substrate |
| E1 + ATP E1-ATP | 0.001 | 1e-4 | Enzyme 1 binds ATP |
| E1-ATP + S E1-ATP-S | 0.001 | 1e-4 | Enzyme-ATP complex binds substrate |
| E1-S + ATP E1-ATP-S | 0.001 | 1e-4 | Enzyme-substrate complex binds ATP |
| E1-ATP-S E1-ADP + P + | 1.0 | 1e-4 | Catalysis; product is released |
| E1-ADP E1 + ADP | 0.001 | 1e-4 | Disassociation of ADP from Enzyme 1 |
| E1-ATP E1-ADP + | 0.001 | 1e-4 | Autocatalysis |
| E2 + P E2-P | 0.001 | 1e-4 | Enzyme 2 binds product of first reaction |
| E2 + ATP E2-ATP | 0.001 | 1e-4 | Enzyme 2 binds ATP |
| E2-ATP + P E2-ATP-P | 0.001 | 1e-4 | Enzyme-ATP complex binds “product” |
| E2-P + ATP E2-ATP-P | 0.001 | 1e-4 | Enzyme-“product” complex binds ATP |
| E2-ATP-P E2-ADP + S + | 1.0 | 1e-4 | Catalysis; original substrate is released |
| ATP ADP + | 0.001 | 1e-4 | Regeneration of ATP (metabolism) |
| Michaelis-Menten parameters: ; | |||
| Initial concentrations (all in M): [E1P] = [E2P] = 0.99; [E1] = [E2] = 0.01; [Ph] = [ATP] | |||
|---|---|---|---|
| Reaction | k | k | Notes |
| E1P + E2P E1P-E2P | 1.0 | 1e-4 | Enzyme 1 binds substrate |
| E1P + ATP E1P-ATP | 1.0 | 1e-4 | Enzyme 1 binds ATP |
| E1P-ATP + E2P E1P-ATP-E2P | 1.0 | 1e-4 | Enzyme-ATP complex binds substrate |
| E1P-E2P + ATP E1P-ATP-E2P | 1.0 | 1e-4 | Enzyme 1-substrate complex binds ATP |
| E1P-ATP-E2P E1P-ADP + E2 + 2 | 1000 | 1e-4 | Catalysis; product is released |
| E1P-ADP E1P + ADP | 1.0 | 1e-4 | Disassociation of ADP from Enzyme 1 |
| E1P-ATP E1P-ADP + | 1.0 | 1e-4 | Autocatalysis |
| E2P + E1P E2P-E1P | 1.0 | 1e-4 | Enzyme 2 binds substrate |
| E2P + ATP E2P-ATP | 1.0 | 1e-4 | Enzyme 2 binds ATP |
| E2P-ATP + E1P E2P-ATP-E1P | 1.0 | 1e-4 | Enzyme2-ATP complex binds substrate |
| E2-P + ATP E2P-ATP | 1.0 | 1e-4 | Enzyme-substrate complex binds ATP |
| E2-ATP-E1P E2-ADP + E1 + 2 | 1000 | 1e-4 | Catalysis; product is released |
| ATP ADP + | 1.0 | 1e-4 | Regeneration of ATP (metabolism) |
| Michaelis-Menten parameters: ; | |||
| Initial concentrations (all in M): [E1P] = [E2P] = 0.01; [E1] = [E2] = 0.99; [Ph] = [ATP] | |||
|---|---|---|---|
| Reaction | k | k | Notes |
| E1P + E2 E1P-E2 | 0.001 | 1e-4 | Enzyme 1 binds substrate |
| E1P + ATP E1P-ATP | 0.001 | 1e-4 | Enzyme 1 binds ATP |
| E1P-ATP + E2 E1P-ATP-E2 | 0.001 | 1e-4 | Enzyme-ATP complex binds substrate |
| E1P-E2 + ATP E1P-ATP-E2 | 0.001 | 1e-4 | Enzyme 1-substrate complex binds ATP |
| E1P-ATP-E2 E1P-ADP + E2P | 1.0 | 1e-4 | Catalysis; product is released |
| E1P-ADP E1P + ADP | 0.001 | 1e-4 | Disassociation of ADP from Enzyme 1 |
| E1P-ATP E1P-ADP + | 0.001 | 1e-4 | Autocatalysis |
| E2P + E1 E2P-E1 | 0.001 | 1e-4 | Enzyme 2 binds substrate |
| E2P + ATP E2P-ATP | 0.001 | 1e-4 | Enzyme 2 binds ATP |
| E2P-ATP + E1 E2P-ATP-E1 | 0.001 | 1e-4 | Enzyme2-ATP complex binds substrate |
| E2P-E1 + ATP E2P-ATP-E1 | 0.001 | 1e-4 | Enzyme-substrate complex binds ATP |
| E2-ATP-E1 E2-ADP + E1P | 1.0 | 1e-4 | Catalysis; product is released |
| ATP ADP + | 0.001 | 1e-4 | Regeneration of ATP (metabolism) |
| Michaelis-Menten parameters: ; | |||
| Initial concentrations (all in M): [E1] = [E2] = 0.9; [E1P] = [E2P] = 0.1; [Ph] = [ATP] | |||
|---|---|---|---|
| Reaction | k | k | Notes |
| E1 + E2 E1-E2 | 1.0 | 1e-4 | Enzyme 1 binds substrate |
| E1 + ATP E1-ATP | 1.0 | 1e-4 | Enzyme 1 binds ATP |
| E1-ATP + E2 E1-ATP-E2 | 1.0 | 1e-4 | Enzyme-ATP complex binds substrate |
| E1-E2 + ATP E1-ATP-E2 | 1.0 | 1e-4 | Enzyme 1-substrate complex binds ATP |
| E1-ATP-E2 E1-ADP + E2P | 1000 | 1e-4 | Catalysis; product is released |
| E1-ADP E1 + ADP | 1.0 | 1e-4 | Disassociation of ADP from Enzyme 1 |
| E1-ATP E1-ADP + | 1.0 | 1e-4 | Autocatalysis |
| E2P + E1P E2P-E1P | 1.0 | 1e-4 | Enzyme 2 binds substrate |
| E2P + ATP E2P-ATP | 1.0 | 1e-4 | Enzyme 2 binds ATP |
| E2P-ATP + E1 E2P-ATP-E1P | 1.0 | 1e-4 | Enzyme2-ATP complex binds substrate |
| E2-P + ATP E2P-ATP | 1.0 | 1e-4 | Enzyme-substrate complex binds ATP |
| E2-ATP-E1P E2-ADP + E1 + | 1000 | 1e-4 | Catalysis; product is released |
| ATP ADP + | 1.0 | 1e-4 | Regeneration of ATP (metabolism) |
| Michaelis-Menten parameters: ; | |||
| Initial concentrations (all in M): [E2] = 0.224; [E3] = 0.0032; [KKK] = 0.2; [KK] = 0.18; [K] = 0.36; [Ph] = [ATP] | |||
|---|---|---|---|
| Reaction | k | k | Notes |
| Metabolism | |||
| ATP ADP + | 1.0 | 0.001 | Regeneration of ATP (metabolism) |
| KKK phosphorylation | |||
| E1+ KKK E1-KKK | 0.04 | 0.001 | Enzyme binds substrate |
| E1 + ATP E1-ATP | 0.04 | 0.001 | Enzyme binds ATP |
| E1-ATP + KKK E1-ATP-KKK | 0.04 | 0.001 | Enzyme-ATP complex binds substrate |
| E1-KKK + ATP E1-ATP-KKK | 0.04 | 0.001 | Enzyme-substrate complex binds ATP |
| E1-ATP-KKK KKK-P + E1-ADP | 0.04 | 1e-30 | KKK is phosphorlyated |
| E1-ADP E1 + ADP | 0.04 | 1e-30 | Enzyme is regenerated |
| KKK-P dephosphorylation | |||
| E2 + KKK-P E2-KKK-P | 0.1 | 0.001 | Enzyme binds substrate |
| E2 + ATP E2-ATP | 0.1 | 0.001 | Enzyme binds ATP |
| E2-ATP + KKK-P E2-ATP-KKK-P | 0.1 | 0.001 | Enzyme-ATP complex binds substrate |
| E2-KKK-P + ATP E2-ATP-KKK-P | 0.1 | 0.001 | Enzyme-substrate complex binds ATP |
| E2-ATP-KKK-Pi KKK + E2-ADP + 2Pi | 0.1 | 1e-30 | KKK-P is dephosphorlyated |
| E2-ADP E2 + ADP | 0.1 | 1e-30 | Enzyme is regenerated |
| KK mono-phosphorylation | |||
| KKK-P+ KK KKK-P-KK | 1.0 | 0.001 | Enzyme binds substrate |
| KKK-P + ATP KKK-P-ATP | 1.0 | 0.001 | Enzyme binds ATP |
| KKK-P-ATP + KK KKK-P-ATP-KK | 1.0 | 0.001 | Enzyme-ATP complex binds substrate |
| KKK-P-KK + ATP KKK-P-ATP-KK | 1.0 | 0.001 | Enzyme-substrate complex binds ATP |
| KKK-P-ATP-KK KK-P + KKK-P-ADP | 1.0 | 1e-30 | KK is phosphorlyated |
| KKK-P-ADP KKK-P + ADP | 1.0 | 1e-30 | Enzyme is regenerated |
| KK-P dephosphorylation | |||
| E2+ KK-P E2-KK-P | 0.01 | 0.001 | Enzyme binds substrate |
| E2-ATP + KK-P E2-ATP-KK-P | 0.01 | 0.001 | Enzyme-ATP complex binds substrate |
| E2-KK-P + ATP E2-ATP-KK-P | 0.01 | 0.001 | Enzyme-substrate complex binds ATP |
| E2-ATP-KK-P KK + E2-ADP + 2Pi | 0.01 | 1e-30 | KK-P is dephosphorylated |
| KK-P (double) phosphorylation | |||
| KKK-P+ KK-P KKK-P-KK-P | 1.0 | 0.001 | Enzyme binds substrate |
| KKK-P-ATP + KK-P KKK-P-ATP-KK-P | 1.0 | 0.001 | Enzyme-ATP complex binds substrate |
| KKK-P-KK-P + ATP KKK-P-ATP-KK-P | 1.0 | 0.001 | Enzyme-substrate complex binds ATP |
| KKK-P-ATP-KK-P KK-PP + KKK-P-ADP | 1.0 | 1e-30 | KK-P is phosphorlyated |
| KK-PP (mono) dephosphorylation | |||
| E2+ KK-PP E2-KK-PP | 1.0 | 0.1 | Enzyme binds substrate |
| E2-ATP + KK-PP E2-ATP-KK-PP | 1.0 | 0.1 | Enzyme-ATP complex binds substrate |
| E2-KK-PP + ATP E2-ATP-KK-PP | 1.0 | 0.1 | Enzyme-substrate complex binds ATP |
| E2-ATP-KK-PP KK-P + E2-ADP + 2Pi | 1.0 | 1e-30 | KK-PP is dephosphorlyated |
| K mono-phosphorylation | |||
| KK-PP+ K KK-PP-K | 5.0 | 0.001 | Enzyme binds substrate |
| KK-PP+ ATP KK-PP-ATP | 5.0 | 0.001 | Enzyme binds ATP |
| KK-PP-ATP + K KK-PP-ATP-K | 5.0 | 0.001 | Enzyme-ATP complex binds substrate |
| KK-PP-K + ATP KK-PP-ATP-K | 5.0 | 0.001 | Enzyme-substrate complex binds ATP |
| KK-(Pi)2-ATP-K K-P +KK-PP-ADP | 5.0 | 1e-30 | K is phosphorlyated |
| KK-P-ADP KK-P + ADP | 5.0 | 1e-30 | Enzyme is regenerated |
| K-P dephosphorylation | |||
| E3+ K-P E3-K-P | 1.0 | 0.001 | Enzyme binds substrate |
| E3 + ATP E3-ATP | 1.0 | 0.001 | Enzyme binds ATP |
| E3-ATP + K-P E3-ATP-K-P | 1.0 | 0.001 | Enzyme-ATP complex binds substrate |
| E3-K-P + ATP E3-ATP-K-P | 1.0 | 0.001 | Enzyme-substrate complex binds ATP |
| E3-ATP-K-P K + E3-ADP + 2Pi | 1.0 | 1e-30 | K-P is dephosphorlyated |
| E3-ADP E3 + ADP | 1.0 | 1e-30 | Enzyme is regenerated |
| K-P (double) phosphorylation | |||
| KK-PP+ K-P KK-PP-K-P | 5.0 | 0.001 | Enzyme binds substrate |
| KK-PP-ATP + K-P KK-PP-ATP-K-P | 5.0 | 0.001 | Enzyme-ATP complex binds substrate |
| KK-PP-K-P + ATP KK-PP-ATP-K-P | 5.0 | 0.001 | Enzyme-substrate complex binds ATP |
| KK-PP-ATP-K-P K-PP +KK-PP-ADP | 4.0 | 0.1 | K is phosphorlyated |
| KKK-P-ADP KKK-P + ADP | 1.0 | 1e-30 | Enzyme is regenerated |
| K-PP (mono) dephosphorylation | |||
| E3+ K-PP E3-K-PP | 1.0 | 0.001 | Enzyme binds substrate |
| E3-ATP + K-PP E3-ATP-K-PP | 1.0 | 0.001 | Enzyme-ATP complex binds substrate |
| E3-K-PP + ATP E3-ATP-K-PP | 1.0 | 0.001 | Enzyme-substrate complex binds ATP |
| E3-ATP-K-PP K-P + E3-ADP + 2Pi | 1.0 | 1e-30 | K-PP is dephosphorlyated |
| Reaction | k | k | Notes |
|---|---|---|---|
| KKK-P (double) phosphorylation | |||
| K-PP + KKK-P K-PP-KKK-P | 0.1 | 0.001 | Enzyme binds substrate |
| K-PP + ATP K-PP-ATP | 0.1 | 0.001 | Enzyme binds ATP |
| K-PP-ATP + KKK-P K-PP-ATP-KKK | 0.1 | 0.001 | Enzyme-ATP complex binds substrate |
| K-PP-KKK-P + ATP K-PP-ATP-KKK-P | 0.1 | 0.001 | Enzyme-substrate complex binds ATP |
| K-PP-ATP-KKK-P KKK-PP + K-PP-ADP | 0.1 | 1e-30 | KKK-P is phosphorlyated |
| K-PP-ADP K-PP + ADP | 0.1 | 1e-30 | Enzyme is regenerated |
| KKK-PP dephosphorylation | |||
| E2 + KKK-PP E2-KKK-PP | 0.1 | 0.001 | Enzyme binds substrate |
| E2 + ATP E2-ATP | 0.1 | 0.001 | Enzyme binds ATP |
| E2-ATP + KKK-PP E2-ATP-KKK-PP | 0.1 | 0.001 | Enzyme-ATP complex binds substrate |
| E2-KKK-PP + ATP E2-ATP-KKK-PP | 0.1 | 0.001 | Enzyme-substrate complex binds ATP |
| E2-ATP-KKK-PP KKK-P + E2-ADP + 2Pi | 0.1 | 1e-30 | KKK-PP is dephosphorlyated |
| E2-ADP E2 + ADP | 0.1 | 1e-30 | Enzyme is regenerated |
Supplementary Figures
References
- Neves et al. (2002) Neves, S. R., P. T. Ram, and R. Iyengar, 2002. G protein pathways. Science 296:1636–1639.
- Kholodenko and Sauro (2008) Kholodenko, B. N., and H. M. Sauro, 2008. Spatio-temporal dynamics of protein modification cascades. SEB Experimental Biology Series 61:141.
- Kholodenko et al. (2010) Kholodenko, B. N., J. F. Hancock, and W. Kolch, 2010. Signalling ballet in space and time. Nature Reviews Molecular Cell Biology 11:414–426.
- Bhalla and Iyengar (1999) Bhalla, U. S., and R. Iyengar, 1999. Emergent properties of networks of biological signaling pathways. Science 283:381–387.
- Neves and Iyengar (2002) Neves, S. R., and R. Iyengar, 2002. Modeling of signaling networks. BioEssays 24:1110–1117.
- Gunawardena (2014a) Gunawardena, J., 2014. Models in biology: accurate descriptions of our pathetic thinking. BMC Biology 12:29.
- Huang and Ferrell (1996) Huang, C.-Y., and J. E. Ferrell, 1996. Ultrasensitivity in the mitogen-activated protein kinase cascade. Proceedings of the National Academy of Sciences 93:10078–10083.
- Markevich et al. (2004) Markevich, N. I., J. B. Hoek, and B. N. Kholodenko, 2004. Signaling switches and bistability arising from multisite phosphorylation in protein kinase cascades. The Journal of Cell Biology 164:353–359.
- Ortega et al. (2006) Ortega, F., J. L. Garces, F. Mas, B. N. Kholodenko, and M. Cascante, 2006. Bistability from double phosphorylation in signal transduction. FEBS Journal 273:3915–3926.
- Wang et al. (2006) Wang, X., N. Hao, H. G. Dohlman, and T. C. Elston, 2006. Bistability, stochasticity, and oscillations in the mitogen-activated protein kinase cascade. Biophysical Journal 90:1961–1978.
- Kholodenko (2000) Kholodenko, B. N., 2000. Negative feedback and ultrasensitivity can bring about oscillations in the mitogen-activated protein kinase cascades. European Journal of Biochemistry 267:1583–1588.
- Nakayama et al. (2008) Nakayama, K., T. Satoh, A. Igari, R. Kageyama, and E. Nishida, 2008. FGF induces oscillations of Hes1 expression and Ras/ERK activation. Current Biology 18:R332–R334.
- Shankaran et al. (2009) Shankaran, H., D. L. Ippolito, W. B. Chrisler, H. Resat, N. Bollinger, L. K. Opresko, and H. S. Wiley, 2009. Rapid and sustained nuclear–cytoplasmic ERK oscillations induced by epidermal growth factor. Molecular Systems Biology 5.
- Gunawardena (2014b) Gunawardena, J., 2014. Time-scale separation: Michaelis and Menten’s old idea, still bearing fruit. FEBS J 281:473–488.
- Michaelis and Menten (1913) Michaelis, L., and M. Menten, 1913. Die Kinetik der InwertinWirkung. Biochem. 333–369.
- Dill and Bromberg (2003) Dill, K. A., and S. Bromberg, 2003. Molecular driving forces: statistical thermodynamics in chemistry and biology. Garland Science.
- Xu and Gunawardena (2012) Xu, Y., and J. Gunawardena, 2012. Realistic enzymology for post-translational modification: zero-order ultrasensitivity revisited. Journal of Theoretical Biology 311:139–152.
- Jennings and Steenbergen Jr (1985) Jennings, R. B., and C. Steenbergen Jr, 1985. Nucleotide metabolism and cellular damage in myocardial ischemia. Annual Review of Physiology 47:727–749.
- Richter et al. (1996) Richter, C., M. Schweizer, A. Cossarizza, and C. Franceschi, 1996. Control of apoptosis by the cellular ATP level. FEBS Letters 378:107–110.
- Leist et al. (1997) Leist, M., B. Single, A. F. Castoldi, S. Kühnle, and P. Nicotera, 1997. Intracellular adenosine triphosphate (ATP) concentration: a switch in the decision between apoptosis and necrosis. The Journal of Experimental Medicine 185:1481–1486.
- Schütt et al. (2012) Schütt, F., S. Aretz, G. U. Auffarth, and J. Kopitz, 2012. Moderately Reduced ATP Levels Promote Oxidative Stress and Debilitate Autophagic and Phagocytic Capacities in Human RPE Cells. Investigative Ophthalmology & Visual Science 53:5354–5361.
- Verrax et al. (2011) Verrax, J., N. Dejeans, B. Sid, C. Glorieux, and P. B. Calderon, 2011. Intracellular ATP levels determine cell death fate of cancer cells exposed to both standard and redox chemotherapeutic agents. Biochemical Pharmacology 82:1540–1548.
- Kim et al. (2008) Kim, J.-a., Y. Wei, and J. R. Sowers, 2008. Role of mitochondrial dysfunction in insulin resistance. Circulation Research 102:401–414.
- Murray et al. (2000) Murray, J. W., E. Bananis, and A. W. Wolkoff, 2000. Reconstitution of ATP-dependent movement of endocytic vesicles along microtubules in vitro: an oscillatory bidirectional process. Molecular Biology of the Cell 11:419–433.
- Gunawardena (2012) Gunawardena, J., 2012. Some lessons about models from Michaelis and Menten. Molecular Biology of the Cell 23:517.
- Tyson et al. (2003) Tyson, J. J., K. C. Chen, and B. Novak, 2003. Sniffers, buzzers, toggles and blinkers: dynamics of regulatory and signaling pathways in the cell. Current Opinion in Cell Biology 15:221–231.
- Nishida and Gotoh (1993) Nishida, E., and Y. Gotoh, 1993. The MAP kinase cascade is essential for diverse signal transduction pathways. Trends in Biochemical Sciences 18:128–131.
- Chang and Karin (2001) Chang, L., and M. Karin, 2001. Mammalian MAP kinase signalling cascades. Nature 410:37–40.
- Roskoski Jr (2012) Roskoski Jr, R., 2012. ERK1/2 MAP kinases: structure, function, and regulation. Pharmacological Research 66:105–143.
- Frank et al. (2010) Frank, G. A., M. Goomanovsky, A. Davidi, G. Ziv, A. Horovitz, and G. Haran, 2010. Out-of-equilibrium conformational cycling of GroEL under saturating ATP concentrations. Proceedings of the National Academy of Sciences 107:6270–6274.
- Roussel (1998) Roussel, M. R., 1998. Slowly reverting enzyme inactivation: a mechanism for generating long-lived damped oscillations. Journal of Theoretical Biology 195:233–244.
- Mayawala et al. (2004) Mayawala, K., C. A. Gelmi, and J. S. Edwards, 2004. MAPK cascade possesses decoupled controllability of signal amplification and duration. Biophysical Journal 87:L01–L02.
- Hao et al. (2007) Hao, N., M. Behar, T. Elston, and H. Dohlman, 2007. Systems biology analysis of G protein and MAP kinase signaling in yeast. Oncogene 26:3254–3266.
- Sabbagh Jr et al. (2001) Sabbagh Jr, W., L. J. Flatauer, A. J. Bardwell, and L. Bardwell, 2001. Specificity of MAP kinase signaling in yeast differentiation involves transient versus sustained MAPK activation. Molecular Cell 8:683–691.
- Marshall (1995) Marshall, C., 1995. Specificity of receptor tyrosine kinase signaling: transient versus sustained extracellular signal-regulated kinase activation. Cell 80:179–85.
- Blüthgen and Herzel (2001) Blüthgen, N., and H. Herzel, 2001. MAP kinase cascade: switch, amplifier or feedback controller. In 2nd Workshop on Computation of Biochemical Pathways and Genetic Networks.
- Koshland et al. (1982) Koshland, D. E., A. Goldbeter, and J. B. Stock, 1982. Amplification and adaptation in regulatory and sensory systems. Science 217:220–225.
- Fujioka et al. (2006) Fujioka, A., K. Terai, R. E. Itoh, K. Aoki, T. Nakamura, S. Kuroda, E. Nishida, and M. Matsuda, 2006. Dynamics of the Ras/ERK MAPK cascade as monitored by fluorescent probes. Journal of Biological Chemistry 281:8917–8926.
- Leng et al. (2004) Leng, Y., T. L. Steiler, and J. R. Zierath, 2004. Effects of insulin, contraction, and phorbol esters on mitogen-activated protein kinase signaling in skeletal muscle from lean and ob/ob mice. Diabetes 53:1436–1444.
- Moxham et al. (1996) Moxham, C. M., A. Tabrizchi, R. J. Davis, and C. C. Malbon, 1996. Jun N-terminal kinase mediates activation of skeletal muscle glycogen synthase by insulin in vivo. Journal of Biological Chemistry 271:30765–30773.
- Olson et al. (1995) Olson, M. F., A. Ashworth, and A. Hall, 1995. An essential role for Rho, Rac, and Cdc42 GTPases in cell cycle progression through G1. Science 269:1270–1272.
- Ferrell Jr (1996) Ferrell Jr, J. E., 1996. Tripping the switch fantastic: how a protein kinase cascade can convert graded inputs into switch-like outputs. Trends in Biochemical Sciences 21:460–466.
- Goldbeter and Koshland (1981) Goldbeter, A., and D. E. Koshland, 1981. An amplified sensitivity arising from covalent modification in biological systems. Proceedings of the National Academy of Sciences 78:6840–6844.
- Taylor et al. (1986) Taylor, D., P. Styles, P. Matthews, D. Arnold, D. Gadian, P. Bore, and G. Radda, 1986. Energetics of human muscle: exercise-induced ATP depletion. Magnetic Resonance in Medicine 3:44–54.
- Blüthgen et al. (2006) Blüthgen, N., F. J. Bruggeman, S. Legewie, H. Herzel, H. V. Westerhoff, and B. N. Kholodenko, 2006. Effects of sequestration on signal transduction cascades. FEBS Journal 273:895–906.
- Gonze et al. (2002) Gonze, D., J. Halloy, and A. Goldbeter, 2002. Robustness of circadian rhythms with respect to molecular noise. Proceedings of the National Academy of Sciences 99:673–678.
- Blüthgen and Herzel (2003) Blüthgen, N., and H. Herzel, 2003. How robust are switches in intracellular signaling cascades? Journal of Theoretical Biology 225:293–300.
- Hirakawa et al. (2000) Hirakawa, E., H. Higuchi, and Y. Y. Toyoshima, 2000. Processive movement of single 22S dynein molecules occurs only at low ATP concentrations. Proceedings of the National Academy of Sciences 97:2533–2537.
- Huang et al. (2010) Huang, H., X. Zhang, S. Li, N. Liu, W. Lian, E. McDowell, P. Zhou, C. Zhao, H. Guo, C. Zhang, et al., 2010. Physiological levels of ATP negatively regulate proteasome function. Cell Research 20:1372–1385.
- Epstein et al. (1996) Epstein, F. H., W. E. Mitch, and A. L. Goldberg, 1996. Mechanisms of muscle wasting—the role of the ubiquitin–proteasome pathway. New England Journal of Medicine 335:1897–1905.
- Ottenheijm et al. (2006) Ottenheijm, C. A., L. M. Heunks, Y.-P. Li, B. Jin, R. Minnaard, H. W. van Hees, and P. R. Dekhuijzen, 2006. Activation of the ubiquitin–proteasome pathway in the diaphragm in chronic obstructive pulmonary disease. American Journal of Respiratory and Critical Care Medicine 174:997.
- Orciuolo et al. (2007) Orciuolo, E., G. Buda, N. Cecconi, S. Galimberti, D. Versari, G. Cervetti, A. Salvetti, and M. Petrini, 2007. Unexpected cardiotoxicity in haematological bortezomib treated patients. British Journal of Haematology 138:396–397.
- Dhanasekaran et al. (2007) Dhanasekaran, D., K. Kashef, C. Lee, H. Xu, and E. Reddy, 2007. Scaffold proteins of MAP-kinase modules. Oncogene 26:3185–3202.