Two-dimensional Sentiment Analysis of text
Abstract
Sentiment Analysis aims to get the underlying viewpoint of the text, which
could be anything that holds a subjective opinion, such as an online review,
Movie rating, Comments on Blog posts etc.
This paper presents a novel approach that classify text in two-dimensional
Emotional space, based on
the sentiments of the author.
The approach uses existing lexical resources
to extract feature set, which is trained
using Supervised Learning techniques.
1 Introduction
With the recent growth of online reviews, social media and
blogs, there has been a lot of attention to mine for subjective
information. These sites contains huge amount of data that has
loads of subjective information.
Some of the challenges in Sentiment Analysis are: People
express opinions in complex ways, in opinion texts, lexical
content alone can be misleading. Humans tend to express
a lot of remarks in the form of sarcasm, irony, implication,
etc. which is very difficult to interpret. For Example- “How
can someone sit through the movie” is extremely negative
sentiment yet contains no negative lexographic word. Even
if a opinion word is present in the text, their can be cases
where a opinion word that is considered to be positive in one
situation may be considered negative in another situation.
People can be contradictory in their statements. Most reviews
will have both positive and negative comments.
Sometimes even other people have difficulty understanding
what someone thought based on a short piece
of text because it lacks context. A good example would be
“The laptop is good but I would prefer, the operating system
which I was using” here context about the author’s operating
sytem is missing.
There is a huge demand of sentiment analysis. Before buying
any product its a practice now, to review its rating as rated by other
persons who are using it. Online advice and recommendations the data reveals is
not the only reason behind the buzz in this area. There are other reasons from
company’ point of view like,
the company wants to know “How Successful was their last campaign or product launch” based upon
the reviews of users on websites like Amazon, Yelp, etc..
2 Previous works
A lot of research has been done in the area over the past decade.
Main research in the area of Sentiment Analysis and opinion mining
are: sentiment classification, feature
based Sentiment classification and opinion
summarization. Sentiment classification deals with
classifying entire documents or text or review according to the opinions
towards certain objects. Feature-based Sentiment
classification on the other hand considers the opinions on
features of certain objects. For example, in reviews related to laptops
classifying the sentiments only on the basis screen quality.
In one of the poineer work [2],
the authors present a method of subjectivity
identification for sentiment analysis based on minimum cuts. This is important
because the irrelevant data from the reviews could be
eliminated.
The problem is viewed as a classification task and
different types of Supervised learning techniques have been used
in this field. Some of the most common ones are naive Bayes classifier, Support Vector
Machine[13] , Maxmimum Entropy [1] etc. Even some graph based techniques [4] are also used.
Languages that have been studied mostly are English
and Chinese. Presently, there are few researches
conducted on sentiment classification for other languages
like Arabic, Spanish, Italian and Thai. The presented
work focuses on English language only.
3 Approach
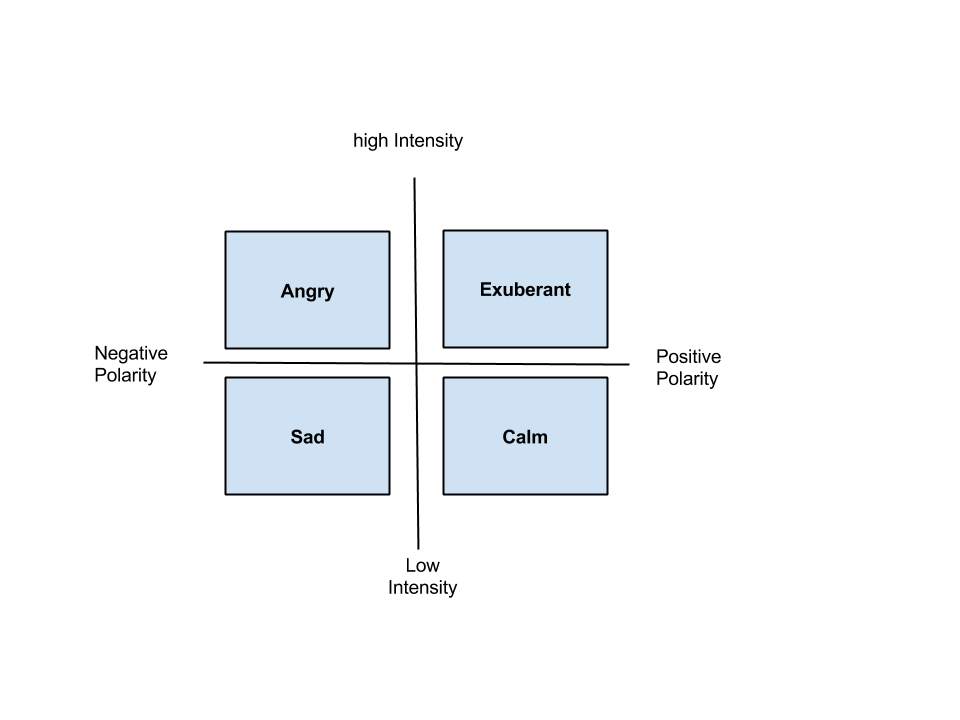
This paper uses Thayer’s Model of human emotion [5], to classify text.
This two dimensional approach
adopts the theory that human emotion
can be obtained by:
Stress (negative polarity/positive polarity) and Energy (low intensity/high intensity), and
divides it into four broad classes: Satisfied,
Sad, Exuberent and Angry.
Two binary classifiers were trained. First was trained to get the
polarity (positive or nagative) of the text. While the second was trained
on intensity (low or high) of the text. Figure 1 illustrates the approach.
3.1 Polarity
Some existing lexicon resources like Sentiwordnet 3.0 [7] and General Inquirer [9] were used to extract some features from the text. These features were trained using support vector machine, to predict the binary class label.
3.1.1 Features
Sentiword score of each review was used as a feature. The score was calculated using the weighted average of the all the synsets (Synonym set, Wordnet [8]) of each word. The weights assigned were based on the ranks of synsets as in wordnet. Thus, giving a value between -1 to 1 depending upon the polarity. Where negative score implies negative polarity and vice versa while 0 being the neutral or no polarity.
| (1) |
| (2) |
| (3) |
| (4) |
Let the sum of the sentiword score for each sentence be ’S’ and nubmer of sentences be ’n’. For each sentence in the review, negation words(like: not,cant,wasnt, barely etc.) were detected. For presence of a negation word the sentence score was multiplied by -1. Finally each sentence score was averaged to get the Sentiword based score for each review.
| (5) |
A set of 178 features were based on the frequency of categories marked by General Inuirer. For each word a set of category/labels has been marked. Categories includes positive, negative, active, passive, direct, indirect, etc.
Some other features like emoticons, number of words in quotes were also used.
| Positive Emoticons | :) :] :} :o) :o] :o}:-] :-) :-} =) =] =}=^] =^) =^} :B :-D :-B :-p |
| Negative Emoticons | :-( =( =[ ={ =^; :’( :’[ :’{ =’{ =’( =’[ =\:/ |
3.2 Intensity
To determine whether intensity of the text is high or low supervised learning approach has been used. Have extracted 184 features and a support vector Model has been trained.
3.2.1 Features
Some of the features used are: all capital text, for example: “I am EXTREMELY unhappy”. Elongated words have also been used as one of the features. Its a common practice especially in online reviews that people use, elongated words. For example “The pizza was verryyyyyy verryyyyyy gooood!!” Another feature includes the count of exlaimation marks, people tend to put exlamation marks to show the level of their excitement, for example “The coffee was too cold!!!” Count of Adverbs was also taken.
Finally the frequency of 178 categories from General Inquirer were also included. The frequency was used in the same way as in Polarity.
3.3 Dataset Creation
There are many standard annotated Dataset available to train polarity like, The movie review Dataset [2]. However no standard annotated set was available, to train for Intensity (low or high).
3.3.1 Using Yelp’s Reviews to create Dataset
The yelp’s dataset [14] contains over 100,000 reviews. Each review was marked with 1- 5 stars. Created a dataset of 5000 (2500 positive and 2500 negative) reviews for training polarity and another 5000 (2500 low intensity and 2500 high intensity) to train intensity. Used the following proxy:
Considered ratings with 5 star as Positive polarity
Considered ratings with 1 star as Negative polarity.
Considered ratings with 1 or 5 star as High Intensity.
Considered ratings with 3 star as Low Intensity.
4 Results
The following Results are using 10 fold cross-validation on the dataset of size 5000. LIBSVM [15] is used to train a vector model.
4.1 Results for Polarity
The total mean accuracy achieved was 81.60% +/- 1.92%
| true “Pos.” | true “Neg.” | Class Precision | |
| pred “Pos.” | 2143 | 563 | 79.19% |
| pred “Neg.” | 357 | 1937 | 84.44% |
| Class Recall | 85.72% | 77.48% |
4.2 Results for Intensity
The total mean accuracy achieved was 67.14% +/- 1.22%. The details are shown in table 3.
| true “Low” | true “high” | Class Precision | |
| pred “Low” | 1556 | 699 | 69.00% |
| pred “High” | 944 | 1801 | 65.61% |
| Class Recall | 62.24% | 72.04% |
4.3 Other Approaches tried
The following techniques were tried after removing stopwords and spell correction. The mean accuracy is for 10 fold cross validation on LIBSVM.
| Techniques |
|
||
|---|---|---|---|
| All unigrams (20,000+) | 67.1% | ||
| Adj & Adverb with stemming (4177) | 68.6% | ||
| Adj and Adverb no Stemming | 69.3% | ||
| Only Adjectives | 68.0% | ||
| Top 2000 words | 71.2% |
The model did not performed very well while using
all the unigrams. One possible reason could be, that
the feature size was huge. It performed slightly better
when only used Adjective and Adverbs. Stemming [10] the
unigrams had almost no effect on the results.
The results were improved just by using the K-top
words occuring in the corpus, which was 2000 in this case.
One of the shortcomings with all the approaches mentioned
in the table is that all of them are dependant on the training
Dataset. Thus, the trained model is specific to the domain and the types
of words used in the dataset. These model will not be
as effective for all types of text. For example, words like
Coffee, restaurent, movie, yummy, pizza etc. had high frequency in the presented
Dataset, which are not that common in a more General scenario.
| Techniques |
|
||
|---|---|---|---|
| Adverb with stemming (2086) | 58.7% | ||
| Adverb no Stemming | 58.4% | ||
| Frequency of 100 related categories | 65.4% |
The table above presents some of the techniques that did not work out well. Considering unigram features, for a relatively small dataset did not worked out. Even omitting some of the categories (Categories, in General Iquirer) that were generic, the results were not good. Some of the categories that were omitted in the above approach are, ’Doctrine’, ’Economics’, ’religion’ ’Politics’ etc.
4.4 Mapping in 2-Dimentional emotional space
Using Thayer’s model, the following are the Mappings in 2-Dimensional Emotional space, using the binary labels of Polarity and Intensity as shown in table 6.
| Polarity | Intensity | Emotion |
|---|---|---|
| Positive | Low | Satisfied/Calm |
| Positive | High | Exuberant/ Excited |
| Negative | Low | Sad/Down |
| Negative | High | Angry/Agitated |
5 Conclusions
Discovered a unique way to classify text in
two-dimensions and map to a emotion using Thayer’s Model.
Did an analysis of various different techniques and compared
their results.
The proposed model for polarity was able to achieve results (81.60%) which is
comparable to current state of the art techniques. The approach used
lexicon based features to train the model. The Learned model does not use
any corpus specific features for the training. The model
uses predefined set of categories that are generic. These
catagories can be applied to any English word. Although, some
of the features used are dependant on “Internet Lingo”, but
they are not specific to a domain. Therefore the model could,
be applied to the text of various other domains.
Used Intensity of text as a seperate dimension and created an annotated dataset. All the features used for training Intensity were not specific to the dataset. This approach can be used in any domain.
6 Acknowledgements
I would like to express my gratitude Yelp, for providing us the review data for research purposes. I would specially like to thank Professor Rohini Srihari, for her guidance throughout the research. I would also like to thank Puneet Singh, for all the brainstorming sessions and to the Authors of all the references list below, for their inspiring work.
References
- [1] Bo Pang, Lillian Lee, and Shivakumar Vaithyanathan. Thumbs up?: sentiment classification using machine learning techniques. In Proceedings of the ACL-02 conference on Empirical methods in natural language processing-Volume 10, pages 79–86. Association for Computational Linguistics, 2002.
- [2] Bo Pang and Lillian Lee. A sentimental education: Sentiment analysis using subjectivity summarization based on minimum cuts. In Proceedings of the 42nd annual meeting on Association for Computational Linguistics, page 271. Association for Computational Linguistics, 2004.
- [3] Bing Liu. Sentiment analysis and subjectivity. Handbook of natural language processing, 2:627–666, 2010.
- [4] Wei Jin. Mining hidden associations in text corpora through concept chain and graph queries. ProQuest, 2008.
- [5] Robert E Thayer. The biopsychology of mood and arousal. Oxford University Press, 1989.
- [6] Minqing Hu and Bing Liu. Opinion extraction and summarization on the web. In AAAI, volume 7, pages 1621–1624, 2006.
- [7] Stefano Baccianella, Andrea Esuli, and Fabrizio Sebastiani. Sentiwordnet 3.0: An enhanced lexical resource for sentiment analysis and opinion mining. In LREC, volume 10, pages 2200–2204, 2010.
- [8] George A Miller. Wordnet: a lexical database for english. Communications of the ACM, 38(11):39–41, 1995.
- [9] Philip J Stone, Dexter C Dunphy, and Marshall S Smith. The general inquirer: A computer approach to content analysis. 1966.
- [10] Martin F Porter. An algorithm for suffix stripping. Program: electronic library and information systems, 14(3):130–137, 1980.
- [11] Tony Mullen and Nigel Collier. Sentiment analysis using support vector machines with diverse information sources. In EMNLP, volume 4, pages 412–418, 2004.
- [12] Rahul Tejwani. Sentiment analysis: A survey. arXiv preprint arXiv:1405.2584, 2014.
- [13] Puneet Singh, Ashutosh Kapoor, Vishal Kaushik, and Hima Bindu Maringanti. Architecture for automated tagging and clustering of song files according to mood. International Journal of Computer Science Issues (IJCSI), 7(4), 2010.
[14] Yelp’s Review Dataset:
[15] LIBSVM – A Library for Support Vector Machines: