Effect of chain stiffness on the competition between crystallization and glass-formation in model colloidal polymers
Abstract
We map out the solid-state morphologies formed by model soft-pearl-necklace polymers as a function of bending stiffness spanning the range from fully flexible to rodlike chains. The ratio of Kuhn length to bead diameter () increases monotonically with increasing and yields a one-parameter model that relates chain shape to bulk morphology and yields insights into the packing of anisotropic particles. In the flexible limit, monomers occupy the sites of close-packed crystallites while chains retain random-walk-like order. In the rodlike limit, nematic chain ordering typical of lamellar precursors coexists with close-packing. At intermediate values of bending stiffness the competition between random-walk-like and nematic chain ordering produces glass-formation; the range of over which this occurs increases with the thermal cooling rate implemented in our molecular dynamics simulations. Finally, values of between the glass-forming and rodlike ranges produce complex ordered phases such as close-packed spirals. Our results should prove useful for rational design of dense colloidal-polymer phases with desired morphologies.
I Introduction
Over the last decade, advances in both experimental and computational techniques have contributed to rapid progress in our understanding of how complex, anisotropic particles pack. Dense phases composed of such particles have been both synthesized in the laboratory and studied in silico, and a remarkable “zoology” of packings has now been developed Damasceno et al. (2012). Phases as distinct as nematic crystals and amorphous glasses have been predicted, and are plausible candidates for the packings of natural anisotropic constituents ranging from sand grains to viruses. One class of such complex systems is that of atoms/particles/molecules with highly anisotropic but fixed shape Damasceno et al. (2012); Donev et al. (2004a, b); Jiao et al. (2009); Torquato and Jiao (2009); Haji-Akbari et al. (2011a, b); Ni et al. (2012). Another class consists of entities (e.g. molecules) whose shape is not only anisotropic but fluctuates over the observation time. Many such systems exist in nature, prominent among them being the synthetic and biological polymers. These macromolecules exhibit a wide variety of shapes and structural characteristics leading to distinct phase behaviors that depend on chain topology/connectivity, chemistry (e.g. monomer shape) and bond and torsion angle stiffness. The structural motifs formed by “traditional” polymers are diverse, and thus difficult to characterize precisely and to study in parametric fashion, especially at the atomistic level.
Colloidal polymers (CPs) composed of chains of linked, macroscopic monomers Miskin and Jaeger (2013, 2014); Zou et al. (2009); Sacanna et al. (2010); Brown et al. (2012); Vutukuri et al. (2012); Lopatina et al. (2011) offer a promising alternative for studies of the packing ability and phase behavior of systems formed by chain molecules. For example, one controllable parameter in CPs is the ratio of the Kuhn length , i.e. the length over which chains appear rodlike, to the monomer diameter . Controlling this ratio can naturally be expected to profoundly affect the morphologies formed by CPs. However, experimental study of CPs remains in its infancy. Only a few systems have been synthesized, and the factors affecting their packing at both the monomer and chain scales remain poorly explored. Thus there is a great need to characterize how parameters such as affect the morphologies of dense phases.
The main goal of this study is to examine the role chain topology and chain flexibility (or equivalently stiffness) plays in controlling solidification, i.e. crystallization vs. glass-formation, in model colloidal polymers. We perform extensive molecular dynamics (MD) simulations to determine how chains of varied bending stiffness , spanning the entire range from the flexible to the rodlike limit, solidify during cooling, and identify the factors controlling crystallization, glass-formation, and the competition thereof. Through these simulations we are thus able to identify how characteristic features of the solidification process vary with , and thus establish the effect of chain stiffness on the morphologies formed during cooling from the disordered liquid phase.
Our results indicate that both isotropic and nematic systems crystallize, but into distinctly different ordered phases. In the flexible limit (), monomers occupy the sites of close-packed (FCC or HCP) crystallites, but chains possess random-walk-like structure. In the rodlike limit (), monomers again close-pack, but chains form nematic domains with a single, well-defined orientation. For intermediate bending stiffness systems possess chain-scale ordering intermediate between isotropic and nematic, and form solids that are highly disordered at the monomer level, i.e. are good glass-formers. Neither intermediate values of nor intermediate-scale nematic order seem to be compatible with close-packing; glass formation is associated with the resulting geometric frustration. We also report novel spiral and multidirectional-nematic phases that coexist with locally close-packed order. The broad array of morphologies predicted by our single-parameter model suggests that varying the associated, aspect-ratio-like quantity in “pearl-necklace-like” colloidal polymers could be used to control both their global (chain-scale) and local (monomer-scale) structure.
II Model and Methods
II.1 Interaction potential and MD simulation protocol
Our simulations employ the semiflexible version of the soft-colloidal-polymer model described at length in Ref. Hoy and Karayiannis (2013). It is comparable to the Kremer-Grest bead-spring model Kremer and Grest (1990), but possesses crystalline ground states since the equilibrium bond length is commensurate with the monomer diameter , i.e. the condition is amenable to formation of close-packed structures. All monomers have mass and interact via the truncated and shifted Lennard-Jones potential
| (1) |
where is the intermonomer binding energy and is the cutoff radius. Attractive van der Waals interactions are included by setting (in LJ units). The MD timestep used here is , where is the Lennard-Jones time unit .
Bonds between adjacent beads along the chain backbone are modeled using the harmonic potential
| (2) |
where is the monomer diameter and is the bond stiffness. To produce polymer chains with , we set . For this stiffness, the energy barrier for chain crossing is at least over the whole temperature range considered herein. Bending stiffness is included using the standard potential Auhl et al. (2003)
| (3) |
where and the bond vector . We study systems with .
All systems are composed of chains. Periodic boundaries are applied along all three directions of cubic simulation cells. In this study we focus on polymers with chain lengths and compare them to results for monomers. This range of is typical of colloidal polymers synthesized and studied experimentally Zou et al. (2009); Sacanna et al. (2010); Vutukuri et al. (2012); Brown et al. (2012); Miskin and Jaeger (2014). Initial systems are generated by placing randomly oriented random-walk-like coils within these cells. Systems are then thoroughly equilibrated at temperatures (monomer number densities) ( for , () for , and () for , i.e. well above the -dependent solidification temperatures reported below. To avoid any artifacts arising from insufficient equilibration, we monitor the chain statistics and check for convergence at all chemical distances Auhl et al. (2003). Systems are then further equilibrated at constant (zero) pressure, and then cooled to (also at zero pressure) at a rate . Pressure is controlled using a Nose-Hoover barostat. To examine the dependence of solid-state ordering upon the cooling (quench) rate, we consider ranging from to . All MD simulations are performed using LAMMPS Plimpton (1995).
II.2 Measures of monomer- and chain-scale order
During cooling we monitor several metrics quantifying local (monomer-scale) and global (chain-scale and above) structure. Since is attractive and we perform simulations at zero pressure, all systems densify with decreasing . We report the monomer densities in terms of the packing fraction . Since is a “soft” potential and solidification occurs at rather high , and to aid comparison with results for other models including athermal (hard-sphere) systems (e.g. Karayiannis et al. (2009a); Karayiannis et al. (2010, 2013)), we also report values of the effective (thermalized Zhang et al. (2009)) packing fraction at solidification: , where , and the effective monomer radius is the smallest real solution to pre
| (4) |
Local structure at the monomer level is identified through the characteristic crystallographic element (CCE) norms Karayiannis et al. (2009b, a); Karayiannis et al. (2010, 2013). The CCE-based analysis employs highly discriminating descriptors that quantify the orientational and radial similarity of a given monomer’s local environment to that of various ordered structures. CCE norms are built around the defining set of crystallographic elements and the subset of distinct elements of the corresponding point symmetry groups that uniquely characterize the reference crystal structure. For example, the FCC crystal symmetry is mapped onto a set of four three-fold axes (roto-inversions of ), while the HCP is mapped onto a single six-fold symmetry axis (roto-inversion of ). A scan in the azimuthal and polar angles identifies the set of axes that minimize the CCE norm of a reference site (atom or particle) with respect to a given crystal structure X. Details on the underlying mathematical formulae and the algorithmic implementation can be found in Ref. Karayiannis et al. (2009b). Once the CCE norm () is calculated for each site i an order parameter can be calculated, which corresponds to the fraction of sites with CCE norms below a pre-set threshold value (). Here, CCE norms are calculated with respect to the face centered cubic (FCC) and hexagonal close packed (HCP) crystals, and the fivefold local symmetry.
Multiple measures are used to characterize nematic order. The polymers’ persistence length de Gennes (1979)
| (5) |
measures how single-chain conformations change with , i.e. chain folding/unfolding. Average nematic order at the chain level is characterized via the method employed in Ref. de Gennes (1979): alignment of chains can be characterized by the largest eigenvalue of the tensor which is defined by
| (6) |
where is the end-to-end unit vector of chain , is the Kronecker delta and denote the Cartesian directions , and the average is taken over all chains in the system. By construction, = 1 signifies perfect alignment of all chains. In contrast, = 0 means random orientation.
Nematic order at the bond level is characterized via the method employed in Ref. Luo and Sommer (2011): tensor order is given by
| (7) |
Here, Tr is the trace operator, denotes the average over all normalized bond vectors in each sub-cell, and and are Cartesian components of . In Equation 7, corresponds to perfect alignment of bonds in a given subcell and S = 0 corresponds to random bond orientation within that subcell. In order to get a single number for the average bond orientation in the system, we average S over all subcells in the simulation foo . While the average tensor order defined in this way depends on the size of the subcells used, we have tested different grid sizes and found that the results presented below are qualitatively unaffected by small changes when the subcell size is 2-3 monomer diameters. Another measure of nematic order at the bond level is provided by the bond-orientational correlation function
| (8) |
a sensitive measure of long-distance nematic order that is positive when bond vectors separated by a distance are correlated, and zero when they are uncorrelated. Here as defined above, indicates the midpoint of this bond, ndicates the midpoint of the bond, and the brackets denote averages over all .
II.3 Distinction from previous modeling efforts
In the original Kremer-Grest bead-spring model Kremer and Grest (1990) and subsequent modifications Abrams and Kremer (2001); Mackura and Simmons (2013), the equilibrium backbone bond length is different from the equilibrium non-bonded separation ; these competing length scales were shown in Refs. Bennemann et al. (1998); Abrams and Kremer (2001); Mackura and Simmons (2013) to suppress crystallization KGl . Our model sets and therefore possesses a simple (close-packed) crystalline ground state. However, it also displays glass-formation under thermal quenches at sufficiently large Hoy and Karayiannis (2013), and is therefore well suited to studies of competing crystallization and glass transitions.
Another class of widely studied polymer model from which ours is crucially different is tangent hard spheres (THS). THS polymers may be either flexible (freely-jointed) Vega et al. (2001); Vega and McBride (2002); Karayiannis and Laso (2008); Karayiannis et al. (2010, 2013) or semiflexible Fynewever and Yethiraj (1998). They are athermal since monomers interact via purely repulsive (hard-sphere) pair potentials. Further, they usually fix through holonomic constraints rather than the relatively “soft” harmonic potential (Eq. 2) used herein. Relaxation of the condition Ni and Dijkstra (2013) has been shown to profoundly affect THS crystallizability, in particular by speeding its dynamics Ni and Dijkstra (2013), or by changing the ground state’s order by imposing nck . However, the present model should not be confused with these; here applies only in a thermodynamically averaged sense, since bond length can fluctuate significantly due to thermal excitations or to structural disorder at Hoy and Karayiannis (2013).
The “partially flexible” (PF) model Oyarzun et al. (2013); van Westen et al. (2013) is comparable to semiflexible THS; part of each chain is maintained in a linear configuration (i.e. a rod), and the remainder is completely flexible (freely-jointed). Chain rigidity in the PF model is characterized by the fraction of monomers in the rigid segment, e.g. monomers are arranged into rigid linear rods for Vega et al. (2001); Vega and McBride (2002), whereas corresponds to flexible THS. In contrast, chain rigidity in our model is constant along chains and is specified by the strength of angular interactions between three consecutive monomers (Eq. 3).
MD simulations similar to those employed here have long been used to examine ordered structures formed during quenching; see e.g. Refs. Meyer and Müller-Plathe (2001, 2002); Vettorel et al. (2007a); Sommer and Luo (2010); Luo and Sommer (2013). Vettorel et. al. Vettorel et al. (2007a) employed very similar simulations to study the “phase diagram” of coarse-grained PVA; Figure 1 of Ref. Vettorel et al. (2007a) is very similar to our Figure 8. A key difference is that the CG-PVA model employs fixed interaction potentials (producing relatively stiff chains), whereas here we vary chain stiffness over the entire range from fully-flexible to rodlike via the parameter . Finally, a very recent study Kumar et al. (2013) employed a KG-like model with variable chain stiffness to study the influence of stiffness on chain packing and fragility Ediger (2000) in glass-forming systems; investigations of the latter using our crystallizable model are under way and will be reported in a forthcoming publication.
III Results
III.1 Preparation-protocol dependence
Real colloidal polymers often glass-form Zou et al. (2009). This may be due either to geometrical factors such as incommensurability of their bond length and bead diameter, or to details of the protocol with which they are prepared. While our model is commensurable and possesses crystalline ground states, MD simulations show that the morphologies formed during solidification are strongly preparation-protocol dependent. Figure 1 shows results for the close-packed monomer fraction , which is the summation of the HCP- and FCC-like site fractions, in the () end states of cooling simulations performed over a range of rates . For , varies very strongly with as described and analyzed below. Values of at fixed vary differently with for different ; while all decrease with increasing , the strength of this decrease is highly -dependent.
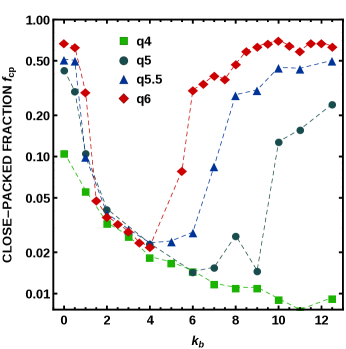
These results illustrate two key features of our model and simulation method: (i) the ”critical” cooling rates below which we obtain a large vary significantly with ; (ii) for all , the variation in the obtained morphology is significant over our achievable range of cooling rates. The cooling rate also exerts profound influence on the -dependence of the obtained morphologies reported below in Figure 8. In particular, with increasing , the range of over which systems glass-form expands outwards in both directions. Since similar considerations are expected to apply for real CPs, it is important to identify critical cooling rates (or their equivalents in athermal systems) below which experimental systems will form desired ordered morphologies.
The lowest feasible given current computational power is . This rate produces a remarkably strong dependence (maximal values of are larger than minimal values by nearly two orders of magnitude), and as will be described below, tremendous diversity in the morphologies formed upon solidification. We therefore focus on results from quenches throughout the remainder of the paper.
III.2 Solidifcation densities and temperatures
The simplest structural metric characterizing the phase behavior and in particular the competition between crystallization and glass formation is the temperature dependence of the packing fraction . Figure 2 shows results for for all systems. At high , systems show a linear increase in as decreases, i.e. they densify with a constant thermal expansion coefficient. For most systems this increase persists until the onset of solidification, but for the stiffest systems it is interrupted by a density increase corresponding to the isotropic-meltnematic-melt transition (discussed further below.) At the solidification temperature , increases more rapidly for crystal-forming systems; this increase is a sharp, first-order-like jump for the lowest and highest values of and a more gradual concave-up increase for intermediate stiffness. Glass-forming systems show a concave-down increase. Values of (reported below in Fig. 8) are identified with first-order like jumps or the points of inflection of () or the intersection of linear fits to the high- and low- regimes of (). Both and increase monotonically with increasing , as is expected for traditional polymer chains of increasing stiffness Dudowicz et al. (2005); Kunal et al. (2008); Schnell et al. (2011). Finally, after solidification, all systems again show a linear increase in as continues to decrease towards zero.
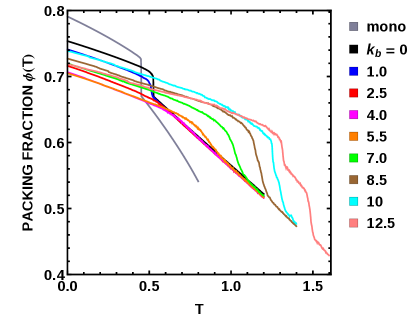
It is interesting to examine the -dependence of system densities at solidification. Values of are reported in Table 1. They decrease nearly monotonically with ; flexible systems crystallize at , glassformers solidify in the range , and for all systems crystallize at . Values of also decrease nearly monotonically with increasing , from very slightly above the hard-sphere jamming fraction Torquato et al. (2000) to about for rodlike chains. While a decrease is expected since rod-like particles generally jam or crystallize at lower than their spherical counterparts Kyrylyuk and Philipse (2011), we are not aware of any previous studies that systematically examined solidification density as a function of chain stiffness / aspect ratio in model polymers. Further, we will show below that the crossover from higher to lower values of that occurs at corresponds to the onset of local nematic order (cf. Fig. 6.)
| 0 | 0.683 | 0.643 | 6.5 | 0.590 | 0.535 |
|---|---|---|---|---|---|
| 0.5 | 0.683 | 0.643 | 7 | 0.592 | 0.535 |
| 1 | 0.679 | 0.641 | 7.5 | 0.582 | 0.522 |
| 1.5 | 0.681 | 0.645 | 8 | 0.581 | 0.520 |
| 2 | 0.673 | 0.636 | 8.5 | 0.570 | 0.508 |
| 2.5 | 0.666 | 0.627 | 9 | 0.571 | 0.518 |
| 3 | 0.657 | 0.616 | 9.5 | 0.586 | 0.520 |
| 3.5 | 0.651 | 0.609 | 10 | 0.580 | 0.514 |
| 4 | 0.648 | 0.605 | 10.5 | 0.580 | 0.514 |
| 4.5 | 0.643 | 0.599 | 11 | 0.578 | 0.512 |
| 5 | 0.642 | 0.598 | 11.5 | 0.583 | 0.515 |
| 5.5 | 0.597 | 0.544 | 12 | 0.580 | 0.512 |
| 6 | 0.606 | 0.552 | 12.5 | 0.584 | 0.526 |
Studies of jamming in thermalized colloidal systems Zhang et al. (2009) have similarly found , and that crystallization sets in as increases beyond . We therefore conclude that results expressed in terms of should be valuable in mapping our results to those obtained in experiments as well as simulations where particles typically interact via stiffer potentials.
III.3 Local ordering from monomeric to segment scales
Next we show that the trends in are closely matched by corresponding ones obtained from different descriptors of local order. Figure 3 shows the -dependent fractions and of monomers with (a) close-packed order (FCC or HCP similarity) and (b) fivefold local symmetry, as quantified by CCE analysis Karayiannis et al. (2009b). Systems exhibiting sharp jumps in also show sharp jumps in . For very flexible and very stiff chains these jumps are reminiscent of first-order transitions and occur at . In contrast, glassy systems (e.g. ) show a more gradual and much weaker increase, and ultimately exhibit far lower ultimate values of . Results for display opposite trends. For glassforming systems, increases continuously with decreasing , as expected in a densifying glassformer Frank (1952). In the limit of fully flexible chains (), the sharp increase of ordered sites is accompanied by a sharp decline in the fivefold population. In contrast, for chains that order nematically, remains low at all . This is expected since the hexagonal order in planes perpendicular to the nematic director field Meyer and Müller-Plathe (2001, 2002); Vettorel et al. (2007b) suppresses fivefold order.

Simple bead-spring models like ours possess two essentially “polymeric” features controlling the crystallization-vs-glass-formation competition: topological chain connectivity / uncrossability, and angular stiffness. Here the role of chain topology is indicated by contrasting results for polymers to data for monomers presented in Figures 2-3. The monomeric Lennard-Jones system is well-known as an excellent crystal-former Trudu et al. (2006); Wang et al. (2007). Monomers exhibit sharper transitions in and , and ultimately reach higher values of both order metrics at . Furthermore, they exhibit significantly lower as the resulting ordered morphology is an almost perfect FCC crystal. These differences arise because chain connectivity reduces both the critical rates for crystal nucleation and growth and the entropy of close-packed crystallites. Simulations with shorter and longer chains indicate that the aforementioned trends strengthen with increasing , especially once increases beyond the onset of chain entanglement Hoy et al. (2009), and especially for stiffer chains.
Angular stiffness effects on local (dis)ordering propensity can be readily examined though analyzing distributions of bond and torsion angles (respectively and ). Figure 4 shows the probability distributions and in the end states of of cooling runs for selected . For flexible chains, peaks are in are observed at , , , and , characteristic of a stack-faulted close-packed structure Hoy and Karayiannis (2013) and similar to that observed in crystallized athermal polymers Karayiannis et al. (2010). The peaks characteristic of crystalline order decrease in intensity as increases, and vanish by , being replaced by a single broad peak at large (e.g. as shown for ). We claim that locally amorphous order arises because this large, broad peak is incompatible with close-packed ordering, e.g. chains are too stiff (flexible) to form the characteristic () angles with high probability at temperatures near solidification. In other words, chains in glassforming systems are too stiff to collapse into random-walk configurations and form close-packed (RWCP) crystals, but not stiff enough to form the extended nematic domains essential for crystallization into the nematic close-packed (NCP) phase. Thus crystallization is hindered and systems remain amorphous during solidification. As stiffness continues to increase, however, the abovementioned broad peak is replaced by a sharp peak at (illustrated here in for ), indicating increasingly rodlike configurations that can efficiently close-pack and form NCP crystallites.
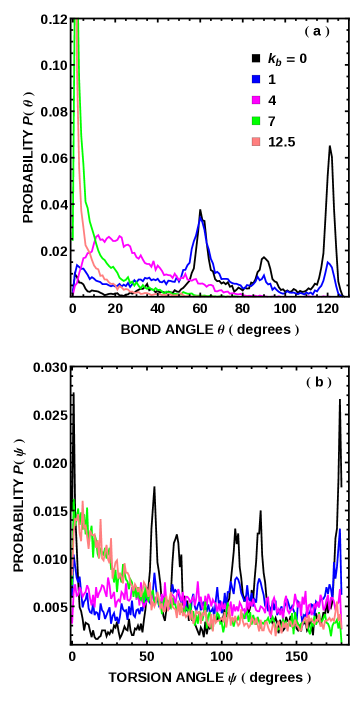
Torsional angle distributions show consistent trends that reinforce the above hypothesis. Flexible chains show sharp peaks at , , , , , and . These angles have been shown in previous studies of athermal chains Karayiannis et al. (2010) to correspond to collapsed, locally polytetrahedral conformations. As chain stiffness increases, these maxima gradually disappear, and are replaced by a single broad maximum. The first maximum occurs at finite for glassforming systems, and at for systems that combine at least some close-packed local with at least intermediate-scale nematic order; cf. Figs. 5-6. All of these trends are consistent with the vanishing of polytetrahedral order that is expected for semiflexible chains that cannot easily adopt compact conformations.
III.4 Local and global nematic ordering
The role of angular stiffness on chain shape is indicated in Figure 5(a), which illustrates the variation of persistence length with as well as its evolution with decreasing . Systems span the range from the flexible () limit for small to the rodlike () limit for . Since the angular potential employed here (; Eq. 3) is minimized for straight chains and systems remain near thermodynamic equilibrium above , stiffer chains clearly uncoil and adopt more-extended configurations as decreases towards .
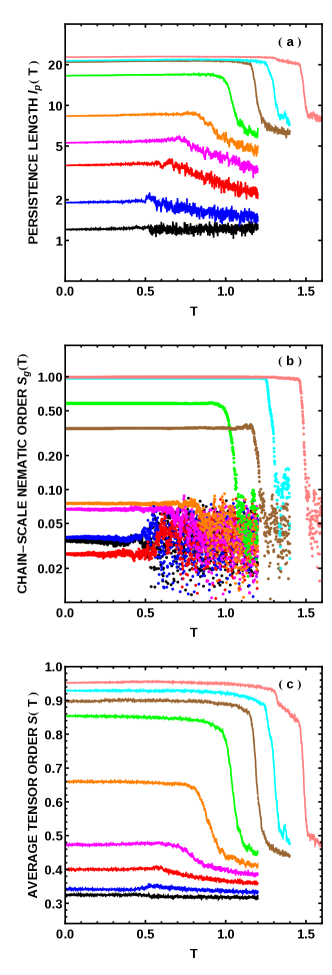
The same factors that increase also increase chain- and bond-level nematic order. In Figure 5(b) we present results for the temperature dependence of the chain-level nematic order . For all , increases monotonically with increasing (except for systems, which are more ordered than systems because the multidomain-nematic ordering of the latter reduces ; see below.) At high , ordering oscillates because of the high melt-state mobility of the unentangled chains and the slow cooling rate employed. As expected, in the flexible limit, chain end-to-end vectors remain randomly oriented for all ; no significant ordering at this scale takes place upon crystallization into the RWCP phase. Glass-forming systems display similar behavior; large-scale chain configurations get “frozen in” upon vitrification. In sharp contrast, stiffer chains display a dramatic increase in upon cooling as chain-scale order transitions from isotropic to nematic. Indeed, for all but the stiffest chains, the isotropicnematic transition drives crystallization as follows: when chains align, they pack more efficiently, and thus increases. This densification drives these systems above the characteristic crystallization density , and crystallization into the NCP phase occurs spontaneously, i.e. for . Very stiff chains (approaching the rodlike limit) exhibit a separate isotropicnematic transition at temperatures above .
Figure 5(c) shows the temperature dependence of the average bond-level nematic order . increases upon cooling, indicating increasing local alignment of chains at the bond scale. The increases are especially dramatic for NCP-forming systems, but notably, also occur for glass-forming systems (i.e. they track the increases in ), indicating that even the glassforming systems considered here possess a degree of local nematic order, inherited from the melt. The finite value of in the flexible limit arises from two factors: (i) topological (chain uncrossability) constraints dictate that nearby bonds can not freely orient with respect to each other, and (ii) in the RWCP crystal, chain segments tend to align preferentially along locally favored directions of their corresponding HCP or FCC crystallites.
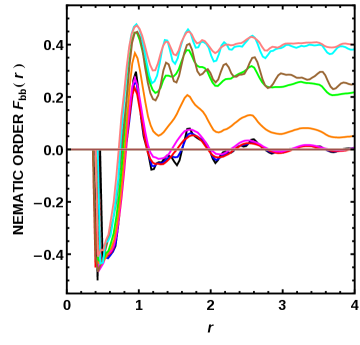
We conclude our discussion of nematic ordering by presenting results for the -dependence of the spatial correlation of the bond-vector orientations. Results for end states of our cooling runs are shown in Figure 6. All display a “correlation hole” at small corresponding to the fact that excluded volume prevents dimer pairs from aligning; the closest allowed separation corresponds to a “crossed” configuration which has . Similarly, in the densely packed systems considered here, dimer pairs separated by approximately one monomer are preferentially aligned. At larger distances, results are highly -dependent. Flexible and glassforming systems exhibit frozen-in, liquid-like order. Long range chain order sets in for and increases rapidly with increasing until (as discussed further below) aligned chains form a single nematic domain at adequately high values. Finally, note that the onset of mid-range nematic order at corresponds to the crossover from higher to lower values of .
III.5 (Dis)ordered morphologies formed under cooling; -dependence
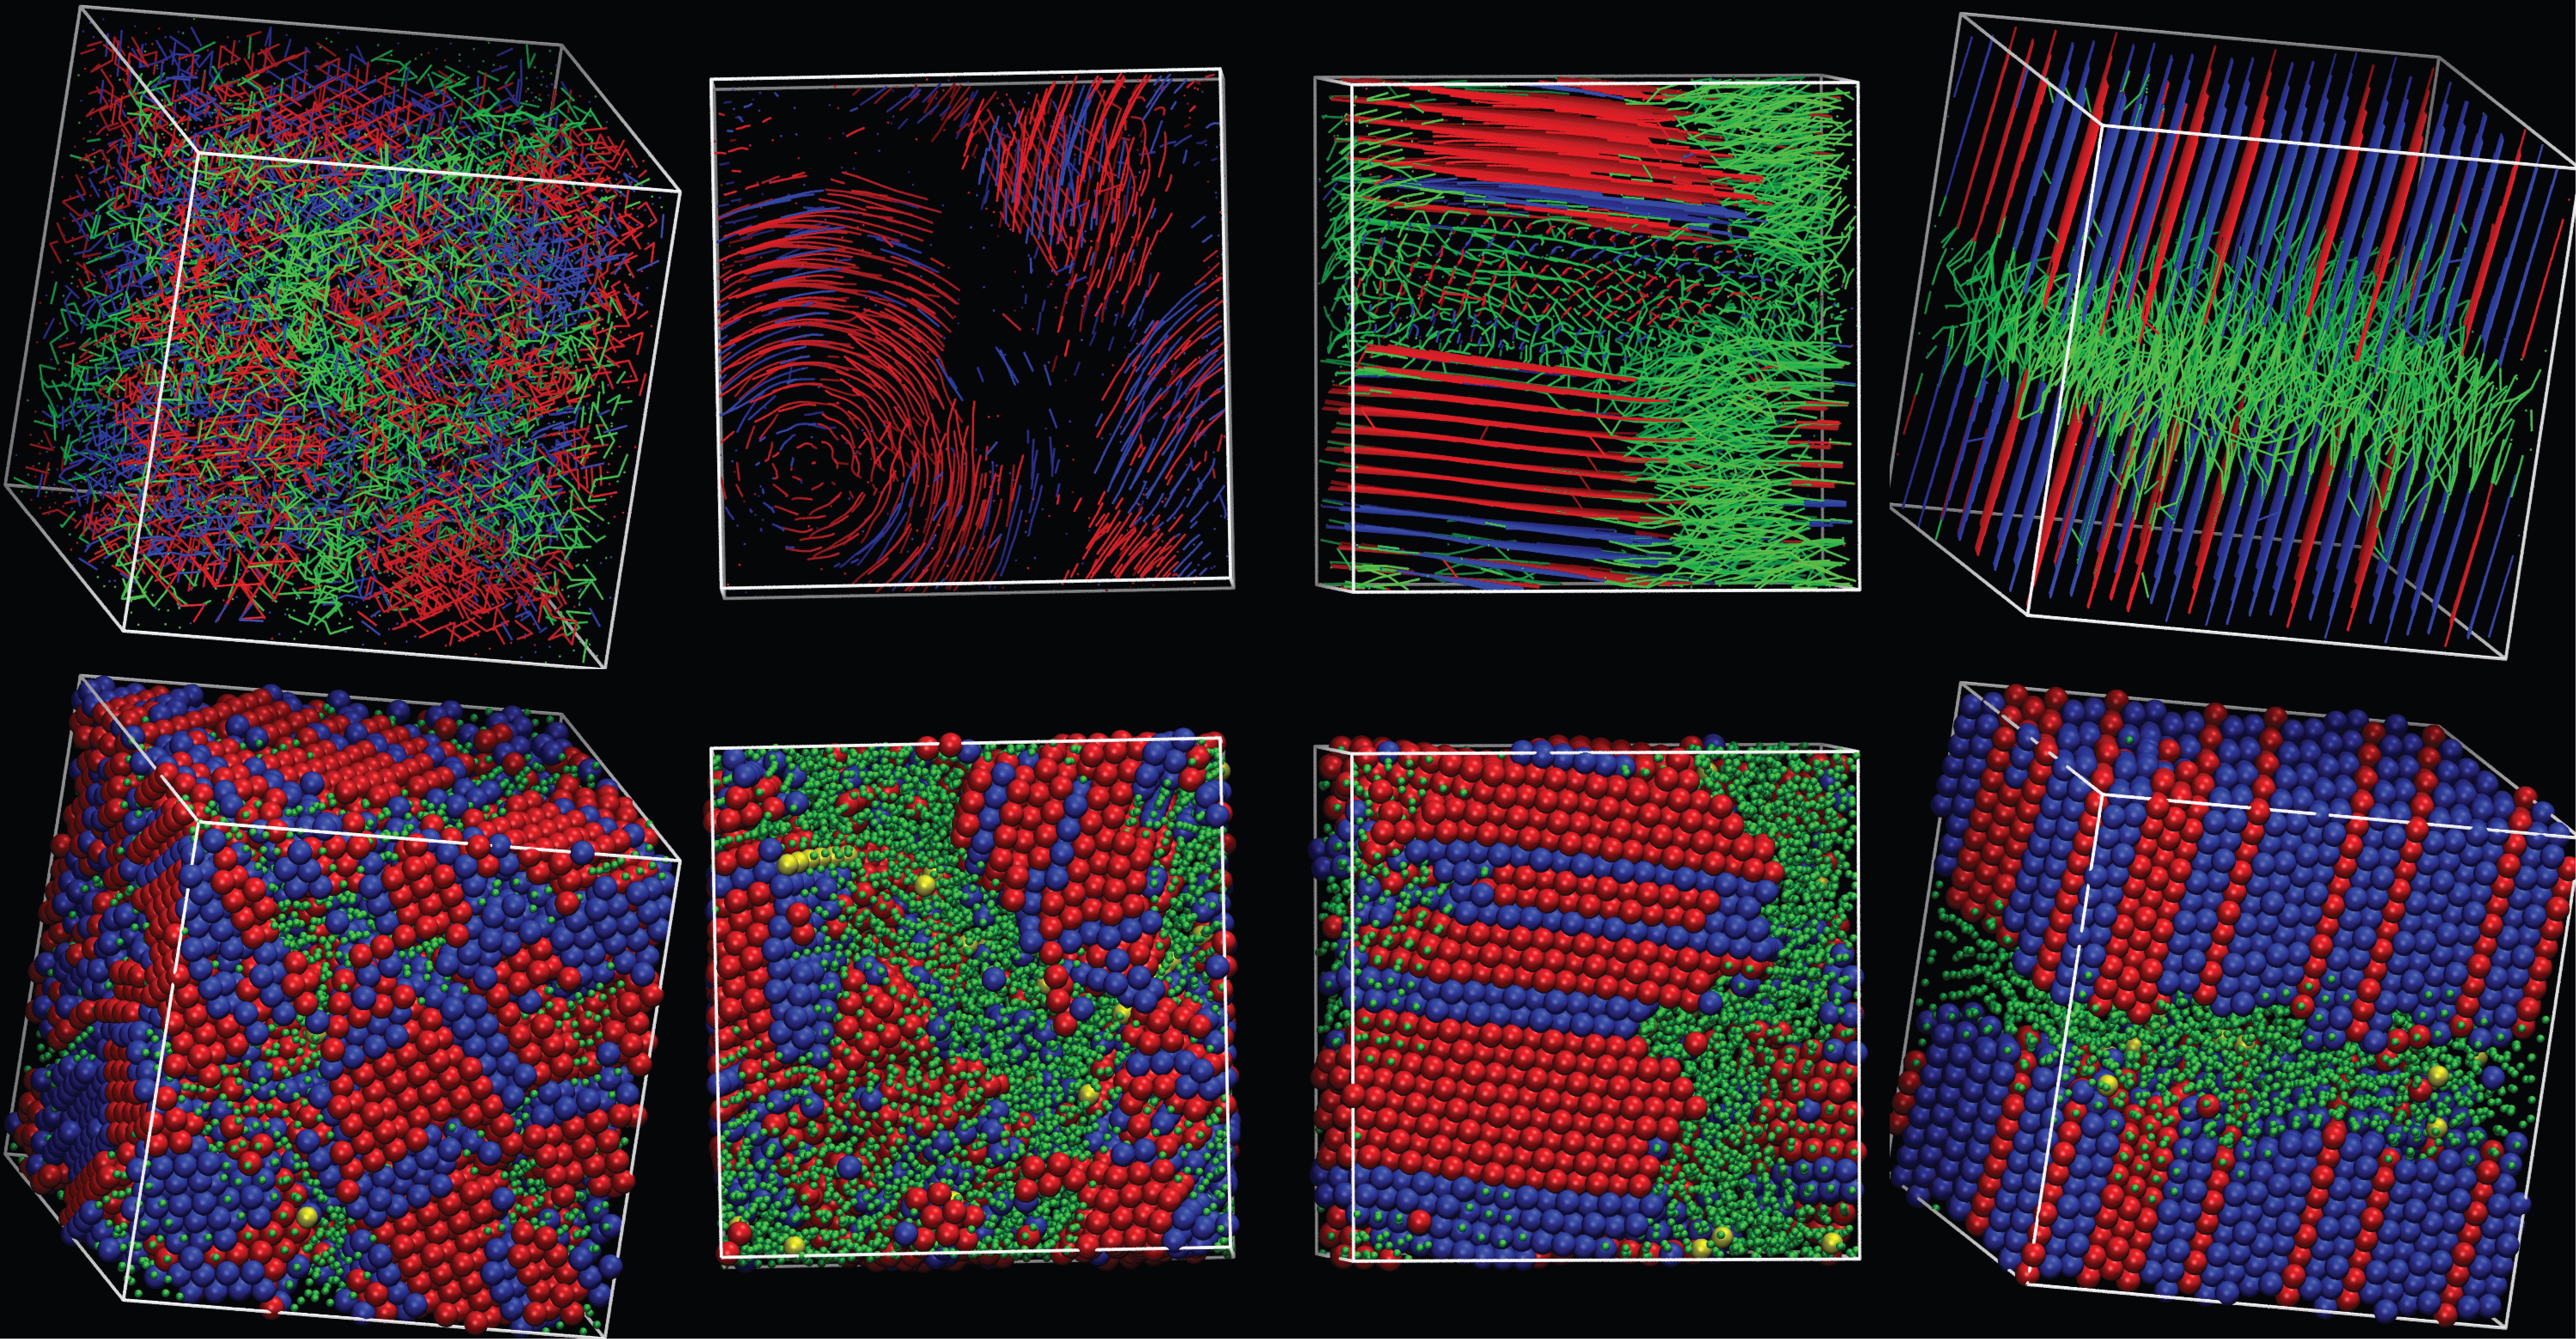
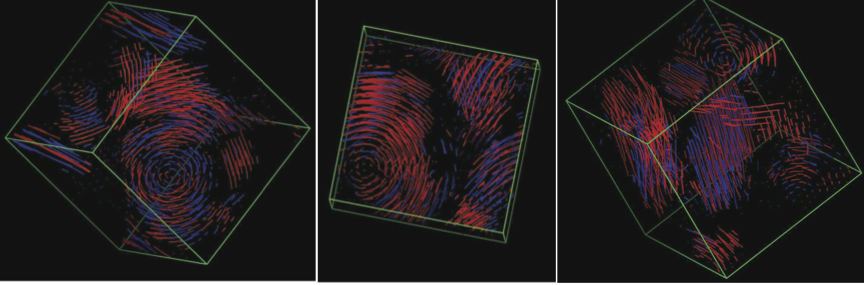
Our model exhibits considerably more complexity than might have been surmised, forming a broad array of semi-crystalline morphologies. Typical system snapshots of final () configurations for systems are shown in Figure 7. In the flexible limit (), systems freeze into RWCP grains that are randomly shaped and oriented, and are separated by twin defects and/or heavily stack-faulted interphases Hoy and Karayiannis (2013), similar to results from previous studies of fully flexible athermal Ni and Dijkstra (2013); Karayiannis et al. (2013, 2010) chains. In the rod-like limit (), chains tend to form large crystal grains of mixed fcc and hcp character aligned along a single nematic director field, corresponding to close-packed nematic ordering. Defects are also present at the employed cooling rate; for example, the system possesses an amorphous interphase that is very similar to the amorphous interlamellar domains found in traditional semicrystalline polymers Strobl (2007).
In addition to the RWCP and NCP crystals, we also observe more complex forms of long-range order at intermediate . For chains form two distinct close-packed “grains” with different nematic orientations, separated by an amorphous grain boundary. Finally, for , chains form a well-defined spiral morphology. Remarkably, the monomer-level structure is close-packed (possesses hcp and fcc similarity) even near the core of the spiral, and remains so as the radial distance from the core increases. At this , the spiral structure forms slightly above , freezes in upon solidification, and serves as a nucleus for close-packed crystal growth. As described in the Appendix, formation of such spirals is quite robust. This structure is similar to those recently observed in experimental and phase-field theory studies of polymer blends Okabe et al. (1999); Kyu et al. (1999); Xu et al. (2006), and illustrates the wide range of ordered morphologies that can be obtained using simple polymer models with variable chain stiffness.
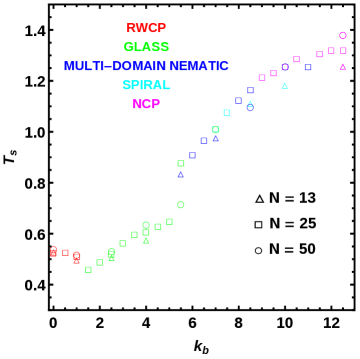
We conclude by presenting a “phase” diagram for our model. Figure 8 shows both values of and the morphologies formed during solidification, as a function of . Colors and symbol types represent the ordering of the obtained solid phases. For all chain lengths, drops slightly from its flexible-limit value Hoy and Karayiannis (2013) as a small bending stiffness is added (), then increases monotonically with increasing ; it is worth repeating that while this trend is expected for polymers of increasing stiffness Dudowicz et al. (2005); Kunal et al. (2008); Schnell et al. (2011), previous studies have not examined models displaying such a broad range of solid-state morphologies. As described above, systems freeze into RWCP crystals for the smallest and single-domain NCP crystals for the largest , while intermediate values of produce either glass-formation or more complex order.
We emphasize, of course, that Fig. 8 is not an equilibrium phase diagram, but rather is simply a representation of -dependent solidification for the preparation protocol employed here. In particular, the results shown in Fig. 1 indicate that faster cooling rates will expand the range of over which glasses are formed to both larger and smaller values; lower cooling rates will produce opposite trends. Lower will also naturally extend the range over which single-domain nematic crystals form to lower values of . A detailed examination of the relative thermodynamic stability of these differently ordered phases would be very interesting, but is beyond the scope of the present work sur .
IV Discussion and conclusions
In this paper, we described the chain-stiffness dependence of the solid-state morphologies formed by model “soft” colloidal polymers. By varying a single interaction parameter (), we illustrated dramatic effects of chain stiffness on the competition between crystallization and glass formation. In fhe flexible-chain (small-) limit, monomers occupy the sites of close-packed crystallites while chains retain random-walk-like order. At intermediate , crystallization is suppressed in favor of glass formation. As continues to increase, more complex ordered phases such as spirals are also produced, until long-range nematic chain ordering typical of lamellar precursors sets in as the rodlike limit is approached. Remarkably, long-range orientational order coexists with close-packing.
The controlling thermodynamics and kinetics of solidification both depend strongly on chain flexibility. Under cooling at a thermal “quench” rate , relatively flexible chains generally exhibit lower solidification temperatures as well as faster crystallization kinetics (and hence sharper disorder-order transitions) than their stiffer counterparts. These dependences, however, are complex and nonmonotonic in . We associated the glass-formation observed at intermediate with the incompatibility of Kuhn-scale structure (i.e. bond and torsion angles) with close-packing. Other factors are probably also highly relevant, including e.g. competition between formation of RWCP and NCP crystalline phases. Future work will consider local structure and dynamics in melts above in order to isolate the microscopic mechanisms underlying this complex, -dependent behavior.
In experiments, the attractive interactions between colloidal monomers are typically short-ranged, and weak beyond (at most) of the monomer diameter. Indeed, most experiments to date on dense colloidal-polymer systems Zou et al. (2009); Brown et al. (2012); Miskin and Jaeger (2013, 2014) have employed “hard” (athermal) monomers. While we have used a Lennard-Jones potential with much longer-ranged attractions, we argue that this difference does not devalue the present work. Our obtained morphologies agree with those obtained for athermal models in both the flexible Karayiannis et al. (2009a); Karayiannis et al. (2010, 2013); Ni and Dijkstra (2013) and rodlike Fynewever and Yethiraj (1998) limits, i.e. RWCP and NCP, suggesting that realistic interactions with ranges between the limits of purely repulsive hard spheres and long-ranged-attractive LJ will also produce these morphologies. It is also well known that many aspects of soft systems can be mapped to hard systems by replacing the “bare” packing fraction with an -dependent effective Zhang et al. (2009) packing fraction , and vice versa; to aid comparison of our results to systems with different interactions, we reported solidification densities in terms of their effective values .
We therefore claim that the various solid morphologies reported here, and in particular their variation with , represent a first step towards developing a qualitative guide for experiments on real CPs. For example, our results suggest that by tuning the stiffness and employing a suitable preparation protocol such as “tapping” Knight et al. (1995), crystalline samples of colloidal or granular polymers may be experimentally realized. However, it will be critical to investigate the effects upon ordering of factors such as monomer shape (i.e. deviations from sphericity) and bond geometry (e.g. deviations from and different equilibrium bond angles); recent work on both polymeric and nonpolymeric systems suggests that all of these are likely Donev et al. (2004a); Damasceno et al. (2012); Ni and Dijkstra (2013) to be very important. Followup studies aimed at characterizing such effects are in progress nck .
Finally, we discuss the applicability of the present study to traditional polymers (including familiar synthetic, semicrystalline polymers such as PE and PVA.) These also crystallize and form hexagonal order in planes perpendicular to the nematic director field in both experiments Strobl (2007) and simulations Meyer and Müller-Plathe (2001, 2002); Vettorel et al. (2007b), but do not close-pack. Preliminary simulations of longer chains have not produced the chain-folded lamellae typical of these systems, perhaps because the lack of torsional interactions removes a necessary thermodynamic driving force; previous work has found that lamella-formation is enhanced by strengthening torsional interactions Lacevic et al. (2008).
Appendix A Finite size effects and spiral morphologies
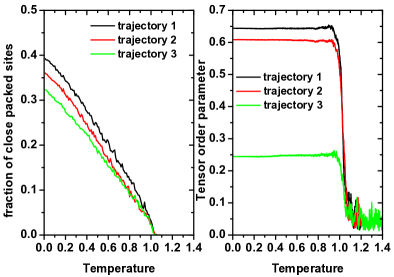
Small variations in the initial states of samples may produce larger differences in their final states, especially if the initial states are near a phase transition. Here we discuss how such variations can affect the morphologies produced, particularly near a phase boundary, focusing on finite-system-size effects. We consider the sample-to-sample variations of , systems. Per Figure 8, this value of is in the spiral-forming range, but near the “transitions” to other complex ordered phases. The left panels of Figure 9 shows how the fraction of close packed sites and the global tensor parameter (Eq. 6) evolve during cooling for three different (but identically prepared) realizations. All three trajectories crystallize at practically identical and . However, the fraction of ordered sites in the final states differs by approximately , and the nematic order parameter by a factor , between the two extreme cases. Specifically, very well developed spirals can be observed in the leftmost two “snapshot” panels of Fig. 9. In the rightmost panel, the characteristic ring of the spiral morphology is less developed, and co-exists with nematic domains. While there are clearly finite-size effects for these systems, these results also make clear that the spiral “phase” is quite robust. Preliminary simulations of much larger systems indicate that the spirals are not artifacts of the periodic boundary conditions (as is sometimes found in systems under severe confinement Pickett et al. (2000)). Thus we consider such effects a feature rather than a deficiency of our model since real colloidal polymers are typically out of equilibrium and so are expected to exhibit sample-to-sample variations in typical experiments.
References
- Damasceno et al. (2012) P. F. Damasceno, M. Engel, and S. C. Glotzer, Science 337, 453 (2012).
- Donev et al. (2004a) A. Donev, F. H. Stillinger, P. M. Chaikin, and S. Torquato, Phys. Rev. Lett. 92, 255506 (2004a).
- Donev et al. (2004b) A. Donev, I. CIsse, D. Sachs, E. A. Variano, F. H. Stillinger, R. Connelly, S. Torquato, and P. M. Chaikin, Science 303, 990 (2004b).
- Jiao et al. (2009) Y. Jiao, F. H. Stillinger, and S. Torquato, Phys. Rev. E 79, 041309 (2009).
- Torquato and Jiao (2009) S. Torquato and Y. Jiao, Nature 460, 876 (2009).
- Haji-Akbari et al. (2011a) A. Haji-Akbari, M. Engel, and S. C. Glotzer, Phys. Rev. Lett. 107, 215702 (2011a).
- Haji-Akbari et al. (2011b) A. Haji-Akbari, M. Engel, and S. C. Glotzer, J. Chem. Phys. 135, 194101 (2011b).
- Ni et al. (2012) R. Ni, A. P. Gantapara, J. de Graaf, R. van Roij, and M. Dijkstra, Soft Matter 8, 8826 (2012).
- Miskin and Jaeger (2013) M. Z. Miskin and H. M. Jaeger, Nature Materials 12, 326 (2013).
- Miskin and Jaeger (2014) M. Z. Miskin and H. M. Jaeger, Soft Matter 10, 3708 (2014).
- Zou et al. (2009) L.-N. Zou, X. Cheng, M. L. Rivers, H. M. Jaeger, and S. R. Nagel, Science 326, 408 (2009).
- Sacanna et al. (2010) S. Sacanna, W. T. M. Irvine, P. M. Chaikin, and D. J. Pine, Nature 464, 575 (2010).
- Brown et al. (2012) E. Brown, A. Nasto, A. G. Athanassiadis, and H. M. Jaeger, Phys. Rev. Lett. 108, 108302 (2012).
- Vutukuri et al. (2012) H. R. Vutukuri, A. F. Demirors, B. Peng, P. D. J. van Oostrum, A. Imhof, and A. van Blaaderen, Angew. Chem. Int. Ed. 51, 11249 (2012).
- Lopatina et al. (2011) L. M. Lopatina, C. J. O. Reichhardt, and C. Reichhardt, Phys. Rev. E 84, 011303 (2011).
- Hoy and Karayiannis (2013) R. S. Hoy and N. C. Karayiannis, Phys. Rev. E 88, 012601 (2013).
- Kremer and Grest (1990) K. Kremer and G. S. Grest, J. Chem. Phys. 92, 5057 (1990).
- Auhl et al. (2003) R. Auhl, R. Everarers, G. S. Grest, K. Kremer, and S. J. Plimpton, J. Chem. Phys. 119, 12718 (2003).
- Plimpton (1995) S. Plimpton, J. Comp. Phys. 117, 1 (1995).
- Karayiannis et al. (2009a) N. C. Karayiannis, K. Foteinopoulou, and M. Laso, Phys. Rev. Lett. 103, 045703 (2009a).
- Karayiannis et al. (2010) N. C. Karayiannis, K. Foteinopoulou, C. F. Abrams, and M. Laso, Soft Matter 6, 2160 (2010).
- Karayiannis et al. (2013) N. C. Karayiannis, K. Foteinopoulou, and M. Laso, Int. J. Mol. Sci. 14, 332 (2013).
- Zhang et al. (2009) Z. Zhang, N. Xu, D. T. N. Chen, P. Yunker, A. M. A. Alsayed, K. B. Aptowicz, P. Habdas, A. J. Liu, S. R. Nagel, and A. G. Yodh, Nature 459, 230 (2009).
- (24) There is some freedom of choice Zhang et al. (2009) in the prefactor of in Equation 4. Here we have chosen it to be .
- Karayiannis et al. (2009b) N. C. Karayiannis, K. Foteinopoulou, and M. Laso, J. Chem. Phys. 130, 074704 (2009b).
- de Gennes (1979) P. G. de Gennes, Scaling Concepts in Polymer Physics (Cornell University Press (Ithaca), 1979).
- Luo and Sommer (2011) C.-F. Luo and J.-U. Sommer, Macromolecules 44, 1523 (2011).
- (28) For the the purpose of calculating , simulation cells are divided into cubic sub-cells. We chose .
- Abrams and Kremer (2001) C. F. Abrams and K. Kremer, J. Chem. Phys. 115, 2776 (2001).
- Mackura and Simmons (2013) M. E. Mackura and D. S. Simmons, J. Polym. Sci. Part B: Polym. Phys. p. 134 (2013).
- Bennemann et al. (1998) C. Bennemann, W. Paul, K. Binder, and B. Düunweg, Phys. Rev. E 57, 843 (1998).
- (32) Note that the K-G model does allow formation of liquid crystalline order when chain stiffness is sufficiently high Affouard et al. (1996).
- Affouard et al. (1996) F. Affouard, M. Kröger, and S. Hess, Phys. Rev. B 54, 5178 (1996).
- Vega et al. (2001) C. Vega, C. McBride, and L. G. MacDowell, J. Chem. Phys. 115, 4203 (2001).
- Vega and McBride (2002) C. Vega and C. McBride, Phys. Rev. E 65, 052501 (2002).
- Karayiannis and Laso (2008) N. C. Karayiannis and M. Laso, Phys. Rev. Lett. 100, 050602 (2008).
- Fynewever and Yethiraj (1998) H. Fynewever and A. Yethiraj, J. Chem. Phys. 108, 1636 (1998).
- Ni and Dijkstra (2013) R. Ni and M. Dijkstra, Soft Matter 9, 365 (2013).
- (39) N. C. Karayiannis, K. Foteinopoulou, and M. Laso, Soft Matter, 2015 (Advance article: DOI 10.1039/C4SM02707H.)
- Oyarzun et al. (2013) B. Oyarzun, T. van Westen, and T. J. H. Vlught, J. Chem. Phys. 138, 204905 (2013).
- van Westen et al. (2013) T. van Westen, B. O. and. T. J. H. Vlught, and J. Gross, J. Chem. Phys. 138, 034505 (2013).
- Meyer and Müller-Plathe (2001) H. Meyer and F. Müller-Plathe, J. Chem. Phys. 115, 7807 (2001).
- Meyer and Müller-Plathe (2002) H. Meyer and F. Müller-Plathe, Macromolecules. 35, 1241 (2002).
- Vettorel et al. (2007a) T. Vettorel, H. Meyer, J. Baschnagel, and M. Fuchs, Phys. Rev. E 75, 041801 (2007a).
- Sommer and Luo (2010) J.-U. Sommer and C. Luo, J. Polym. Sci. Part B - Polym. Phys. 48, 2222 (2010).
- Luo and Sommer (2013) C.-F. Luo and J.-U. Sommer, ACS Macro. Lett. 2, 31 (2013).
- Kumar et al. (2013) R. Kumar, M. Goswami, B. G. Sumpter, V. N. Novikov, and A. P. Sokolov, Phys. Chem. Chem. Phys. 15, 4604 (2013).
- Ediger (2000) M. D. Ediger, Ann. Rev. Phys. Chem 51, 99 (2000).
- Dudowicz et al. (2005) J. Dudowicz, K. F. Freed, and J. F. Douglas, J. Phys. Chem. B 109, 21285 (2005).
- Kunal et al. (2008) K. Kunal, C. G. Robertson, S. Pawlus, S. F. Hahn, and A. P. Sokolov, Macromolecules 41, 7232 (2008).
- Schnell et al. (2011) B. Schnell, H. Meyer, C. Fond, J. P. Wittmer, and J. Baschnagel, Eur. Phys. J. E 34, 97 (2011).
- Torquato et al. (2000) S. Torquato, T. M. Truskett, and P. G. Debenedetti, Phys. Rev. Lett. 84, 2064 (2000).
- Kyrylyuk and Philipse (2011) A. V. Kyrylyuk and A. P. Philipse, Phys. Status Solidi A 208, 2299 (2011).
- Frank (1952) F. C. Frank, Proc. Roy. Soc. London. Ser. A 215, 43 (1952).
- Vettorel et al. (2007b) T. Vettorel, H. Meyer, J. Baschnagel, and M. Fuchs, Phys. Rev. E 75, 041801 (2007b).
- Trudu et al. (2006) F. Trudu, D. Donadio, and M. Parrinello, Phys. Rev. Lett. 97, 105701 (2006).
- Wang et al. (2007) H. Wang, H. Gould, and W. Klein, Phys. Rev. E 76, 013604 (2007).
- Hoy et al. (2009) R. S. Hoy, K. Foteinopoulou, and M. Kröger, Phys. Rev. E 80, 031803 (2009).
- Humphrey et al. (1996) W. Humphrey, A. Dalke, and K. Schulten, J. Mol. Graph. 14, 33 (1996).
- Strobl (2007) G. Strobl, The Physics of Polymers (Springer, 2007).
- Okabe et al. (1999) Y. Okabe, T. Kyu, H. Saito, and T. Inoue, Macromolecules 31, 5823 (1999).
- Kyu et al. (1999) T. Kyu, H.-W. Chiu, A. J. Guenthner, Y. Okabe, H. Saito, and T. Inoue, Phys. Rev. Lett. 83, 2749 (1999).
- Xu et al. (2006) H. Xu, H.-W. Chiu, Y. Okabe, and T. Kyu, Phys. Rev. E 74, 011801 (2006).
- (64) Nevertheless, at this point it is worthwhile to compare the nonequilibrium results presented in Figure 8 with those that might be “naively” expected (from simple equilibrium-thermodynamic arguments) to be valid in the limit . The ground state for any finite is nematic and close-packed (NCP) since ideal NCP packing minimizes both bending and pair energies. As temperature increases, entropy favors adoption of random-walk-like chain structure, and there will be a nematicisotropic transition at some temperature that must increase with increasing . This transition must cross the crystallization line at some characteristic value . For , the stable crystal should be NCP at low and RWCP at higher , while for NCP could plausibly be the only stable solid phase. The nucleation barrier for the RWCPNCP solid-solid transition will be extremely high, and this transition is not expected to be observed in either simulations or experiments. However, for , it is easy to imagine that there is a competition between RWCP and NCP local structure that can suppress the formation of ordered crystalline solids.
- Knight et al. (1995) J. B. Knight, C. G. Fandrich, C. N. Lau, H. M. Jaeger, and S. R. Nagel, Phys. Rev. E 51, 3957 (1995).
- Lacevic et al. (2008) N. Lacevic, L. E. Fried, and R. H. Gee, J. Chem. Phys. 128, 014903 (2008).
- Pickett et al. (2000) G. T. Pickett, M. Gross, and H. Okuyama, Phys. Rev. Lett. 85, 3652 (2000).