Shimizu et al.Flare associated high-speed photospheric flow in a -type sunspot
and
Sun: flares, sunspots, Sun: photosphere, Sun: magnetic fields, Sun: evolution
High speed photospheric material flow observed at the polarity inversion line of a -type sunspot producing an X5.4 flare on 7 March 2012
Abstract
Solar flares abruptly release the free energy stored as a non-potential magnetic field in the corona and may be accompanied by eruptions of the coronal plasma. Formation of a non-potential magnetic field and the mechanisms for triggering the onset of flares are still poorly understood. In particular, photospheric dynamics observed near those polarity inversion lines that are sites of major flare production have not been well observed with high spatial resolution spectro-polarimetry. This paper reports on a remarkable high-speed material flow observed along the polarity inversion line located between flare ribbons at the main energy release side of an X5.4 flare on 7 March 2012. Observations were carried out by the spectro-polarimeter of the Solar Optical Telescope onboard Hinode. The high-speed material flow was observed in the horizontally-oriented magnetic field formed nearly parallel to the polarity inversion line. This flow persisted from at least 6 hours before the onset of the flare, and continued for at least several hours after the onset of the flare. Observations suggest that the observed material flow represents neither the emergence nor convergence of the magnetic flux. Rather, it may be considered to be material flow working both to increase the magnetic shear along the polarity inversion line and to develop magnetic structures favorable for the onset of the eruptive flare.
1 Introduction
Solar flares and their associated coronal mass ejections, the most energetic bursts in our solar system, abruptly release the free energy stored as a non-potential magnetic field in the corona and may be accompanied by eruptions of the coronal plasma, giving rise to abrupt, widespread, and sometimes severe alterations of the solar-terrestrial environment. The formation in the corona of an S-shaped structure called a sigmoid (Rust & Kumar, 1996; Canfield et al., 1999) is one indicator of a non-potential magnetic field that may lead to eruptive major flares. Sigmoids are formed in the corona, associated with temporal evolution of magnetic flux at the photosphere including footpoint motions of magnetic flux and the emergence of twisted flux from below the photosphere. Most theoretical studies assume one of two typical motions at the photosphere for developing a non-potential field in the corona: shear motions along polarity inversion line or converging motions toward the polarity inversion line. With such motions, a helically-twisted flux rope is created in the corona by reconnection along the polarity inversion line. This flux rope may be inferred to be the magnetic structure that supports dense filament plasma in the active region (van Ballegooijen & Martens, 1989; Amari et al., 2000). An alternate model is the emergence of twisted flux from below the photosphere, forming a non-potential structure in the corona (Magara & Longcope, 2001; Archontis & Hood, 2012). In this scenario, observations of the footpoint motions of the magnetic field at the photosphere are necessary to identify motions and dynamical behavior that are responsible for building up a non-potential field in the corona. At the same time, footpoint motions and dynamical behavior of the magnetic field play key roles in triggering the onset of major flares. In most numerical simulations, applying either a shear or a converging motion to the photospheric magnetic field, or injecting emerging flux at the photosphere, act as a trigger for the onset of mass ejections and flares. High resolution and accurate observations for identifying these motions and dynamical behavior are still limited.
Most of major flares (X and M5 flares) are produced in -type sunspots (Sammis, Tang & Zirin, 2000). The -type is one of Hale’s sunspot magnetic classes. It has a penumbra enclosing umbrae of both positive and negative polarity. High magnetic shear is sometimes observed at the polarity inversion line that, by definition, is present in -type sunspots. The polarity inversion line is the locus where radial field reverses direction. The magnetic field near the polarity inversion line may show complicated configurations with steady and/or dynamic material flows. Martínez Pillet et al. (1994) reported extremely large downward-directed Doppler velocities in the vicinity of the polarity inversion line of a -type sunspot. Lites et al. (2002) reported Doppler shifts implying high-velocity, steady flows converging upon the line separating opposite polarity magnetic fields. These flows were interpreted within the context of the Evershed flow observed in all sunspots. Takizawa et al. (2012) detected continuous prominent downflows of km s-1 for several hours at the polarity inversion line. Moreover, there are some reports on remarkable long-lived flows associated with the occurrence of major flares, although reports so far are rare. Meunier & Kosovichev (2003) observed long-lived, highly inclined supersonic photospheric downflows and possible shear flows in a flaring active region. Yang et al. (2004) and Deng et al. (2006) also observed long-lived (at least 5 hr) strong horizontal and vertical shear flows (both in the order of 1 km s-1) along the polarity inversion line until an X-class flare occurred. Both horizontal and vertical shear flows enhanced dramatically after that flare, suggesting that photospheric shear flows and local magnetic shear near the polarity inversion can increase after the flare as the result of shear release in the overlying large-scale magnetic system.
These Doppler velocities are observed in regions of complicated magnetic field. Therefore, accurate spectro-polarimetry that provides quantitative measures of the magnetic field vector is necessary to extract information about flow field in the small-scale magnetic field structure. There is a high incidence of major flares in the vicinity of the polarity inversion lines of -type sunspots, therefore the dynamical behavior giving rise to Doppler shifts revealed by spectro-polarimetry may provide hints toward understanding the build-up and trigger process of flares. In this paper, we investigate Doppler velocity and magnetic fields around the polarity inversion line in a sequence of three spectro-polarimetric maps acquired in an 8 hour period during which a major flare took place. Section 2 describes observations and data analysis. After identifying the main energy release site of the flare in Section 3, we present Doppler velocity and magnetic field maps at the energy release site in Section 4. The energy release site has a polarity inversion line between the chromospheric flare ribbons, where a remarkable high speed photospheric flow is found along the polarity inversion line. We discuss the results in section 5 and finally conclude in section 6.
2 Observations and data analysis
An X5.4 flare was produced on 7 March 2012 from NOAA Active Region 11429, which was a complex of sunspots including -type sunspots. Figure 1 shows the time profiles of soft X-ray flux from GOES. The soft X-ray flux of this X5.4 flare began to increase at 00:00 UT, and peaked at 00:24 UT on 7 March 2012. The location of the flare was reported to be N17 E27 on the solar disk. The flare was followed by an X1.3 flare whose peak at 1:14 UT was located at N22 E12. The coronal mass ejection launched at the same time as the X5.4 flare propagated through interplanetary space and caused a large geomagnetic storm on 9 March (Tsurutani et al., 2014).
The Solar Optical Telescope (SOT) (Tsuneta et al., 2008; Suematsu et al., 2008; Shimizu et al., 2008; Ichimoto et al., 2008) onboard Hinode (Kosugi et al., 2007) observed this active region and acquired Stokes spectral profiles with the spectro-polarimeter (SP) for monitoring the temporal evolution of photospheric magnetic field after 10 UT, 6 March 2012. The SP (Lites et al., 2013) records the full-polarization states of line profiles of two magnetically sensitive Fe I lines at 630.15 and 630.25 nm. The fast-mapping mode was used, which covers the entire sunspot with 0.32” effective pixel size. The spectral sampling is 21.549 mÅ pixel-1.
In this study, we analyzed three SP maps in detail. Two of the maps were recorded at 17:30-18:02 UT and 22:10-22:43 UT, 6 March 2012, i.e., about 6 hours and 1.5 hours before the onset of the X5.4 flare, respectively. The last map was recorded at 2:21-2:54 UT, 7 March 2012, i.e., about 2 hours after the onset of the X5.4 flare. We utilized the SOT/SP level2 database, which are outputs from inversions using the MERLIN inversion code developed under the Community Spectro-polarimetric Analysis Center (CSAC) initiative (http://www.csac.hao.ucar.edu/) at HAO/NCAR. The inversion code performs a least-squares fitting of the Stokes profiles using the Milne-Eddington atmospheric approximation that allows for a linear variation of the source function along the line-of-sight, but holds the magnetic field vector, line strength, Doppler shift, line broadening, magnetic fill fraction constant along the line-of-sight.
The 180\degree ambiguity in the azimuth angle of magnetic field was resolved by using the AZAM utility (Lites et al., 1995), where the azimuth was selected to minimize spatial discontinuities in the field orientation. Since magnetic field configuration near the polarity inversion line is complex and there is some subjectivity to the “disambiguation”, two of the authors obtained the 180\degree ambiguity resolution independently and verified consistency of the two results. The magnetic field presented in this paper is in the local solar frame, i.e., the coordinate transformed as if viewed from directly above. The position on the solar disk was used to transform the vector magnetic field from the observing (line-of-sight) frame coordinates to local solar frame coordinates.
Line-of-sight magnetograms from the Helioseismic and Magnetic Imager (HMI; Scherrer et al. (2012); Schou et al. (2012)) on board Solar Dynamics Observatory (SDO; Pesnell et al. (2012)) were also examined for monitoring the temporal evolution of photospheric magnetic flux at the polarity inversion line. HMI observes the full solar disk at 617.3 nm with a spatial resolution of 1” and produces line-of-sight magnetograms in a cadence of 45 sec. We utilized the HMI level2 database available from the Joint Science Operations Center at Stanford.
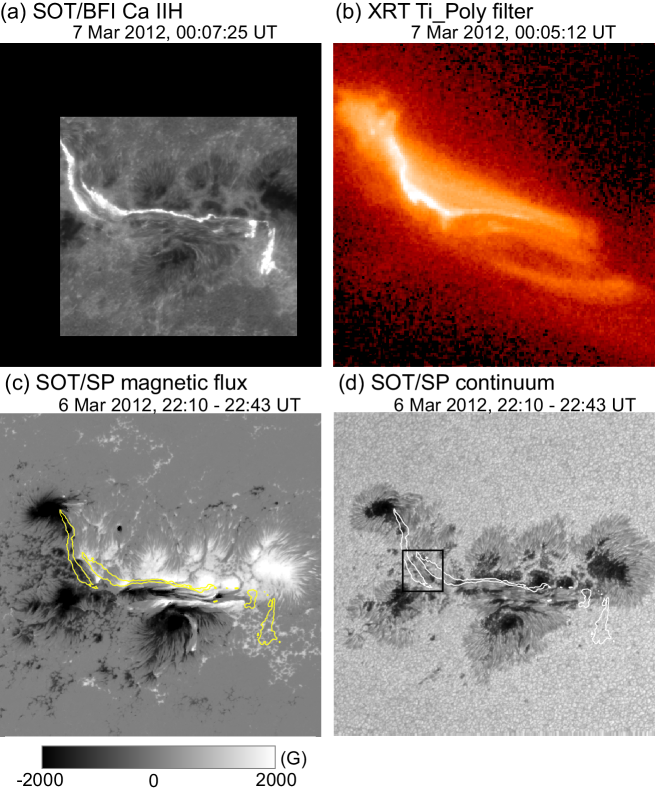
From simultaneous time series of chromospheric and X-ray imaging obtained by Hinode, Figure 2 shows a Ca II H image recorded with the SOT broadband imager (BFI) at 00:07:25 UT on 7 March 2012 and a soft X-ray image (Ti Poly filter) from the Hinode X-ray Telescope (XRT) (Golub et al., 2007; Kano et al., 2008). These image sequences were used to identify the footpoints of flaring arcade loops and the main energy release site of the flare.

3 Energy release site of X5.4 flare
Figure 2(a) shows the location of flare ribbons seen in the chromospheric Ca II H image just after the time of the flare onset. Two bright ribbons appeared with a short ribbon at the left and a longer ribbon at the right. The short ribbon is located in the negative polarity region and the long ribbon is in the positive polarity side. The spatial arrangement of the flare ribbons indicates that sheared magnetic field in the corona is involved in the main energy release of the X5.4 flare. The series of soft X-ray images also show the presence of a sigmoid and a bright flaring X-ray source appeared after the onset of the flare. The initial phase of the bright flaring X-ray source is seen in Figure 2(b). The bright source was confined, and existed along the polarity inversion line. The brightest portion of the bright X-ray source is located in the square (about arc sec) given in Figure 2(d). In the square, the separation between the flare ribbons in Ca II H is about 10 arc sec, and the polarity inversion line is located almost parallel to and between the flare ribbons. In subsequent sections, we will investigate the photospheric magnetic field and line-of-sight velocity field in the square for understanding the formation and trigger of the X5.4 flare.
It is noted that the energy release site of the following X1.3 flare differs slightly from that of the X5.4 flare. The bright source of the X5.4 flare gradually evolved to an arcade-like coronal structure at the left half of the active region. At the time of the X1.3 flare, a low-lying sheared coronal structure at the right half of active region suddenly brightened and formed an X-ray arcade.
4 High speed photospheric material flow
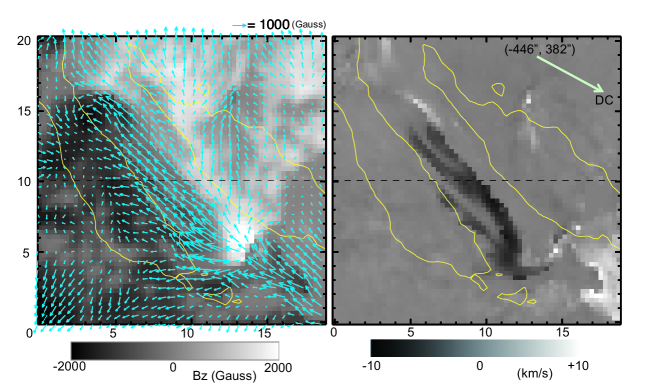
Figure 3 shows the photospheric magnetic field and line-of-sight velocity field at the main energy release site, i.e., in the square given in Figure 2. In the left panel, arrows give the horizontal component of the vector magnetic field (, ) in the local solar frame. The background image is the vertical component of the vector magnetic field () and the positive and negative polarity flux is represented by white and black, respectively. The data show that the horizontally-oriented field is dominant in the region between the flare ribbons at the main energy release site, and that it is nearly parallel to the polarity inversion line located between the flare ribbons. At the both ends of the horizontal field, compact positive- and negative-polarity islands exist. Since the positive island at the SW [(13, 5) arc sec in Figure 3] is located on the positive side of the polarity inversion line and the negative island at NE [(3, 15) arc sec in Figure 3] is on the negative side, the horizontal field crossing the polarity inversion line may be considered as having high magnitude of shear.
The right panel of Figure 3 shows the spatial distribution of Doppler signals at the photosphere for the main energy release site. Negative Doppler signals are recognized in majority of the horizontal field. The speed is a few km s-1 with supersonic speed over 5 km s-1 at some pixels. Negative means blue-shifted, i.e., Doppler shift toward the observer. Since the region is located at (-446, 382) arc sec on the NE quadrant of the solar disk, the direction normal to the solar surface is tilted about 30\degree from the line-of-sight direction. Therefore, the observed negative Doppler signals imply one-directional material flow from the negative-polarity island to the positive-polarity island under the assumption that the Doppler velocity vector is aligned with the magnetic field vector.
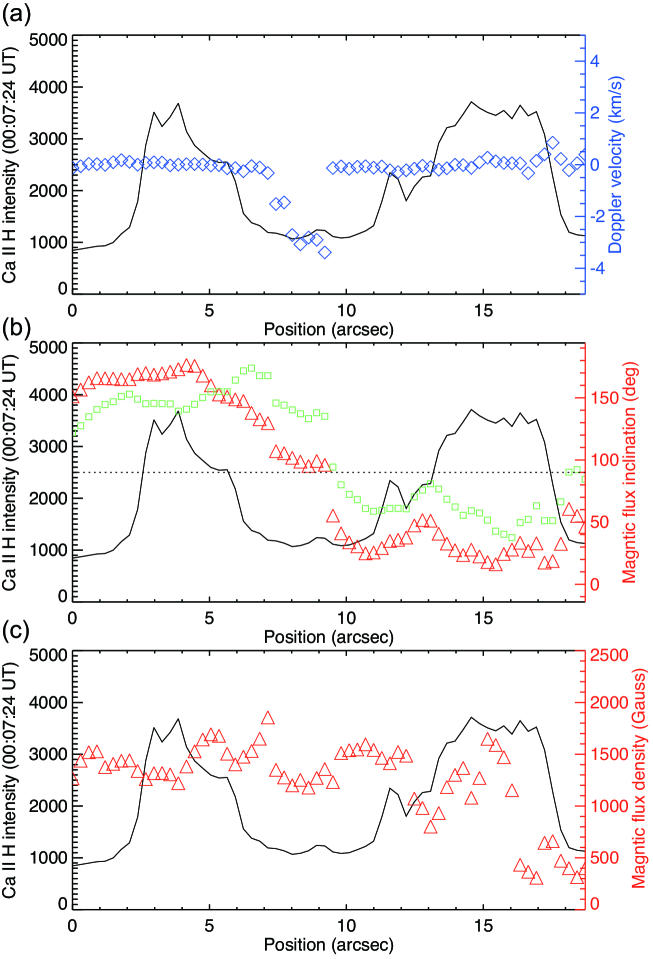
Figure 4 shows the profiles of the Doppler velocity and magnetic field quantities on the dashed line that passes through the middle of the field of view in Figure 3. Doppler shift signals corresponding to 2.5-3.2 km s-1 are observed between the flare ribbons. They are observed to be co-spatial with the horizontally-oriented magnetic field. As shown by red triangles in Figure 4(b), the inclination of the magnetic field associated with the Doppler shift signals is 95-105\degree in the local solar frame, where 90\degree is horizontal field, i.e.,the field in parallel to the solar surface. It should be noted that horizontally-oriented field has an inclination of 132-142\degree in the observer’s frame. This inclination is 38-48\degree from the line-of-sight direction, so that the uni-directional material flow in the horizontal field can show Doppler shift signals. Assuming that material flow is aligned to the horizontal, the actual flow speed may be 4.0-4.3 km s-1. The magnetic flux density of the horizontal field with the material flow is 1200-1400 Gauss.
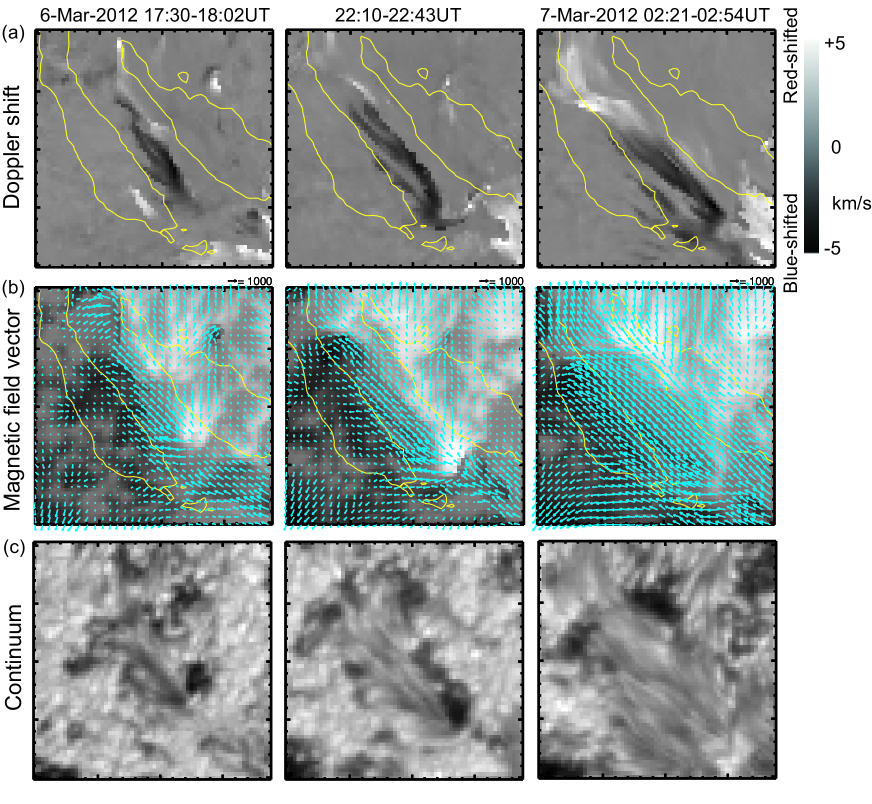
Figure 5 shows the temporal evolution of the Doppler shift signals, vector magnetic field, and photospheric morphology seen in continuum images. The three times correspond to about 6 hours and 2 hours before the onset of the X5.4 flare, and about 2 hours after the onset of the flare, respectively. The high-speed material flow is observed at least 6 hours before the flare onset time. It continues to develop even after the onset of the flare. Simultaneously, the area of the horizontally oriented field gradually increases with time through the sequence of the three maps. A positive polarity magnetic island exists at the SW end of the horizontal field, whereas a negative polarity island is observed at the NE end of the horizontal field.
A quantitative measure of these magnetic fields is listed in Table 1. The inclination () of the horizontal field is on the local solar frame coordinate, in which 90\degree means the field parallel to the solar surface. The error values give the standard deviation of the field inclination distributed in the horizontal field region. The magnetic flux density () is the average measured in the middle area of the horizontal field region with the standard deviation of the flux density in the measured area. Since the magnetic flux is horizontally oriented to the solar surface, we estimated the magnetic flux () crossing the line-forming height of the Fe I lines by
| (1) |
For the cross section of the magnetic flux, we used the measured width () of the horizontal flux region and adapted 100 km as the vertical extent () of the magnetic flux. It is roughly same as the scale height at the photosphere. The magnetic flux does not change from 17 UT to 22 UT, but it is increased by 2.6 times at 2 UT. The azimuthal direction of the horizontal field does not change with time and it is almost in parallel to the polarity inversion line. Note that 0\degree is the direction toward the west and 90\degree is toward the north. The orientation of the flare ribbons (Figure 5) is aligned almost in parallel to the direction of the horizontal field.
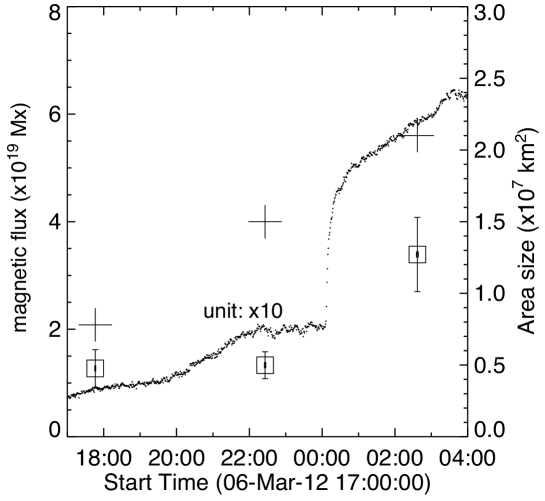
The evolution of the magnetic flux and region size is plotted in Figure 6 with the temporal evolution of line-of-sight magnetogram signals for the region of interest, recorded in high cadence by HMI. The HMI magnetogram evolution shows a small increase in the period before the onset of the X5.4 flare and a significant increase from the flare onset time. Since the line-of-sight direction is about 30\degree tilted from the direction normal to the solar surface at the region of interest, the enlarging region of the horizontal field is observed as the region of the negative-polarity magnetic flux in the line-of-sight magnetograms.
Table 1 also shows the magnetic flux involved in each magnetic flux island for the three maps. Since the positive polarity island is distinct relative to its surroundings in the magnetic flux density map, the magnetic flux involved in the positive polarity island is well-measured. It is noted that the measured values of flux for the negative polarity flux island may contain small amounts of flux from its surroundings because of its indistinct boundary. The positive polarity flux shows a slight increase from 17 UT to 22 UT, but after the X5.4 flare the flux has reduced to one eighth of the pre-flare flux. The separation between the magnetic islands increases slowly with time. The speed of separation is 0.13 km s-1 in the period from 17 to 22 UT and 0.04 km s-1 in the period from 22 to 2 UT. The continuum images reveal penumbra-like structures (orphan penumbra) under development, and these are associated with high-speed material flow.
| 17:38-17:40 UT | 22:18-22:21 UT | 2:29-2:32 UT | |
| Horizontal field region | |||
| Region size ( km2) | 0.8 | 1.5 | 2.1 |
| Flux inclination (\degree) | |||
| Magnetic flux density (Gauss) | |||
| Magnetic flux ( Mx) | |||
| Flux azimuth (\degree) | |||
| Magnetic islands | |||
| Positive polarity’s flux ( Mx) | |||
| Negative polarity’s flux ( Mx) | |||
| Separation between the islands (arc sec) | 9.4 | 12.5 | 13.3 |
5 Discussion
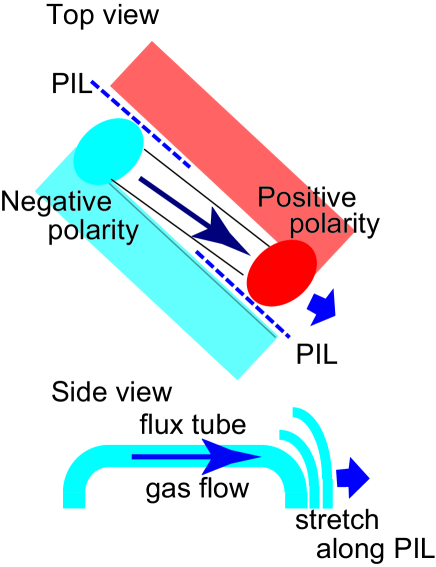
We observed high-speed Doppler shifts along the polarity inversion line located between the flare ribbons of an X5.4 flare occurred on 7 March 2012. Observed features around the polarity inversion line in the photosphere are summarized in Figure 7. A pair of small magnetic islands exist at the polarity inversion line. The positive polarity island is located on the positive-polarity side and the negative polarity island is located on the negative-polarity side. The orientation of the line defined by the positive and negative polarity islands is directed nearly along the polarity inversion line. Magnetic fields parallel to the solar surface form between the islands. A high-speed uni-directional material flow persists in this horizontal field between the islands. The horizontal field is also associated with the development of penumbra-like features in continuum images. The separation between the magnetic islands increases slowly with time but the separation speed is slow (0.13 km s-1 to 0.04 km s-1). The positive-polarity island located at the end point of the high speed material flow shows decrease in magnetic flux – the largest decrease is observed in the latter 4-hour interval during which the X5.4 flare occurred.
The slow separation speed suggests that the development of horizontally-oriented field between the magnetic islands is not simply due to the emergence of new magnetic flux from below the photosphere. The temporal evolution of magnetic flux derived from the HMI line-of-sight magnetograms shows a small increase in the period before the time of the flare onset, but the increase may be artificial because of the flux estimate only with the line-of-sight component; The magnetic flux parallel to the solar surface is observed as the region of the negative-polarity magnetic flux in the line-of-sight magnetograms. Since the region covered by the horizontal field is enlarged with time, it results in the apparent increase of the magnetic flux. The two SP measurements before the onset time clearly show no increase in the magnetic flux of the horizontally oriented magnetic field at the photospheric level. A small amount of increase is seen in the magnetic flux of the magnetic islands at the both ends of the horizontal field ( Mx and Mx for the positive- and negative-polarity, respectively). When we assume that the successive emergence of the horizontal field ( Mx for a vertical thickness of 100 km) are evolved to the more vertical field at the both ends and added to the magnetic islands, the emergence up to the height of only 110-560 km is expected in the period between the two successive SP maps (281 min); The speed of the emergence is 0.006-0.033 km/s, which is about one order of magnitude smaller than the separation speed of the islands (0.13 km s-1) as well as about two orders of magnitude smaller than the typical speed of flux emergence at the photospheric level (Otsuji et al., 2011; Shimizu et al., 2002).
A significant enhancement of the magnetic flux in the horizontal magnetic field region was detected in the SP data acquired after the onset of the X5.4 flare. The time series of the HMI line-of-sight magnetograms shows that a rapid and significant increase of the negative-polarity signals in the region of interest has started from the time of the flare onset. A similar behavior showing a rapid and irreversible development of more horizontal orientation of the photospheric magnetic field at the flaring magnetic polarity inversion line after flares has been reported in many observations (e.g., Wang et al. (2012) and hereinafter); it is interpreted that the photospheric magnetic field near the polarity inversion line becomes more horizontal after eruptions, which could be related to the newly formed low-lying fields during flares. It, however, should be noted that the magnitude of the magnetic flux derived from the HMI line-of-sight magnetograms contains a large amount of uncertainty, compared with the magnetic flux from the SP measurements, because of the measurements of the only line-of-sight component of the magnetic flux.
The speed of the separation between the magnetic islands is slow (0.13-0.04 km s-1), but high-speed (about 4 km s-1) flows are observed in the horizontal field existing between the magnetic islands. These high-speed flows are interpreted as one-directional material flows excited in the magnetic channels which are horizontally oriented and connected between the magnetic islands. With the conclusion that the development of the horizontal magnetic field along the polarity inversion line is not due to a simple emergence of new magnetic flux from below the photosphere, the forces caused by emergence are not the primary cause of the one-directional material flows. The flows may be rather driven by the magnetic force given to the horizontal field. The existence of such flows can be a signature indicating that the magnetic field near the polarity inversion line is highly stressed, as shown in some numerical simulations (e.g., Manchester (2001); Fan (2001); Magara & Longcope (2003); Fang et al. (2012)).
The high-speed flows are observed only in the horizontal field and they are not observed in the positive-polarity flux concentration at the destination of the flows. The magnetic field from the flux concentration is extended from the photosphere to the upper atmosphere because of more vertical orientation, whereas the magnetic channels harboring the high-speed flows may turn back toward the solar interior deep in the atmosphere at the outer reaches of the horizontal field, where the flow may stretch the magnetic field and work as a shear flow along the polarity inversion line, rather than a flow converging toward it. The increasing separation of the magnetic islands enhances the shear in magnetic field because the positivity polarity island is located at the positive-polarity side and the negative polarity island is located at the negative-polarity side of the polarity inversion line. This may suggest further development of the non-potentiality of the magnetic structure. However, the increase of shear in magnetic field may affect a limited portion of the magnetic flux involved in the flare because the length of the separation between the magnetic islands is km, much shorter than the length of the flare ribbons. High-speed uni-directional material flow along the horizontal field may stretch the magnetic field and cause the positive polarity island to move along the polarity inversion line. The kinetic energy of the material flow is estimated to be of order ergs, which may be sufficient energy to stretch and apply the shear force to the magnetic field in the high plasma of the photosphere. In the gas pressure dominant condition, the gas flow applies the additional force to the magnetic field and may easily move the magnetic flux.
The observed high-speed material flow also may make a significant contribution to forming the magnetic structures responsible for the onset of flares. Recently, Kusano et al. (2012) systematically surveyed the nonlinear evolution of magnetic structures toward eruption in terms of three-dimensional magnetohydrodynamic simulations. By injecting a small-scale bipole field near the polarity inversion line of a large-scale force-free field structure, they identified two typical magnetic structures favorable for the onset of eruptive flares: the orientation of the small bipole field is opposite of the major polarity (opposite-polarity (OP) type) or reversed to the averaged magnetic shear (reversed-shear (RS) type). Hinode observations showed that four major flares have either OP or RS type configurations (Bamba et al., 2013). The photospheric magnetic flux distribution of the X5.4 flare may be classified as the RS type configuration. The pair of the positive and negative polarity islands with the uni-directional material flow, however, is not the small-scale bipole field in the Kusano et al. (2012) model because the magnetic shear in the large-scale magnetic structure (inferred from the spatial distribution of flare ribbons in Figure 2(a)) has almost in the same direction as the orientation of the pair of the positive and negative polarity islands. The RS type configuration rather suggests that the combination of the positive polarity island at the end point of the uni-directional material flow with the negative polarity flux distributed at the SW of the positive polarity island should be considered as the small-scale bipole field. The positive polarity island at the end point of the uni-directional material flow is moved in the SW direction slowly and thus come into close contact with the negative polarity flux, which may be preferable for magnetic flux cancellation. Moreover, this negative polarity flux is located at the end point of the significant positive (i.e., red-shifted) Doppler signal seen at the lower right edge of Figure 5. This significant positive Doppler signal means that a different uni-directional material flow exists in the magnetic flux system including the negative polarity flux and that its flow direction is opposite to the uni-directional material flow presented in Section 4. Two material flows streaming in the opposite direction to each other may squeeze together the positive-polarity island and negative-polarity flux, which is more preferable for magnetic flux cancellation. This suggests an important role of the observed high-speed material flow in creating the magnetic field configuration favorable for the onset of the X5.4 flare.
6 Summary
High-speed photospheric Doppler shifts are found along the polarity inversion line located between the flare ribbons of an eruptive major flare on 7 March 2012. They are observed in a horizontally-oriented magnetic field formed between positive-polarity and negative-polarity magnetic islands. Considering that the line-of-sight view for this field nearly parallel to the solar surface, the observed Doppler shifts are interpreted as a uni-directional material flow and the flow is observed to persist from at least 6 hours before to at least several hours after the onset of the flare. The temporal evolution of the magnetic flux suggests that the development of the horizontally-oriented field associated with the material flow is not simply due to the emergence of new magnetic flux from below the photosphere. The material flow is not a converging flow toward the polarity inversion line but it can be recognized as a flow increasing the shear in magnetic flux. Also, the material flow may have enough kinetic energy to move the magnetic flux more easily in the high plasma at the photosphere and to form the magnetic structures favorable for the onset of the eruptive flare.
The polarity inversion line contains key information for the build-up of magnetic energy and the triggering of solar flares. In addition to the evolving magnetic field configuration, material flows around the polarity inversion line are one important factor for creating and driving flares. Many more observational examples are needed to establish a statistical basis for revealing general characteristics of material flows around the polarity inversion line and their role in the occurrence of flares. We expect that the Hinode Solar Optical Telescope and other instruments will acquire more good examples of the photospheric magnetic and velocity fields at the polarity inversion line of major flares during the maximum phase of the current solar cycle.
We would like to express our thanks to the anonymous referee for fruitful comments. Hinode is a Japanese mission developed and launched by ISAS/JAXA, with NAOJ as domestic partner and NASA and STFC (UK) as international partners. It is operated by these agencies in co-operation with ESA and NSC (Norway). We also gratefully acknowledge NASA’s Solar Dynamics Observatory and the HMI science team for providing the magnetograms. This work was supported by JSPS KAKENHI Grant Number 23540278 and JSPS Core-to-Core Program 22001.
References
- Amari et al. (2000) Amari, T., Luciani, J. F., Mikic, Z., Linker, J. 2000, ApJ, 529, L49
- Archontis & Hood (2012) Archontis, V., Hood, A. W. 2010, A&A, 514, A56
- Bamba et al. (2013) Bamba, Y., Kusano, K., Yamamoto, T.T., Okamoto, T. J. 2013, ApJ, 778, 48
- Canfield et al. (1999) Canfield, R. C., Hudson, H. S., McKenzie, D. E. 1999, Geophys. Res. Lett., 26, 627
- Deng et al. (2006) Deng,N., Xu, Y., Yang, G., Cao, W., Liu, C., Rimmele, T.R., Wang, H., Denker, C. 2006, ApJ, 644, 1278
- Fan (2001) Fan, Y. 2001, ApJ, 554, L111
- Fang et al. (2012) Fang, F., Manchester, W., IV, Abbett, W.P., van der Holst, B. 2012, ApJ, 754, 15
- Golub et al. (2007) Golub, L. et al. 2007, Sol. Phys., 243, 63
- Ichimoto et al. (2008) Ichimoto, K. et al. 2008, Sol. Phys., 249, 233
- Kano et al. (2008) Kano, R. et al. 2008, Sol. Phys., 249, 263
- Kosugi et al. (2007) Kosugi, T. et al. 2007, Sol. Phys., 243, 3
- Kusano et al. (2012) Kusano, K., Bamba, Y., Yamamoto, T.T., Iida, Y., Toriumi, S., Asai, A. 2012, ApJ, 760, 31
- Lites et al. (1995) Lites, B. W., Low, B. C.,Mart? Lnez Pillet, V., Seagraves, P., Skumanich, A., Frank, Z. A., Shine, R. A., Tsuneta, S. 1995, ApJ, 446, 877
- Lites et al. (2002) Lites, B. W., Socas-Navarro, H., Skumanich, A., Shimizu, T. 2002, ApJ, 575, 1131
- Lites et al. (2013) Lites, B. W., Akin, D. L., Card, G., Cruz, T., Duncan, D. W., Edwards, C. G., Elmore, D. F., Hoffmann, C., Katsukawa, Y., Katz, N., Kubo, M., Ichimoto, K., Shimizu, T., Shine, R. A., Streander, K. V., Suematsu, A., Tarbell, T. D., Title, A. M., Tsuneta, S. 2013, Sol. Phys., 283, 579
- Manchester (2001) Manchester, W., IV 2001, ApJ, 547, 503
- Magara & Longcope (2001) Magara, T., Longcope, D. W. 2001, ApJ, 559, L55
- Magara & Longcope (2003) Magara, T., Longcope, D. W. 2003, ApJ, 586, 630
- Martínez Pillet et al. (1994) Martínez Pillet, V., Lites, B. W., Skumanich, A., Degenhardt, D. 1994, ApJ, 425, L113
- Meunier & Kosovichev (2003) Meunier, N., Kosovichev, A. 2003, A&A, 412, 541
- Otsuji et al. (2011) Otsuji, K., Kitai, R., Ichimoto, K., Shibata, K. 2011, PASJ, 63, 1047
- Pesnell et al. (2012) Pesnell, W. D., Thompson, B. J., Chamberlin, P. C. 2012, Sol. Phys., 275, 3
- Rust & Kumar (1996) Rust, D. M., Kumar, A. 1996, ApJ, 464, L199
- Sammis, Tang & Zirin (2000) Sammis, I., Tang, F., Zirin, H. 2000, ApJ, 540, 583
- Scherrer et al. (2012) Scherrer, P.H., Schou, J., Bush, R.I. et al. 2012, Sol. Phys., 275, 207
- Schou et al. (2012) Schou, J., Scherrer, P.H., Bush, R. I. et al. 2012, Sol. Phys., 275, 229
- Shimizu et al. (2002) Shimizu, T., Shine, R.A., Title, A.M., Tarbell, T.D., Frank, Z. 2002, ApJ, 574, 1074
- Shimizu et al. (2008) Shimizu, T. et al. 2008, Sol. Phys., 249, 221
- Suematsu et al. (2008) Suematsu, Y. et al. 2008, Sol. Phys., 249, 197
- Takizawa et al. (2012) Takizawa, K., Kitai, R. Zhang, Y. 2012, Sol. Phys., 281, 599
- Tsuneta et al. (2008) Tsuneta, S. et al. 2008, Solar Physics, 249, 167
- Tsurutani et al. (2014) Tsurutani, B.T., Echer, E., Shibata, K., Verkhoglyadova, O.P., Mannucci, A.J., Gonzalez, W.D., Kozyra, J.U., Pätzold, M. 2014, J. Space Weather Clim., 4, A02
- van Ballegooijen & Martens (1989) van Ballegooijen, A. A., Martens, P. C. H. 1989, ApJ, 343, 971
- Wang et al. (2012) Wang, S., Liu, C., Liu, R., Deng, N., Liu, Y., Wang, H. 2012, ApJ, 745, L17
- Yang et al. (2004) Yang, G., Xu, Y., Cao, W., Wang, H., Denker, C., Rimmele, T. R. 2004, ApJ, 617, L151