Predicting epidemic risk
from past temporal contact data
Eugenio Valdanoa,b, Chiara Polettoa,b, Armando Giovanninic, Diana Palmac, Lara Savinic, and Vittoria Colizzaa,b,d
aINSERM, UMR-S 1136, Institut Pierre Louis d’Epidémiologie et de Santé Publique, F-75013
27 rue Chaligny, 75571 Paris, France.
bSorbonne Universités, UPMC Univ Paris 06, UMR-S 1136, Institut Pierre Louis d’Epidémiologie et de Santé Publique, F-75013
27 rue Chaligny, 75571 Paris, France.
cIstituto Zooprofilattico Sperimentale Abruzzo-Molise G. Caporale
Campo Boario, 64100 Teramo, Italy.
dISI Foundation
Via Alassio 11/c, 10126 Torino, Italy.
Abstract
Understanding how epidemics spread in a system is a crucial step to prevent and control outbreaks, with broad implications on the system’s functioning, health, and associated costs. This can be achieved by identifying the elements at higher risk of infection and implementing targeted surveillance and control measures. One important ingredient to consider is the pattern of disease-transmission contacts among the elements, however lack of data or delays in providing updated records may hinder its use, especially for time-varying patterns. Here we explore to what extent it is possible to use past temporal data of a system’s pattern of contacts to predict the risk of infection of its elements during an emerging outbreak, in absence of updated data. We focus on two real-world temporal systems; a livestock displacements trade network among animal holdings, and a network of sexual encounters in high-end prostitution. We define the node’s loyalty as a local measure of its tendency to maintain contacts with the same elements over time, and uncover important non-trivial correlations with the node’s epidemic risk. We show that a risk assessment analysis incorporating this knowledge and based on past structural and temporal pattern properties provides accurate predictions for both systems. Its generalizability is tested by introducing a theoretical model for generating synthetic temporal networks. High accuracy of our predictions is recovered across different settings, while the amount of possible predictions is system-specific. The proposed method can provide crucial information for the setup of targeted intervention strategies.
Introduction
Being able to promptly identify who, in a system, is at risk of infection during an outbreak is key to the efficient control of the epidemic. The explicit pattern of potential disease-transmission contacts has been extensively used to this purpose in the framework of theoretical studies of epidemic processes, uncovering the role of the pattern’s properties in the disease propagation and epidemic outcomes [1, 2, 3, 4, 5, 6, 7, 8]. These studies are generally based on the assumption that the entire pattern of contacts can be mapped out or that its main properties are known. Although such knowledge would be a critical requirement to conduct risk assessment analyses in real-time, which need to be based on the updated and accurate description of the contacts relevant to the outbreak under study [9], it can hardly be obtained in reality. Given the lack of such data, analyses generally refer to the most recent available knowledge of contact data, implicitly assuming a non-evolving pattern.
The recent availability of time-resolved data characterizing connectivity patterns in various contexts [10, 11, 12, 13, 14, 15, 16, 17, 18, 19, 20, 21, 22] has inevitably weakened the non-evolving assumption, bringing new challenges to the assessment of nodes’ epidemic risk. Traditional centrality measures used to identify vulnerable elements or influential spreaders for epidemics circulating on static networks [1, 2, 4, 23, 24, 25, 26, 27, 28, 29, 30] are unable to provide meaningful information for their control, as these quantities strongly fluctuate in time once computed on the evolving networks [19, 31]. An element of the system may thus act as superspreader in a past configuration of the contact network, having the ability to potentially infect a disproportionally larger amount of secondary contacts than other elements [32], and then assume a more peripheral role in the current pattern of contact or even become isolated from the rest of the system [19]. If the rules driving the change of these patterns over time are not known, what information can be extracted from past contact data to infer the risk of infection for an epidemic unfolding on the current (unknown) pattern?
Few studies have so far tried to answer this question by exploiting temporal information to control an epidemic through targeted immunization. They are based on the extension to temporal networks [33, 34] of the so-called acquaintance immunization protocol [4] introduced in the framework of static networks that prescribes to vaccinate a random contact of a randomly chosen element of the system. In the case of contacts relevant for the spread of sexually transmitted infections, Lee et al. showed that the most efficient protocol consists in sampling elements at random and vaccinating their latest contacts [33]. The strategy is based on local information gathered from the observation and analysis of past temporal data, and it outperforms static-network protocols. Similar results are obtained for the study of face-to-face contact networks relevant for the transmission of acute respiratory infections in a confined setting, showing in addition that a finite amount of past network data is in fact needed to devise efficient immunization protocols [34].
The aim of these studies is to provide general protocols of immunization over all possible epidemiological conditions of the disease (or class of diseases) under study. For this reason, protocols are tested through numerical simulations and results are averaged over starting seeds and times to compare their performance. Previous work has however shown that epidemic outcomes may strongly depend on the temporal and geographical initial seed of the epidemic [35], under conditions of large dynamical variability of the network and absence of stable structural backbones [19]. Our aim is therefore to focus on a specific epidemiological condition relative to a given emerging outbreak in the population, resembling a realistic situation of public health emergency. We focus on the outbreak initial phase prior to interventions when facing the difficulty that some infected elements in the population are not yet observed. The objective is to assess the risk of infection of nodes to inform targeted surveillance, quarantine and immunization programs, assuming the lack of knowledge of the explicit contact pattern on which the outbreak is unfolding. Knowledge is instead gathered from the analysis of the full topological and temporal pattern of past data (similarly to previous works [33, 34]), coupled, in addition, with epidemic spreading simulations performed on such data under the same epidemiological conditions of the outbreak under study. More specifically, we propose an egocentric view of the system and assess whether and to what extent the node’s tendency of repeating already established contacts is correlated with its probability of being reached by the infection. Findings obtained on past available contact data are then used to predict the infection risk in the current unknown epidemic situation. We apply this risk assessment analysis to two large-scale empirical datasets of temporal contact networks – cattle displacements between premises in Italy [19, 36], and sexual contacts in high-end prostitution [16] – and evaluate its performance through epidemic spreading simulations. We also introduce a model to generate synthetic time-varying networks retaining the basic mechanisms observed in the empirical networks considered, in order to explain the results obtained by the proposed risk assessment strategy within a general theoretical framework.
Results and Discussion
The cattle trade network is extracted from the complete dataset reporting on time-resolved bovine displacements among animal holdings in Italy [19, 36] for the period 2006–2010, and it represents the time-varying contact pattern among the premises composing the system. The sexual contact network represents the connectivity pattern of sexual encounters extracted from a Web-based Brazilian community where sex buyers provide time-stamped rating and comments on their experiences with escorts [16].
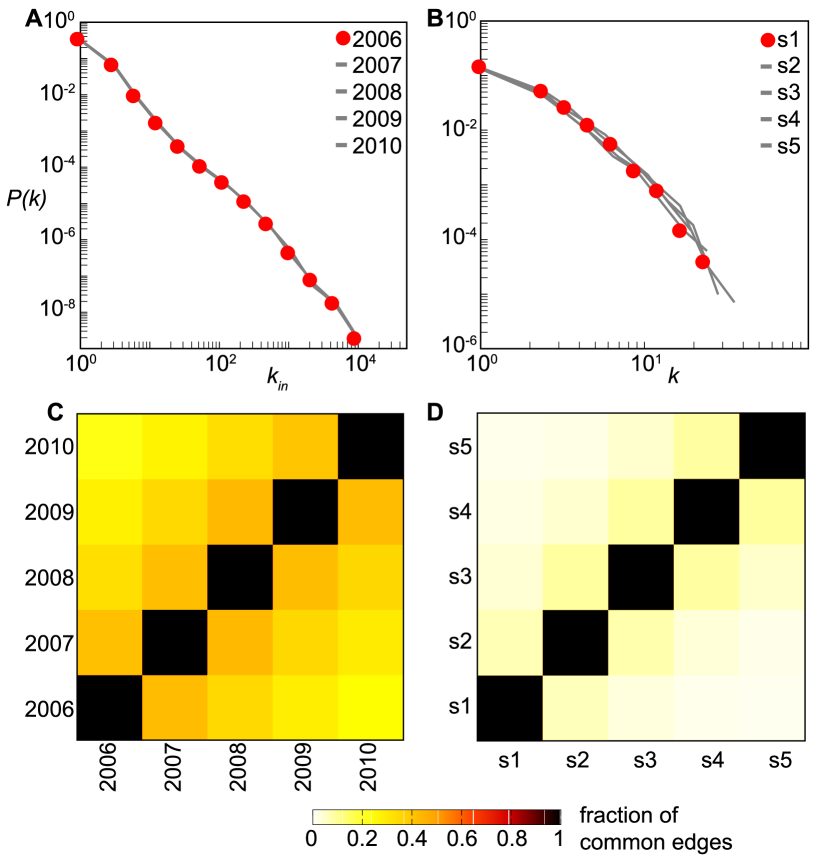
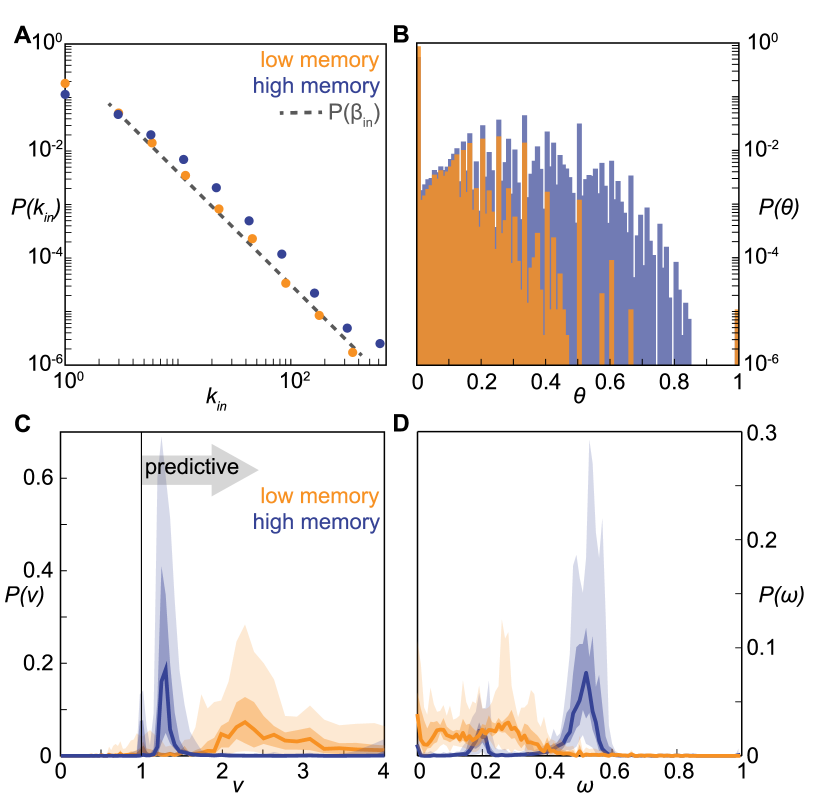
The five-years data of the livestock trade network show that stationary properties at the global level co-exist with an active non-trivial local dynamics. The probability distributions of several quantities measured on the different yearly networks are considerably stable over time, as e.g. shown by the in-degree distribution reported in Fig 1A, where the in-degree of a farm measures the number of premises selling cattle to that farm. These features, however, result from highly fluctuating underlying patterns of contacts, never preserving more than 50% of the links from one yearly configuration to another (Fig 1C), notwithstanding the seasonal annual pattern due to repeating cycles of livestock activities [37, 38] (see Supplementary Material). Similar findings are also obtained for the sexual contact network (Fig 1B-D), where the lack of an intrinsic cycle of activity characterizing the system leads to smaller values of the overlap between different configurations (). In this case we consider semi-annual configurations, an arbitrary choice that allows us to extract six network configurations in a timeframe exhibiting an approximately stationary average temporal profile of the system, after discarding an initial transient time period from the data [16]. Different time-aggregating windows are also considered (see the Materials and Methods section and Supplementary Material for additional details).
Loyalty
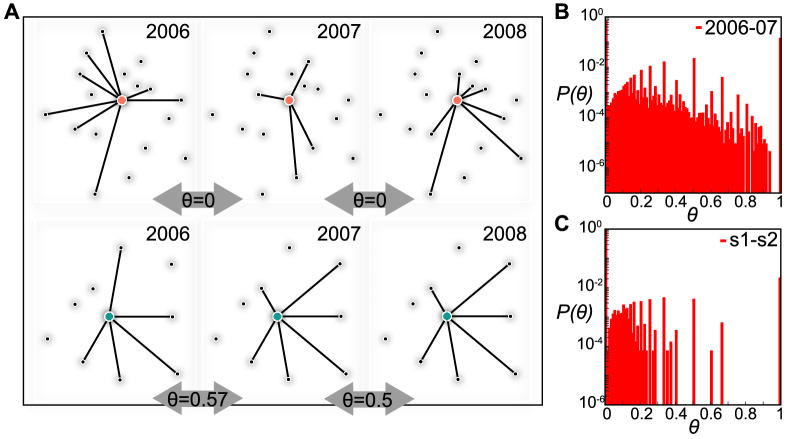
The observed values of the overlap of the time-resolved contact networks in terms of the number of links preserved are a measure of the degree of memory contained in the system. This is the outcome of the temporal activity of the elements of the system that reshape up to 50% or 90% of the contacts of the network (in the cattle trade case and in the sexual contact case, respectively), through nodes’ appearance and disappearance, and neighborhood restructuring. By framing the problem in an egocentric perspective, we can explore the behavior of each single node of the system in terms of its tendency to remain active in the system and re-establish connections with the same partners vs. the possibility to change partners or make no contacts. We quantitatively characterize this tendency by introducing the loyalty , a quantity that measures the fraction of preserved neighbors of a node for a pair of two consecutive network configurations in time, and . If we define as the set of neighbors of node in configuration , then is given by the Jaccard index between and :
| (1) |
Loyalty takes values in the interval , with indicating that no neighbors are retained, and that exactly the same set of neighbors is preserved (). It is defined for discrete time windows () and in general it depends on the aggregation interval chosen to build network configurations.
In case the network is directed, as for example the cattle trade network, can be equivalently computed on the set of incoming contacts or on the set of neighbors of outgoing connections, , depending on the system-specific interpretation of the direction and on the interest in one phenomenon or the opposite. This measure originally finds its inspiration in the study of livestock trade networks, where a directed connection from holding to holding indicates that purchased a livestock batch from , which was then displaced along the link direction . If we compute on the incoming contacts of the cattle trade network, we thus quantify the propensity of each farmer to repeat business deals with the same partners when they purchase their cattle. This concept is at the basis of many loyalty or fidelity programs that propose explicit marketing efforts to incentivize the reinforcement of loyal buying behavior between a purchasing client and a selling company [39], and corresponds to a principle of exclusivity in selecting economic and social exchange partners [40, 41]. Analogously, in the case of the sexual contact network we consider the point of view of sex buyers. Formally, our methodology can be carried out with the opposite point of view, by considering out-degrees with loyalties being computed on out-neighbors. Our choice is arbitrary and inspired by the trade mechanism underlying the network evolution.
Other definitions of similarity to measure the loyal behavior of a node are also possible. In Supplementary Material we compare and discuss alternative choices. For the sake of clarity all symbols and variables used in the article are reported in Table 1. Finally, other mechanisms different from fidelity strategies may be at play that result in the observed behavior of a given node. In absence of additional knowledge on the behavior underlying the network evolution, we focus on the loyalty to explore whether it can be used as a possible indicator for infection risk, as illustrated in the following subsection.
The distributions of loyalty values, though of different shapes across the two datasets, display no considerable variation moving along consecutive pairs of configurations of each dataset (Fig 2A-B and Supplementary Material), once again indicating the overall global stability of system’s properties in time and confirming the results observed for the degree. A diverse range of behaviors in establishing new connections vs. repeating existing ones is observed, similarly to the stable or exploratory strategies found in human communication [42]. Two pronounced peaks are observed for and , both dominated by low degree nodes for which few loyalty values are allowed, given the definition of Eq. (1) (see Supplementary Material for the dependence of on nodes’ degree and its analytical understanding). The exact preservation of the neighborhood structure () is more probable in the cattle trade network than in the sexual contact network ( being one order of magnitude larger), in agreement with the findings of a higher system-wide memory reported in Fig 1. Moreover, the cattle trade network exhibits the presence of high loyalty values (in the range ), differently from the sexual contact network where is always equal to zero in that range except for one pair of consecutive configurations giving a positive probability for . Farmers in the cattle trade network thus display a more loyal behavior in purchasing cattle batches from other farmers with respect to how sex buyers establish their sexual encounters in the analyzed sexual contact dataset.
For the sake of simplification, we divide the set of nodes composing each system into the subset of loyal nodes having greater than a given threshold , and the subset of disloyal nodes if instead . We call hereafter these classes as loyalty statuses L and D, respectively, and we will later discuss the role of the chosen value for .
Epidemic simulations and risk of infection
Both networks under study represent substrates offering potential opportunities for a pathogen to diffuse in the corresponding populations. Sexually transmitted infections spread among the population of individuals through sexual contacts [43, 44], whereas livestock infectious diseases (e.g. Foot-and-mouth disease [45], Bluetongue virus [46], or BVD [47]) can be transmitted from farm to farm mediated by the movements of infected animals (and vectors, where relevant), potentially leading to a rapid propagation of the disease on large geographical scales.
As a model for disease-transmission on the network of contacts we consider a discrete-time Susceptible-Infectious compartmental approach [48]. No additional details characterizing the course of infection are considered here (e.g. recovery dynamics), as we focus on a simplified theoretical picture of the main mechanisms of pathogen diffusion and their interplay with the network topology and time-variation, for the prediction of the risk of infection. The aim is to provide a general and conceptually simple framework, leaving to future studies the investigation of more detailed and realistic disease natural histories.
At each time step, an infectious node can transmit the disease along its outgoing links to its neighboring susceptible nodes that become infected and can then propagate the disease further in the network. Here, we consider a deterministic process for which the contagion occurs with probability equal to 1, as long as there exist a link connecting the infectious node to a susceptible one. Although a crude assumption, this allows us to simplify the computational aspects while focusing on the risk prediction. The corresponding stochastic cases exploring lower probabilities of transmission per link are reported in Supplementary Material.
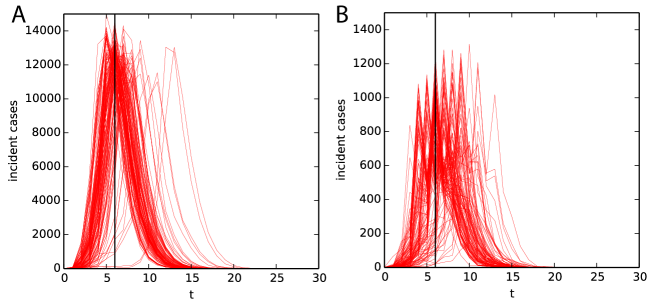
We focus on the early phase of the spreading simulations, defined as the set of nodes infected up to simulation time step . This choice allows us to study invasion stage only, while the epidemic is no more trivially confined to the microscopic level. Additional choices for have been investigated showing that they do not alter our findings (see Supplementary Material). Network configurations are kept constant during outbreaks, assuming diseases spread faster than network evolution, at least during their invasion stage. Examples of incidence curves obtained by the simulations are reported in Supplementary Material.
Livestock disease spread is often modeled by assuming that premises are the single discrete units of the spreading processes and neglecting the possible impact of within-farm dynamics [49]. This is generally considered in the study of highly contagious and rapid infections, and corresponds to regarding a farm as being infected as soon as it receives the infection from neighboring farms following the transport of contagious animals. Under this assumption, both case studies can be analyzed in terms of networks of contacts for disease transmission. In addition, for sake of simplicity, we do not take into account the natural definition of link weights on cattle network, representing the size of the moved batches. In Supplementary Material we generalize our methodology to the weighted case, including a weighted definition of loyalty, reaching results similar to the unweighted case.
We consider an emerging epidemic unfolding on a network configuration and starting from a single node (seed ), where the rest of the population of nodes is assumed to be initially susceptible. The details on the simulations are reported in the Material and Methods section. We define the set of nodes infected during the early stage invasion. In order to explore how the network topology evolution alters the spread of the disease, we consider an outbreak unfolding on the previous configuration of the system, , and characterized by the same epidemiological conditions (same epidemic parameters and same initial seed ). By comparing the set of infected nodes obtained in configuration to , we can assess changes in the two sets and how these depend on the nodes’ loyalty. We define a node’s infection potential () measuring the probability that a node will be infected in configuration by an epidemic starting from seed , given that it was infected in configuration under the same epidemiological conditions and provided that its loyalty status is ():
where is a node of the system. and thus quantify the effect of the temporal stability of the network at the local level (loyalty of a node) on the stability of a macroscopic process unfolding on the network (infection). They depend on the seed chosen for the start of the epidemic, on the pair of network configurations considered along its evolution, and also on the threshold value assumed for the definition of the loyalty status of the nodes.
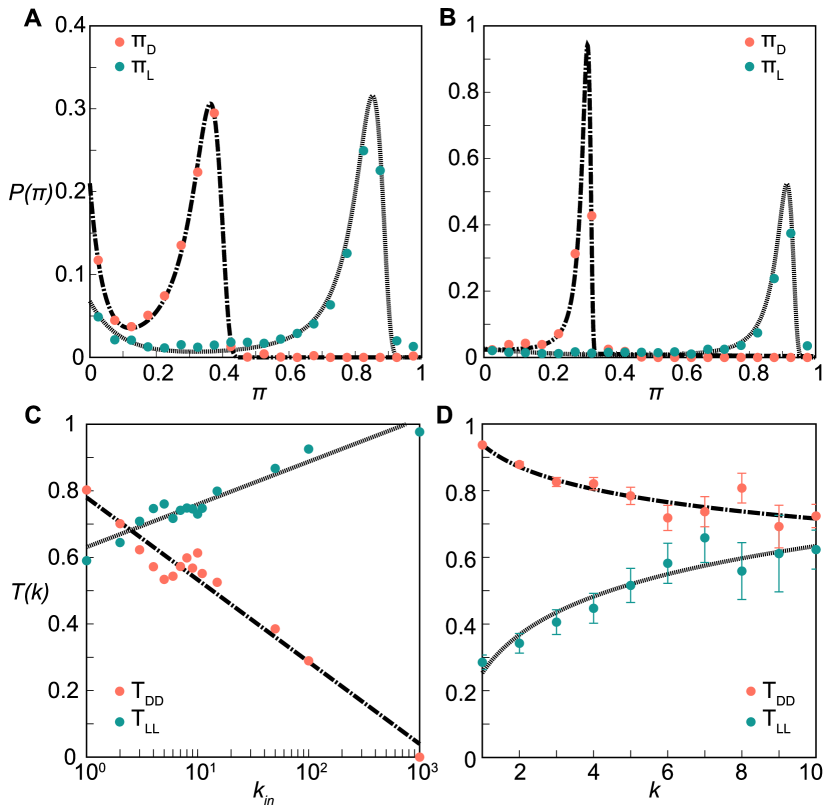
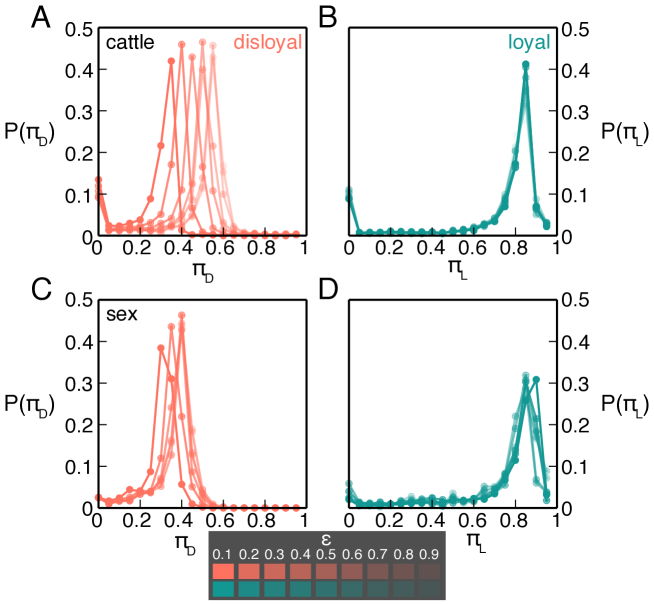
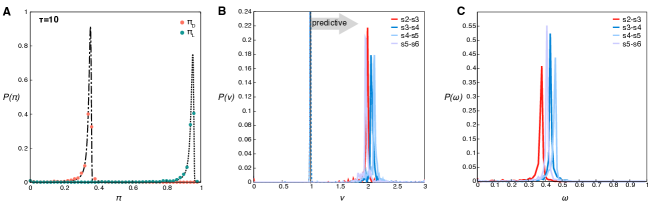
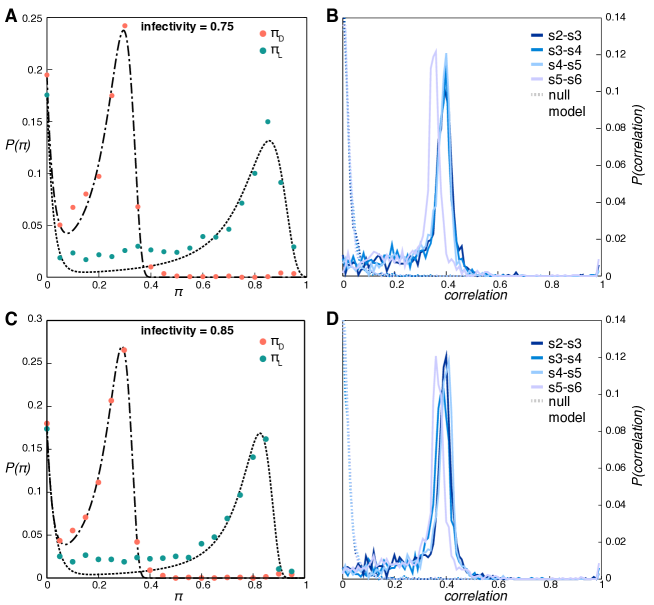
By exploring all seeds and computing the infection potentials for different couples of years, we obtain sharply peaked probability distributions of and around values that are well separated along the axis. Results are qualitatively similar in both cases under study, with peaks reached for in the cattle trade network and in the sexual trade network (Fig 3A-B). An observed infection in , based on the knowledge of the epidemiological conditions and no information on the network evolution, is an indicator of an infection risk for the same epidemic in more than twice larger for loyal farms with respect to disloyal farms. Analogously, loyal sex buyers have a threefold increase in their infection potential with respect to individuals having a larger turnover of partners. Remarkably, small values of loyalty threshold are able to correctly characterize the loyal behavior of nodes with status . Results shown in Fig 3A-B are obtained for . Findings are however robust against changes in the choice of the threshold value, as this is induced by the peculiar bimodal shape of the probability distribution curves for the loyalty (see Supplementary Material). This means that intermediate values of the local stability of the nodes (i.e. ) imply that a possible risk of being infected is strongly stable, regardless of the dynamics of the network evolution. Valid for all possible seeds and epidemiological conditions, this result indicates that the loyalty of a node can be used as an indicator for the node’s risk of infection, which has important implication for the spreading predictability in case an outbreak emerges.
These results are obtained for temporally evolving networks where no further change induced by the epidemic is assumed to occur. Focusing on the initial stage of the outbreak, we disregard the effect of interventions (e.g. social distancing, quarantine of infectious nodes, movements bans) or of adaptive behavior following awareness [37, 50, 51, 52, 53, 54]. Such assumption relies on the study’s focus on the initial stage of the epidemic that may be characterized by a silent spreading phase with propagation occurring before the alert or outbreak detection takes place; or, following an alert, by a contingent delay in the implementation of intervention measures.
Risk assessment analysis
The observed relationship between loyalty and infection potential can be used to define a strategy for the risk assessment analysis of an epidemic unfolding on an unknown networked system at present time, for which we have however information on its past configurations. This may become very useful in practice even in the case of complete datasets, as for example with emerging outbreaks of livestock infectious diseases. Data on livestock movements are routinely collected following European regulations [55], however they may not be readily available in a real-time fashion upon an emergency, and a certain delay may thus be expected. Following an alert for an emerging livestock disease epidemic, knowledge of past network configurations may instead be promptly used in order to characterize the loyalty of farmers, simulate the spread of the disease on past configurations and thus provide the expected risk of infection for the farms under the ongoing outbreak. The general scheme of the strategy for the risk assessment analysis is composed of the following steps, assuming that the past network configurations are known and that the epidemic unfolds on the unknown configuration :
-
1.
identify the seed of the ongoing epidemic;
-
2.
characterize the loyalty of the nodes from past configurations by computing from Eq. (1);
-
3.
predict the loyalty of the nodes for the following unknown configuration : ;
-
4.
simulate the spread of the epidemic on the past configuration under the same epidemiological conditions of the ongoing outbreak and identify the infected nodes ;
-
5.
compute the node epidemic risk for nodes in statuses and .
This strategy enables the assessment of the present infection risk (i.e. on configuration ) for all nodes hit by the simulated epidemic spreading on past configuration (), not knowing their present pattern of contacts. It is based on configurations from to as they are all used to build the probability distributions needed to train our approach. In the cases under study such distributions are quite stable over time so that a small set of configurations () was shown to be enough.
To make the above strategy operational, we still need to determine how we can exploit past data to predict the evolution of the loyalty of a node in future configurations (step ) and use this information to compute nodes epidemic risk (point 5). As with all other variables characterizing the system, indeed, also may fluctuate from a pair of configurations to another, as nodes may alter their loyal behavior over time, increasing or decreasing the memory of the system across time. Without any additional knowledge or prior assumption on the dynamics driving the system, we measure from available past data the probabilities of (dis)loyal nodes staying (dis)loyal across consecutive configurations, or conversely, of changing their loyalty status. This property can be quantified in terms of probabilities of transition across loyalty statuses. We thus define as the probability that a node with degree being loyal between configurations and will stay loyal one step after (). It is important to note the explicit dependence on the degree of the node (here defined at time ), which may increase or decrease following neighborhood reshaping (it may also assume the value if the node becomes inactive in configuration ). Analogously, is the probability of remaining disloyal. The other two possible transition probabilities are easily obtained as and .
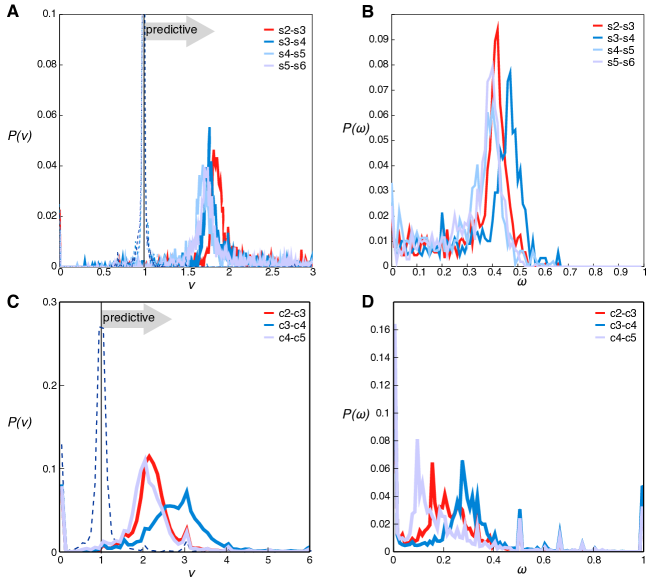
Fig 3C-D show the transition probabilities of maintaining the same loyalty status calculated on the two empirical networks for . Stability in time and non-trivial dependences on the degree of the node are found for both networks. In the cattle trade network, loyal farmers tend to remain loyal with a rather high probability ( for all values). In addition, this probability markedly increases with the degree, reaching for the largest values of . Interestingly, the probability that a disloyal farmer stays disloyal the following year dramatically decreases with the degree, reaching in the limit of large degree. Among the farmers who purchase cattle batches from a large number of different premises, loyal ones have an increased chance to establish business deals with the same partners the following year, whereas previously disloyal ones will more likely turn to being loyal.
A similar qualitative dependence on the degree is also found in the sexual contact network, however in this case the probability of remaining disloyal is always very high () even for high degrees. shows a relatively more pronounced dependence on , ranging from (low degree nodes) to (high degree nodes). Differently from the farmers behavior, sex buyers display a large tendency to keep a high rate of partners turnover across time. Moreover, the largest probability of preserving sexual partners is obtained when the number of partners is rather large.
Remarkably, in both networks, transition probabilities are found to be stable across time and are well described by logarithmic functions (with parameters depending on the system and on ) that can be used to predict the loyalty of nodes in configuration from past data (Fig 3C-D). With this information, it is then possible to compute the epidemic risk of a node in configuration , having degree in configuration and known loyalty status between configurations and as follows:
| (2) |
It is important to note that in our framework the epidemic risk is a node property, and not a global characteristic of a specific disease.
Validation
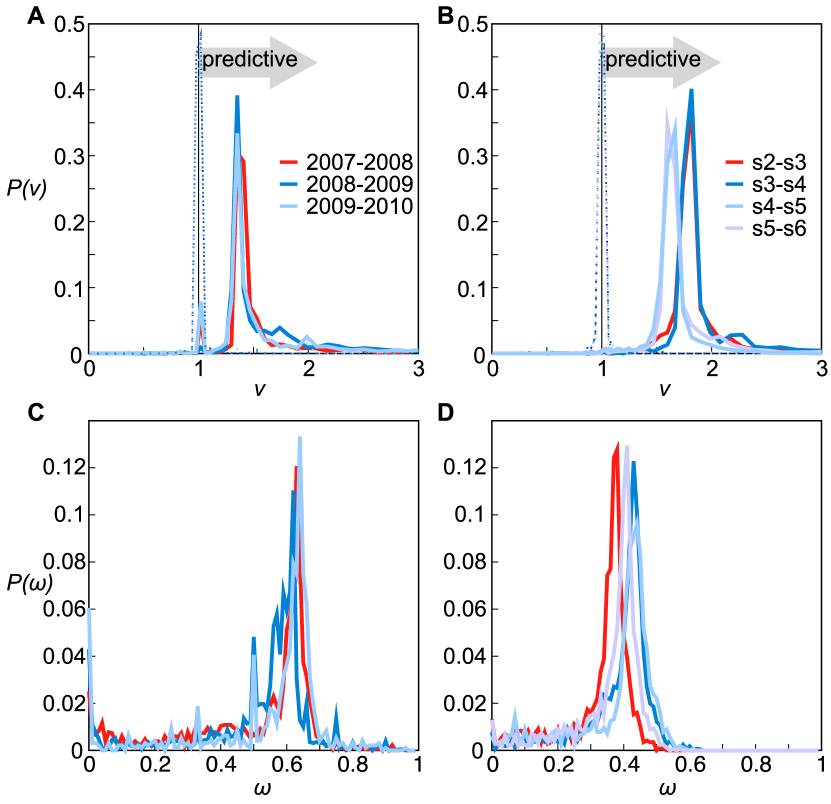
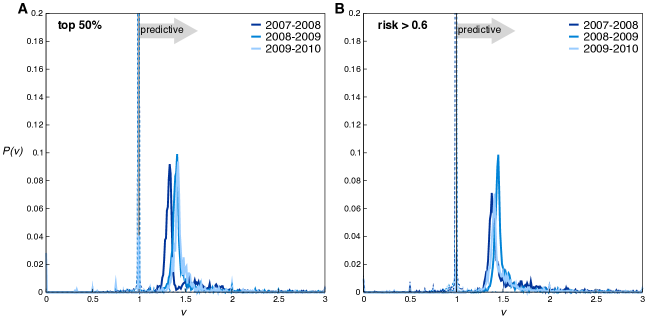
To validate our strategy of risk assessment, we test our predictions based on past data for the risk of being infected in configuration on the results of an epidemic simulation explicitly performed on the supposedly unknown configuration . We consider the set of nodes for which we are able to provide risk predictions and divide it into two subsets, according to their predicted risk of infection . We indicate with the top highest ranking nodes, and with all the remaining others. We then compute the fraction of nodes in the subset , i.e. predicted at high risk, that belong to the set of infected nodes in the simulated epidemic aimed at validation. Analogously, measures the fraction of nodes in that are reached by the infection in the simulation on . In other words, () represents the probability for a node having a high (low) risk of infection to indeed get infected. The accuracy of the risk assessment analysis can thus be measured in terms of the relative risk ratio , where values indicate negative or no correlation between our risk predictions and the observed infections, whereas values indicate that the prediction is informative. For both networks we find a significant correlation, signaled by the distributions of the relative risk ratio peaking around values (Fig 4A-B). The peak positions ( and for cattle and sex, respectively) are remarkably close to the benchmark values represented by the distributions computed on the training sets (red lines in Fig 4A-B). In addition, the comparison with the distributions from a null model obtained by reshuffling the infection statuses of nodes (dotted curves peaking around in Fig 4A-B) further confirms the accuracy of the approach. Findings are robust against changes of the value used to define or against alternative definitions of this quantity (see Supplementary Material).
One other important aspect to characterize is the predictive power of our risk assessment analysis. Our predictions indeed are limited to the set of nodes that are reached in the simulation performed on past data, proxy for the future outbreak. If a node is not infected by the simulation unfolding on configuration or it is not active at that given time, our strategy is unable to provide a risk assessment for that node in the future. We can then quantify the predictive power as the fraction of infected nodes for which we could provide the epidemic risk, i.e. . High values of indicate that few infections are missed by the risk assessment analysis. Fig 4C-D display the distributions obtained for the two case studies, showing that a higher predictive power is obtained in the cattle trade network (peak at ) with respect to the sexual contact network (peak at . Our methodology can potentially be applied to a wide range of networks, other than the ones presented here, as shown with the example of human face-to-face proximity networks relevant for the spread of respiratory diseases reported in Supplementary Material.
We also tested whether our risk measure represents a significant improvement in prediction accuracy with respect to simpler and more immediate centrality measures (namely, the degree). Through a multivariate logistic regression, in Supplementary Material we show that our definition of node risk is predictor of infection even after adjusting for node degree.
Memory driven dynamical model
The results of the risk assessment analysis obtained from the application of our strategy to the two empirical networks show qualitatively similar results, indicating that the approach is general enough to provide valuable information on the risk of infection in different settings. The observed differences in the predictive power of the approach are expected to be induced by the different temporal behavior of the two systems, resulting in a different amount of memory in preserving links (Fig 1) and different loyalty of nodes and their time-variations (Fig 2 and 3C-D).
In order to systematically explore the role of these temporal features on the accuracy and predictive power of our approach, we introduce a generic model for the generation of synthetic temporal networks. The model is based on a set of parameters that can be tuned to reproduce the empirically observed features of the two networks, i.e.: (i) the topological heterogeneity of each configuration of the network described by a stable probability distribution (Fig 1A-B); (ii) a vital dynamics to allow for the appearance and disappearance of nodes; (iii) a tunable amount of memory characterizing the time evolution of the network contacts (Fig 1C-D). These specific properties differentiate our approach from the previously introduced models that display instantaneous homogeneous properties for network configurations [56, 57, 58, 59], reproduce bursty inter-event time distributions but without the explicit introduction of memory [33, 60, 61] or of its control [58].
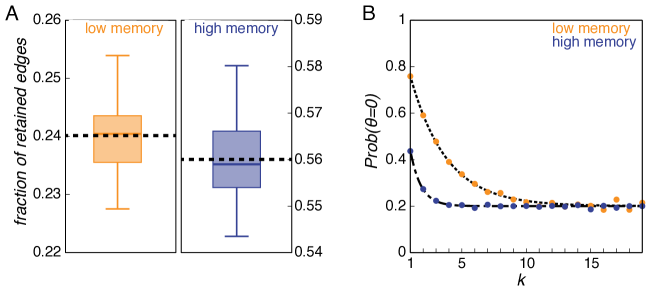
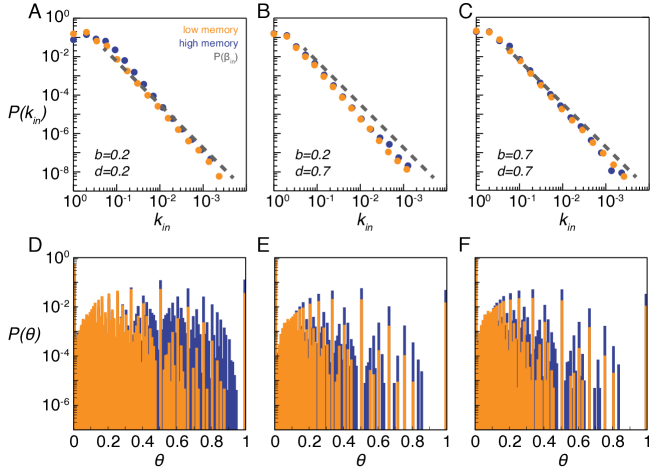
Based on an iterative network generation approach (see Materials and Methods), we can build an arbitrarily large number of configurations of networks with nodes. They are characterized by stable in-degree and out-degree heterogeneous distribution across time (Fig 5A where high memory and low memory regimes are displayed) and by profiles for the probability distribution of the loyalty as in the empirical networks (Fig 5B). The number of nodes with zero loyalty can be computed analytically (see Materials and Methods) and it is confirmed by numerical findings (see Supplementary Material). A high memory regime corresponds to having nodes in the system that display a highly loyal behavior (e.g., ), whereas values in the range are almost absent in a low memory regime, in agreement with the findings of Fig 2.
Applying the introduced risk assessment analysis to the synthetically generated temporal network, we recover a significant accuracy for both memory regimes (Fig 5C). Different degrees of memory are however responsible for the fraction of the system for which a risk assessment can be made. In networks characterized by higher memory, the distribution of the predictive power has a well defined peak, whereas for lower memory it is roughly uniform in the range (Fig 5D). Such a regime implies that not enough structure is maintained in the system to control more than of the future infections. Our risk assessment analysis allows therefore accurate predictions across varying memory regimes characterizing the temporal networks, but the degree of memory impacts the amount of predictions that can be made. The model also shows that the analysis is not affected by the choice of the aggregating time window used to define the network configurations [61, 62, 63], as long as the heterogeneous topological features at the system level and the heterogeneous memory at the node level are kept across aggregation, as observed for the empirical networks under study (see [19] and Supplementary Material).
Conclusions
We introduce a simple measure to characterize the amount of memory in the time evolution of a networked system. The measure is local and it is empirically motivated from two case studies relevant for disease transmission. By focusing on the degree of loyalty that each node has in establishing connections with the same partners as time evolves, we are able to connect an egocentric view of the system (the node’s strategy in establishing its neighborhood over time) to the system’s larger-scale properties characterizing the early propagation of an emerging epidemic.
We uncover a non-trivial correlation between the loyalty of a node and its risk of being infected if an epidemic occurs, given fixed epidemiological conditions, and use this to inform a risk assessment analysis applicable to different settings with no information on the network evolution dynamics. A theoretical model generating synthetic time-varying networks allows us to frame the analysis in a more general perspective and disentangle the role of different features. The accuracy of the proposed risk assessment analysis is stable across variations of the temporal correlations of the system, whereas its predictive power depends on the degree of memory kept in the time evolution. The introduced strategy can be used to inform preventive actions in preparation to an epidemic and for targeted control responses during an outbreak emergency, only relying on past network data.
Methods
Datasets
The cattle trade network is obtained from the database of the Italian national bovine registry recording all cattle displacements due to trade transactions. We consider animal movements during a 5 years time period, from 2006 to 2010, involving 215,264 premises and 2,973,710 directed links. Nodes may be active or inactive depending whether farms sell/buy cattle in a given timeframe. From the dataset we have removed slaughterhouses ( of the nodes) as they are not relevant for transmission.
The sexual contact network is extracted from an online Brazilian forum where male sex buyers rate and comment on their sexual encounters with female sex sellers [16]. Time-stamped posts are used as proxies for sexual intercourse and multiple entries are considered separately, following previous works [16, 31]. A total of 13,855 individuals establishing 34,509 distinct sexual contacts are considered in the study, after discarding the initial transient of the community growth [16]. Nodes may be active or inactive depending whether individuals use or not the service, and join or quit the community. Six-months aggregating snapshots are chosen. A different aggregating time window of three months has been tested, obtaining similar results (see Supplementary Material).
Risk of infection
The distributions of the risk potentials and reported in Fig 3 are modeled with a sum of Landau distribution and an exponential suppression. This family of functions depending on four parameters (see Supplementary Material for the specific functional form) was chosen as it well reproduces the distribution profiles of the risk potentials, and it was used to compute the nodes’ epidemic risk. A goodness of fit was not performed, as this choice was automatically validated in the validation analysis performed on the whole prediction approach.
Memory driven model
The basic iterative network generation approach allows to build configuration from configuration through the following steps:
-
•
vital dynamics: nodes that are inactive in configuration become active in with probability , while active nodes become inactive with probability ;
-
•
memory: active nodes maintain same in-neighbors each with probability ; then they form new in-stubs, where is extracted from a power-law distribution: ;
-
•
out-degree heterogeneity: each node is assigned out-stubs, where is drawn from another power-law distribution: . Then each of the in-stubs is randomly matched to an out-stub.
The total set of nodes is considered to be fixed in time, and nodes may be active (i.e. establishing connections) or inactive (i.e. isolated) in a given configuration. All five parameters are assumed constant in time and throughout the network. The amount of memory in the system is tuned by the interplay of the two parameters and . Starting from an arbitrarily chosen initial configuration , simulations show that the system rapidly evolves towards a dynamical equilibrium, and successive configurations can be obtained after discarding an initial transient of time. The parameters values used in the paper are: . The influence of such parameters on the network properties is examined in Supplementary Material.
If we denote with the number of neighbors that a given node keeps across two consecutive configurations , we can express the loyalty simply as:
| (3) |
where the superscript for indicate the values used to build configuration . The number of nodes with as a function of the degree can be computed analytically: . Similarly, it is possible to compute the probability that a link present in configuration is also present in configuration . In the Supplementary Material we show that and confirm this result by numerical simulations.
References
- 1. Pastor-Satorras R, Vespignani A (2001) Epidemic spreading in scale-free networks. Phys Rev Lett 86:3200-3203.
- 2. Lloyd A, May R (2001) Epidemiology: how viruses spread among computers and people. Science 292:1316-1317.
- 3. Newman MEJ (2002) Spread of epidemic disease on networks. Phys Rev E 66, 016128.
- 4. Cohen R, Havlin S, ben-Avraham D (2003) Efficient immunization strategies for computer networks and populations. Phys Rev Lett 91:247901.
- 5. Keeling MJ, Eames KTD (2005) Networks and epidemic models. J R Soc Interface 2: 295-307.
- 6. Riley S (2007) Large-scale spatial-transmission models of infectious disease. Science 316: 1298-1301.
- 7. Colizza V, Barrat A, Barthélémy M, Vespignani A (2006) The role of the airline transportation network in the prediction and predictability of global epidemics. Proc Natl Acad Sci USA 103:2015-2020.
- 8. Brockmann D, Helbing D (2013) The Hidden Geometry of Complex, Network-Driven Contagion Phenomena. Science 342, 1337.
- 9. Riley S et al (2003) Transmission Dynamics of the Etiological Agent of SARS in Hong Kong: Impact of Public Health Interventions. Science 300: 1961-1966.
- 10. Eckmann JP, Moses E, Sergi D (2004) Entropy of dialogues creates coherent structures in e-mail traffic. Proc Natl Acad Sci USA 101:14333-14337.
- 11. Onnela JP, Saramäki J, Hyvönen J, Szabó G, Lazer D, et al. (2007) Structure and tie strengths in mobile communication networks. Proc Natl Acad Sci USA 104(18):7332-7336.
- 12. Rybski D, Buldyrev SV, Havlin S, Liljeros F, Makse HA (2009) Scaling laws of human interaction activity. Proc Natl Acad Sci USA 106(31):12640-12645.
- 13. Gautreau A, Barrat A, Barthélémy M (2009) Microdynamics in stationary complex networks. Proc Natl Acad Sci (USA) 106:8847-8852.
- 14. Vernon MC, Keeling MJ (2009) Representing the UK’s cattle herd as static and dynamic networks. Proc R Soc B 276:469-476
- 15. Cattuto C, Van den Broek W, Barrat A, Colizza V, Pinton JF, et al. (2010) Dynamics of Person-to-Person Interactions from Distributed RFID Sensor Networks. PLOS ONE 5(7):e11596.
- 16. Rocha LEC, Liljeros F, and Holme P (2010) Information dynamics shape the sexual networks of Internet-mediated prostitution. Proc Natl Acad Sci USA 107:5706–5711.
- 17. Salathé M, Kazandjieva M, Lee JW, Levis P, Feldman MW, et al. (2010) A high-resolution human contact network for infectious disease transmission. Proc Natl Acad Sci USA 107:22020–22025.
- 18. Tang J, Scellato S, Musolesi M, Mascolo C, Latora V (2010) Small-world behavior in time-varying graphs. Phys Rev E 81:055101.
- 19. Bajardi P, Barrat A, Natale F, Savini L, Colizza V (2011) Dynamical patterns of cattle trade movements. PLOS ONE, 6(5):e19869 doi: 10.1371/journal.pone.0019869
- 20. Miritello G, Moro E, Lara R (2011) Dynamical strength of social ties in information spreading. Phys Rev E 83:045102.
- 21. Karsai M, Kaski K, Barabási AL, Kertész J (2012) Universal features of correlated bursty behaviour. Sci Rep 2,397.
- 22. Holme P, Saramaki J (2012) Temporal networks. Phys Rep 519:97.
- 23. Albert R, Jeong H, Barabási AL (2000) Error and attack tolerance of complex networks. Nature 406:378-482.
- 24. Cohen R, Erez K, ben-Avraham D, Havlin S (2001) Breakdown of the Internet under intentional attack. Phys Rev Lett 86:3682-3685.
- 25. Freeman LC (1979) Centrality in social networks: Conceptual clarification. Social Networks 1:215–239.
- 26. Friedkin NE (1991) Theoretical foundations for centrality measures. Am J Sociology 96:1478–1504.
- 27. Holme P (2004) Efficient local strategies for vaccination and network attack. Europhys Lett 68:908–914.
- 28. Kitsak M, Gallos LK, Havlin S, Liljeros F, Muchnik L, et al. (2010) Identification of influential spreaders in complex networks. Nature Phys 6:888–893.
- 29. Salathé M, Jones JH (2010) Dynamics and control of diseases in networks with community structure. PLOS Comput Biol 6:e1000736.
- 30. Natale F, Savini L, Giovannini A, Calistri P, Candeloro L, et al. (2011) Evaluation of risk and vulnerability using a Disease Flow Centrality measure in dynamic cattle trade networks. Prev Vet Med 98(2-3):111-8.
- 31. Rocha LEC, Liljeros F, Holme P (2011) Simulated Epidemics in an Empirical Spatiotemporal Network of 50,185 Sexual Contacts. PLOS Computational Biology 7(3) (2011).
- 32. Galvani AP, May RM (2005) Dimensions of superpsreading. Nature 438, 293-294.
- 33. Lee S, Rocha LEC, Liljeros F, Holme P (2012) Exploiting temporal networks structures of human interaction to effectively immunize populations. PLOS ONE 7(5):e36439.
- 34. Starnini M, Machens A, Cattuto C, Barrat A, Pastor-Satorras R (2013) Immunization strategies for epidemic processes in time-varying contact networks. J Theor Biol 337: 89-100.
- 35. Bajardi P, Barrat A, Savini L, Colizza V (2012) Optimizing surveillance for livestock disease spreading through animal movements. J Roy Soc Int (June, 2012).
- 36. Natale F, Giovannini A, Savini L, Palma D, Possenti L, et al. (2009) Network analysis of Italian cattle trade patterns and evaluation of risks for potential disease spread. Prev Vet Med 92:341–350.
- 37. Robinson SE, Everett MG, Christley RM (2007) Recent network evolution increases the potential for large epidemics in the British cattle population. J Roy Soc Int 4: 669-674
- 38. Kao RR, Danon L, Green DM, Kiss IZ (2006) Demographic structure and pathogen dynamics on the network of livestock movements in Great Britain. Proc Roy Soc Lond B Biol Sci 273: 1999-2007
- 39. Sharp B, Sharp A (1997) Loyalty Programs and Their on Repeat-Purchase Loyalty Patterns. International Journal of Research in Marketing 14(5):473-86.
- 40. Podolny JM (1994) Market uncertainty and the social character of economic exchange. Administrative Science Quarterly 39:458-483.
- 41. Sorenson O, Waguespack DM (2006) Structure and Exchange: Self-Confirming Dynamics in Hollywood. Administrative Science Quarterly 51:560-589.
- 42. Miritello G, Lara R, Cebrian M, Moro E (2013) Limited communication capacity unveils strategies for human interaction. Sci Rep 3, 1950.
- 43. Morris M, Kretzschmar M (1997) Concurrent partnerships and the spread of HIV. AIDS 11:641-648.
- 44. Anderson RM, May RM, Boily MC, Garnett GP, Rowley JT (1991) The spread of HIV-1 in Africa: sexual contact patterns and the predicted demographic impact of AIDS. Nature 352:581-589.
- 45. Keeling MJ, Woolhouse MEJ, Shaw DJ, Matthews L, Chase-Topping M, et al. (2001) Dynamics of the 2001 UK Foot and Mouth Epidemic: Stochastic Dispersal in a Heterogeneous Landscape. Science 294:813-817
- 46. Saegerman C, Berkvens D, Mellor PS (2008) Bluetongue Epidemiology in the European Union. Emerging Inf Dis 14:539- 544
- 47. Tinsley M, Lewis FI, Brülisauer F (2012) Network modeling of BVD transmission Veterinary Research 43:11
- 48. Anderson RM, May RM (1992) Infectious Diseases of Humans Dynamics and Control. Oxford University Press, Oxford.
- 49. Keeling MJ (2005) Models of foot-and-mouth disease. Proc Roy Soc B 272:1195-1202.
- 50. Gross T, Dommar D’Lima CJ, Blasius B (2006) Epidemic dynamics on adaptive networks. Phys Rev Lett 96:208701.
- 51. Funk S, Salathé M, Jensen VAA (2010) Modeling the influence of human behavior on the spread of infectious diseases: a review. J R Soc Interface 7:1247–1256.
- 52. Shaw LB, Schwartz IB (2010) Enhanced vaccine control of epidemics in adaptive networks. Phys Rev E 81:046120.
- 53. Meloni S, Perra N, Arenas A, Gomez S, Moreno Y, et al. (2011) Modeling human mobility responses to the large-scale spreading of infectious diseases. Sci Rep 1:62.
- 54. Bajardi P, Poletto C, Ramasco JJ, Tizzoni M, Colizza V, et al. (2011) Human mobility networks, travel restrictions, and the global spread of 2009 H1N1 pandemic. PLOS ONE 6(1), e16591.
- 55. European Parliament and European council (2000) 204: 1-10. Regulation (EC) No. 1760/2000 of 17 July 2000 establishing a system for the identification and registration of bovine animals and regarding labeling of beef and beef products and repealing Council Regulation (EC) No. 820/97 European Council. Off. J. Eur.Communities L . doi: 10.1088/1367-2630/9/6/179.
- 56. Stehlé J, Barrat A, Bianconi G (2010) Dynamical and bursty interactions in social networks. Phys. Rev. E 81:035101.
- 57. Perra N, Gonçalves B, Pastor-Satorras R, Vespignani A (2012) Activity driven modeling of time varying networks. Sci Rep 2:469.
- 58. Starnini M, Baronchelli A, Pastor-Satorras R (2013) Modeling Human Dynamics of Face-to-Face Interaction Networks. Phys Rev Lett 110:168701
- 59. Kársai M, Perra N, Vespignani A (2014) Time varying networks and the weakness of strong ties. Sci Rep 4:4001.
- 60. Rocha LEC, Blondel VD (2013) Bursts of Vertex Activation and Epidemics in Evolving Networks. PLoS Comput Biol 9(3): e1002974.
- 61. Holme P (2013) Epidemiologically optimal static networks from temporal network data. PLOS Comp Bio doi:10.1371/journal.pcbi.1003142.
- 62. Hoffmann T, Porter MA, Lambiotte R (2012) Generalized master equations for non-Poisson dynamics on networks. Phys Rev E 86:046102.
- 63. Ribeiro B, Perra N, Baronchelli A (2013) Quantifying the effect of temporal resolution on time-varying networks. Sci Rep 3:3006.
| Notation | Description |
|---|---|
| index for network configurations | |
| or | loyalty of node between configurations |
| set of in(out)-neighbors of in config | |
| , | loyalty classes (loyal,disloyal) |
| loyalty threshold | |
| epidemic seed | |
| duration of the outbreak early stage | |
| set of infected nodes for outbreak starting from in config | |
| infection potentials for class () computed for seed between configs | |
| degree (in-degree for the cattle trade network) | |
| , , , | transition probability from one loyalty class to another |
| epidemic risk for node in config | |
| set of infected nodes with high(low) epidemic risk | |
| probability of a high(low) risk node to be infected | |
| risk ratio between , measure of accuracy | |
| predictive power (fraction of infected nodes for which it is possible to compute the epidemic risk) | |
| node probability of becoming active or inactive | |
| node probability of keeping an in-neighbor | |
| number of kept in-neighbors | |
| number of new in-neighbors | |
| number of new out-neighbors | |
| exponents of the distributions of |
Predicting epidemic risk
from past temporal contact data
Supplementary Material
Eugenio Valdanoa,b, Chiara Polettoa,b, Armando Giovanninic, Diana Palmac, Lara Savinic, and Vittoria Colizzaa,b,d
aINSERM, UMR-S 1136, Institut Pierre Louis d’Epidémiologie et de Santé Publique, F-75013
27 rue Chaligny, 75571 Paris, France.
bSorbonne Universités, UPMC Univ Paris 06, UMR-S 1136, Institut Pierre Louis d’Epidémiologie et de Santé Publique, F-75013
27 rue Chaligny, 75571 Paris, France.
cIstituto Zooprofilattico Sperimentale Abruzzo-Molise G. Caporale
Campo Boario, 64100 Teramo, Italy.
dISI Foundation
Via Alassio 11/c, 10126 Torino, Italy.
Appendix A Seasonal pattern in cattle trade network
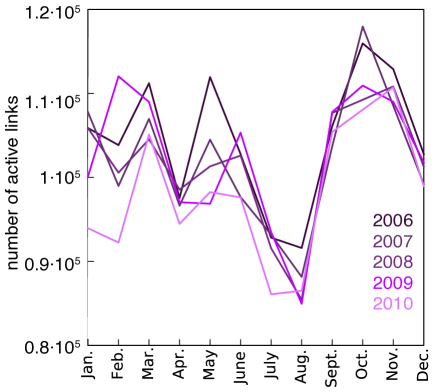
Fig. S1 shows the number of active links per month in the cattle trade network. A seasonal pattern is clearly visible: the activity drops during summer months, and peaks during fall. The activity pattern is quite similar from one year to the other.
Appendix B Loyalty’s properties
B.1 Allowed values
In the following we provide an analytical reasoning on the allowed values for the loyalty. between configurations and can be rewritten as
| (4) |
where is the number of neighbors retained from to , and is the sum of the node’s degrees. Clearly, every pair of for which such that and , will give the same . Therefore, in order to compute all the possible values of , we must restrict ourselves to coprimes: . Moreover, since cannot be higher than , we have to impose one further constraint: . All divisions are to be intended as integer divisions.
For zero loyalty, we have , for every positive . If , we need to count the number of possible values , given the constraints discussed above, and given a value for which is fixed by the node’s degrees. For , there are coprimes of and smaller than or equal to , as it can be inferred by basic properties of the Euler’s totient function .
| (5) |
where counts the number of nonzero allowed values for , given a fixed . In order to compute the total number of allowed values in an entire network, we now let run from 1 to a certain , which is of the order of twice the highest degree:
| (6) |
The unity added to the sum takes into account the value . In order to better understand the behavior of we can use Walfisz approximation for large , and assume to get
| (7) |
This means that the sexual contact network has allowed values, and the cattle trade network has allowed values. Such large number of allowed values in the interval justifies our approximation of treating as a continuous variable.
B.2 Temporal stability of the loyalty distribution in cattle and sexual contact networks
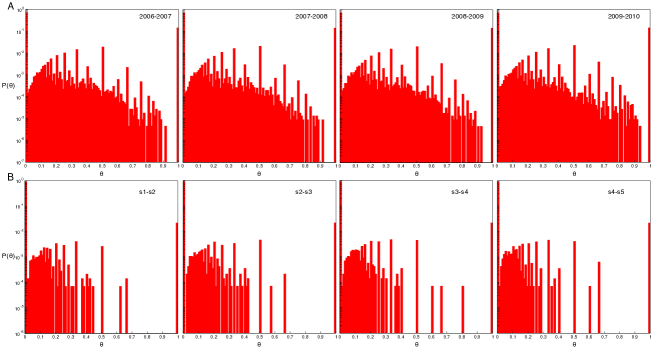
Fig. S2 shows the loyalty distributions in all configuration pairs included in the two datasets under study (top, cattle trade network; bottom, sexual contact network). In both networks, distributions are stable in time.
B.3 Correlation between loyalty and degree
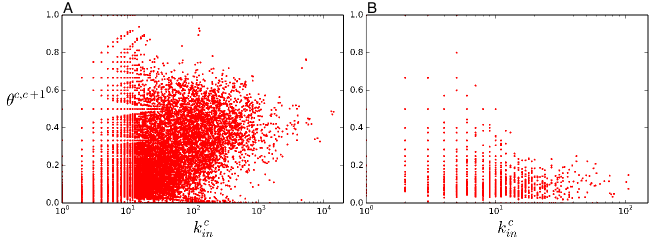
Degree and loyalty, while not being independent variables, are nonetheless not trivially correlated. Fig. S3 shows the scatter plots between the degree of a node in configuration and its loyalty for the pair of configurations , for both networks. For each value of , is found to range over a wide interval. This is clearly visible up to for the cattle trade network, and for the sexual contact network. Higher degree nodes are much less frequent, so the statistics becomes poorer and the heterogeneity in decreases as increases. Pearson correlation coefficients are found to be low for both networks ( for the cattle trade network and for the sexual contact network), consistently with the observed large variations. They are however significantly larger than the coefficients of the null model: 95% confidence interval of and , for the cattle trade network and the sexual contact network, respectively. This points to a positive, albeit weak, correlation between degree and loyalty. The confidence intervals for the null model are obtained by randomly shuffling several times the sequence of ’s, in order to highlight any spurious correlation with the degree sequence.
Appendix C Loyalty and other similarity measures
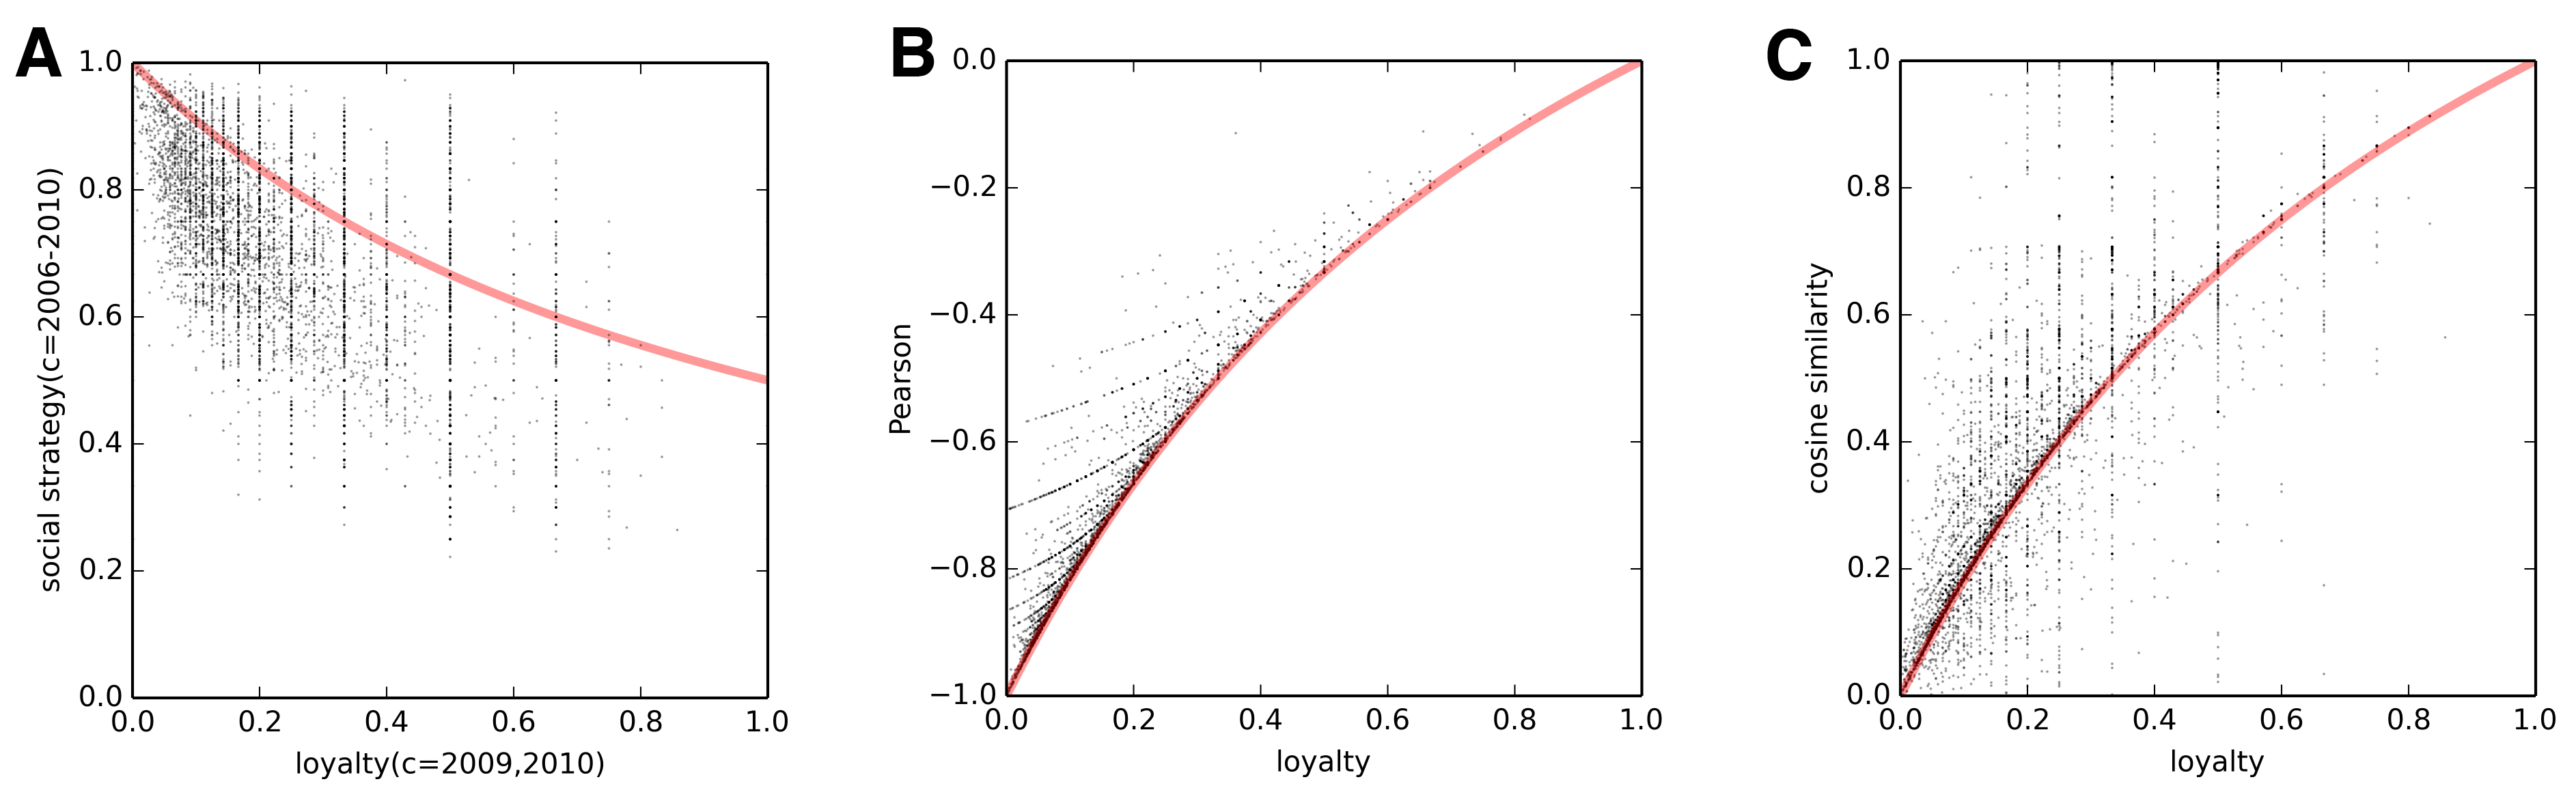
We analyze here the relationship between loyalty and other possible measures of similarity of the neighbor structure of a node across time. Firstly we consider a measure introduced as social strategy in [SM-1]. In our context, if we call the (in-)degree of node in the network resulting from the aggregation of snapshots to , then social strategy in those configurations will be computed as . is as usual the (in-)degree of in configuration . This definition is the same as in [42], except for a normalizing factor . We make this choice in order to make the comparison with more straightforward. The most important qualitative difference between loyalty and social strategy is that the former is always computed between a pair consecutive snapshots, while the latter typically describes an average behavior computed on several configurations (from to in our notation). Indeed only in the trivial case of computed on just two snapshots, loyalty and strategy are univocally related: . In general, will be a non trivial combination of all the consecutive loyalties and degrees. Fig. S4A shows the correlation between social strategy in cattle network, computed from to , and loyalty between .
We now consider a measure of neighbor similarity derived from Pearson correlation coefficient. This measure is analogous to what is called adjacency correlation in [SM-2]. For each node we build two vectors, , of dimension , i.e. these vectors will contain an entry for each vector that is neighbor of in at least one of the two configurations. has entries equal to for nodes that are in , and zero otherwise, and the same for . We than consider the Pearson correlation coefficient between the two vectors, . This can be directly related to the loyalty and the degrees of the node in the two configuration and through the formula
| (8) |
In the above equation we have omitted the subscript : , and . Fig. S4B shows the scatter plot versus . We see that, due to the definition of vectors , . This formula can be simplified if we need just an average behavior: assuming , where is the average connectivity, the formula reduces to . From this we get that (no memory) corresponds to , while (perfect memory) corresponds to .
Finally, we analyze an application of cosine similarity. For each node vectors are built as before. Then cosine similarity between those vectors is defined as . It can be shown that, like , can be written in terms of degree and loyalty:
| (9) |
The average behavior this time is (see scatter plot in Fig. S4C).
In conclusion, social strategy, being computed on a sequence of more than two configurations, represents a qualitatively different measure with respect to loyalty, albeit the two measures being correlated (see Fig. S4A). On the other hand, both Pearson and cosine similarity can be completely determined in terms of degree and loyalty. Moreover, the mean trend is well modeled by the averaged version of these measure, which discounts degree (see Fig. S4).
Appendix D Modeling infection potentials
Infection potentials and are modeled with a sum of an exponential distribution, to account for the behavior at , and a Landau distribution, to mimic the particular asymmetry around the peak. The exact formulation is the following:
| (10) |
There are four free parameters: one for the exponential distribution, two for the Landau distribution, and one driving the relative importance of one function with respect to the other. An overall scaling coefficient is fixed by normalization.
Appendix E Robustness of the risk assessment procedure in varying parameters and assumptions
E.1 Threshold
In the following we examine the behavior of the infection potentials and in varying the value of the threshold. Fig. S5 shows that in the cattle trade network the peak position of increases with , from 0.3 to 0.6. Such behavior is present in the sexual contact network too, albeit less evident (from 0.3 to 0.5). Unlike , distributions remain stable as varies. As a result, the probability of a loyal node being infected () does not depend on the choice of . The choice of threshold thus allows to maximize the distance between and distribution while preserving enough statistics for the loyal nodes.
It is important to note that the value of also affects the transition probabilities in their functional dependence on the degree (Figure 3C,D of the main text). For each threshold value, such dependence needs therefore to be assessed through a fitting, to be used for the prediction of the loyalty values in the unknown network configuration.
E.2 Definitions for the risk ratio
In the main paper the risk ratio is computed considering the set of the top highest ranking nodes. Here we explore two different ways of defining this quantity:
-
•
as the set of the top highest ranking nodes (Fig. S6A);
-
•
as the set of nodes with epidemic risk (Fig. S6B).
Results are reported in Fig. S6 showing the invariance of the observed results on this arbitrary choice.
E.3 Definition of the early stage of an epidemic
In the main paper we consider an initial stage of the epidemic up to . This choice being arbitrary, it is informed by the simulated time behavior of the incidence curves (see Fig. S7) and the aim to focus on the initial stage of the epidemic.
We also tested a longer initial stage () for the sexual contacts network, to assess the impact of this variation on the obtained results. We obtain distributions of the infection potential, of the relative risk ratio, and of the predictive power showing sharper peaks, however with unchanged peak positions (Fig. S8 for the sexual contact network). Peaks are expected to be sharper, because with a larger fraction of the network is reached by the outbreak. The fact that peak positions do not change, however, reveals that we are able to provide accurate epidemic risks already at the earlier phase of the epidemic (), when such information is mostly needed.
E.4 Aggregation time window
The choice of yearly aggregation time in the case of the cattle trade network is informed by its annual seasonal dynamics; the six-months aggregating window for the sexual contact network is instead arbitrary. Here we explore other aggregating windows for both networks to explore the impact they may have on the obtained results.
We consider configurations for the sexual contact network consisting of 3-months aggregation. When calculating the risk ratio and the predictive power (Fig. S9B,D), we find distributions similar to the ones reported in the main text, with unchanged peak positions. The distributions however appear to be noisier, especially as far as is concerned, likely induced by the increased sparseness of the network configurations.
We also try a different aggregation time for cattle network: 4-month windows. Risk ratio and predictive power distributions are presented in Fig. S9A,C. We observe that is on average quite low: this is likely due to the fact that aggregation windows shorter than one year fail to take into account the seasonal patterns, thus decreasing system memory.
Appendix F Memory driven model: analytical understandings
F.1 Amount of memory
In the following we analytically quantify the amount of memory in the memory driven model as the probability that a link present in configuration is also present in configuration . This can be expressed as:
| (11) |
where the first term, , is the probability of remaining active and at the same time keeping a particular neighbor. The second term is the probability of not keeping a neighbor but recovering it with one of the new stubs. is the Riemann -function. can indeed be interpreted as the system memory, as it is a good estimator of the fraction of links that survive from one configuration to the following.
F.2 Probability associated to zero loyalty
The probability of a node with in-degree having zero loyalty () can be computed analytically as
| (12) |
In Fig. S10B we check this result against numerical simulations.
Appendix G Memory driven model: additional properties
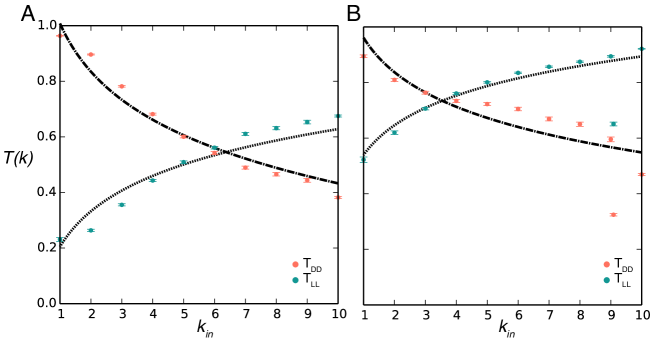
In the main paper the transitions probabilities between loyalty statuses are shown only for the real networks (main paper Fig. 3C and 3D). Here we present them for the memory driven model. Fig. S11 reports these probabilities in case of low and high memory, along with the modeling functions.
In addition, we explore different values of the model parameters and discuss the changes in the network properties. In particular, we explore different values for the probability of becoming active () or inactive (), other than the choice used in main paper (, ). Fig. S12A, S12B, S12C are the equivalent of main paper Fig. 5A, and show the in-degree distribution for different values of in the set . is very robust when changing these parameters, and in all cases follows the slope of the distribution. Fig. S12D, S12E, S12F are the equivalent of main paper Fig. 5B, and show the loyalty distributions. We observe that the overall shape is insensitive to parameters change. There is however, a tendency to have higher values for low . This is to be expected, since higher probabilities of going from active to inactive and vice versa mean larger turnover, which leads to lower memory and therefore lower overall loyalty.
Appendix H Validation in the stochastic case
We repeat the analysis reported in the main text by considering a stochastic Susceptible-Infectious approach. Given the same initial conditions, we perform different stochastic runs, each leading to potentially different outcomes. For each node , we compute the fraction of runs that node is infected from epidemics starting from seed within time step . For validation, we need to compare the list of the node epidemic risks computed with our methodology with the list of the probabilities of actually getting infected. If our estimated risks are reliable, then the two lists need to be correlated, as a higher risk should correspond to a higher probability to get infected. In order to evaluate this, we compute the Pearson correlation coefficients between and , for each possible seed . The list of these coefficients can then be summarized in a distribution. Fig. S13B and S13D show such distributions for the sexual contact network for two different values of the infection transmissibility ( and , respectively). In order to check that the correlation coefficients are significantly different from zero, we compute the same distributions after reshuffling the epidemic risks (dashed lines in plots). Fig. S13A and S13C are the equivalent of Fig. 3B in main paper and show that the peak position of the infection potential does not change from the deterministic case. Noise and peak width, however, increase considerably, as well as the probability of having , and this effect is more pronounced for lower infection transmissibilities.
Appendix I Cattle network: taking into account links weights
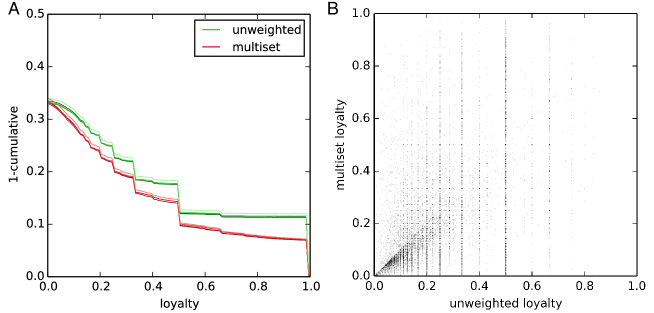
Links in cattle network can be assigned a weight attribute in terms of the number of moved animals. These additional data can be included in the modeling of diseases spread, assuming that larger batches have a greater probability of carrying the disease from the source holding, to the destination. This feature is included in the disease model, by assuming a per-animal transmissibility . Then, given a movement of animals, the transmission probability along that link will be (same approach as in SI of [SM-2012]. Loyalty needs to be generalized to the case of weighted network, too. The most straightforward generalization is obtained by considering the quantities in Eq. (2) of main paper as multisets (see, for instance, [SM-4]), where each neighbor appears as many times as the weight of the corresponding link. Then the weighted loyalty on the weighted network is defined, as before, by Eq. (2) of main paper, using the definitions of multiset union and intersection: and , where is the weight of the link in configuration (assuming if no such link is present). Other choices of similarity between sets of neighbors are possible, however this one is the most natural generalization, since it has a very similar distribution to the unweighted loyalty (Fig. S14A), and correlates well with it (Fig. S14B). We now compute the infection potentials and then the epidemic risks, using this new loyalty. We validate the computed risks analogously to what we did in Sec. H. Results are presented in Fig. S15, showing the generalizability of our approach to the weighted case too.
Appendix J Assessing the robustness of risk based prediction with respect to simple predictors
We have shown that effectively represents the risk of being infected, as shown in the Validation section of main paper. We now show that is a significant improvement in prediction accuracy, with respect to simpler measures, like the degree of a node. From configurations of cattle network we compute the risk of being infected at : , as in Eq. (3) of main paper. For each node for which we can compute we then have the binary variable indicating if node is eventually hit by the epidemic in configuration . We perform a multivariable logistic regression to check that is actually a predictor for , adjusting the in-degree in configuration : . In particular, due to the high heterogeneity of , we adjust for the of the degree. Tab. S2 shows the results of the performed regressions. As the crude odds ratios show, both and , on their own, are meaningful predictor of infection in configuration . We are however interested in assessing wether our risk is still a predictor, once the effect of knowing the degree is discounted for. The odds ratio for adjusted for degree is still significantly greater than one, meaning that even within nodes of the same degree, nodes at high risk are likelier to get infected. In other words, computing the risk (for which the knowledge of the degree of the node is needed) gives more predicting power than the sole knowledge of degree.
| crude OR | adjusted OR | ||
|---|---|---|---|
| log(degree) | |||
| risk |
Appendix K Application to human proximity networks
The main difficulty in applying our methodology to physical proximity networks in human is that generally those networks are much smaller than the ones we have examined, that making it difficult to reach enough statistics to fit the form of infection potentials and transitions probability, and then perform the validation. We show here how we can overcome these impairments and apply successfully our strategy to a network of face-to-face proximity at a scientific conference, collected by the Sociopatterns group [SM-5]. This network records the interactions of nodes during a period of days. We split such networks in configurations (corresponding to hourly time steps), and use the first configurations to train our methodology, in order to give predictions on the . We use this large number of configurations in order to be able to build reliable empirical distributions for the infection potentials and the transition probabilities between loyalty statuses. Once risks are computed as usual, it is not possible, however, to perform the validation as we did for cattle, sexual contacts and memory driven models. This impossibility arises from the fact that the computed risk ratios are too few to build their distribution. In order to validate our methodology we therefore use the same technique implemented in Sec/ J: for every node, we compute the odds ratio of being infected in the last configuration, given the knowledge of degree and the computed risk. Results are reported in Tab. S3. Computer risks are strong predictors for infection, even after adjusting for degree. Moreover, unlike cattle network (see Tab. S2), degree alone is not a predictor. Predictive power is on average high: median , with quartiles .
| crude OR | adjusted OR | ||
|---|---|---|---|
| log(degree) | |||
| risk |
SM References
[SM-1] Miritello G, Lara R, Cebrian M, Moro E (2013) Limited communication capacity unveils strategies for human interaction. Sci Rep 3, 1950.
[SM-2] Clauset A, Eagle N (2012) Persistence and periodicity in a dynamic proximity network, ArXiv:1211.7343.
[SM-3] Bajardi P, Barrat A, Savini L, Colizza V (2012) Optimizing surveillance for livestock disease spreading through animal movements. J Roy Soc Int (June, 2012).
[SM-4] Stanley R P (1997). Enumerative Combinatorics, Vols. 1 and 2., Cambridge University Press.
[SM-5] Isella L, Stehlé J, Barrat A, Cattuto C, Pinton J-F, Van den Broek Wouter (2011) What’s in a crowd? Analysis of face-to-face behavioral networks, Journal of Theoretical Biology 271,1:166-180.