Permission to make digital or hard copies of all or part of this
work for personal or classroom use is granted without fee provided that
copies are not made or distributed for profit or commercial advantage and
that copies bear this notice and the full citation on the first page. To
copy otherwise, or republish, to post on servers or to redistribute to
lists, requires prior specific permission and/or a fee.
\confnameCHI’12, May 5–10, 2012, Austin, Texas, USA.
Copyright 2012 ACM 978-1-4503-1015-4/12/05…$10.00.
Crowds on Wall Street: Extracting Value from Social Investing Platforms
Abstract
For decades, the world of financial advisors has been dominated by large investment banks such as Goldman Sachs. In recent years, user-contributed investment services such as SeekingAlpha and StockTwits have grown to millions of users. In this paper, we seek to understand the quality and impact of content on social investment platforms, by empirically analyzing complete datasets of SeekingAlpha articles (9 years) and StockTwits messages (4 years). We develop sentiment analysis tools and correlate contributed content to the historical performance of relevant stocks. While SeekingAlpha articles and StockTwits messages provide minimal correlation to stock performance in aggregate, a subset of authors contribute more valuable (predictive) content. We show that these authors can be identified via both empirical methods or by user interactions, and investments using their analysis significantly outperform broader markets. Finally, we conduct a user survey that sheds light on users views of SeekingAlpha content and stock manipulation.
1 1. Introduction
Social computing tools have touched and revolutionized nearly all aspects of our daily lives. Initial impact was focused on person-to-person communication, where social networks such as Facebook and Twitter displaced emails and instant messaging. But the impact has spread out far and wide into different aspects of our daily lives, including job hunting (LinkedIn), blogging (Tumblr), photography (Flickr and Instagram), travel discovery and rating (Yelp, TripAdvisor).
One domain that has seen dramatic impact is the area of personal investments, i.e. buying and selling of stocks, bonds and other investments. For decades dating back to the mid-19th century, advice on personal investments has been the exclusive domain of investment banks and advisors such as Goldman Sachs, Lehman Brothers and Salomon Brothers.
Over the last decade, however, the investment landscape has shifted dramatically in favor of more diversified sources of information. Networks like CNBC and Bloomberg established roles as independent sources of financial news, while the financial crisis of 2008 led to the collapse of several of the oldest investment banks (Bear Stearns, Lehman Brothers). Filling in the void were rapidly growing services such as SeekingAlpha and StockTwits, where independent analysts and retail investors could contribute and share analysis for free. SeekingAlpha now reports more than 3 million users and 9 million unique monthly visits. This potentially represents a significant portion of the US investment market, with more than 50 million estimated households that own mutual funds or equities [16].
In this paper, we seek to understand the quality and impact of opinions and analysis shared on social investment platforms. We target the two primary yet quite different social investment platforms, SeekingAlpha and StockTwits, and analyze the potential for investment returns following their recommendations versus the market baseline, the S&P 500 stock market index. We seek to understand how expertise of contributors can affect the quality and utility of contributed content, using SeekingAlpha as an “expert” model (all content is contributed by less than 0.27% of users) and StockTwits as a “peer” model (any user can contribute). Our work makes four key contributions.
First, we gather longitudinal datasets from both platforms since their inception (9 years of data for SeekingAlpha, 4 years for StockTwits). We develop sentiment analyzers on each dataset, using a mixture of keyword processing and machine learning classifiers. Validation shows our methods achieve high accuracy in extracting sentiments towards individual stocks (85.5% for SeekingAlpha, 76.2% for StockTwits).
Second, we analyze correlation between content sentiment from both services with stock returns at different time scales. We show that content from both SeekingAlpha and StockTwits provide minimal forward correlation with stock performance. While the average article provides little value, we find that a subset of “top authors” in SeekingAlpha contribute content that shows significantly higher correlation with future stock performance.
Third, we evaluate the hypothetical performance of simple investment strategies following top authors from both platforms. We show that investment strategies based on stock sentiment from top SeekingAlpha authors perform exceptionally well and significantly outperform broader markets. In contrast, strategies relying on StockTwits generally underperform relative to broader markets. In addition, we show that we can identify top authors without historical stock market data, using only user interactions with their articles as a guide.
Fourth, we conduct a large scale survey of SeekingAlpha users and contributors to understand their usage, reliance, and trust in the SeekingAlpha service. Results show that despite seeing potentially intentionally misleading or manipulative articles, most users still rely heavily on the site content for investment advice. Most consider SeekingAlpha unique, and would not use a competing alternative in its absence.
A recent article in a financial journal also studied SeekingAlpha and showed statistical correlation between its content and earning surprises [8]. In contrast, our work contrasts the performance of expert (SeekingAlpha) versus peer-based (StockTwits) systems, evaluates the performance of realistic and simple trading strategies, and reports user views of SeekingAlpha through detailed surveys.
In summary, the rise of crowd-contributed analysis sites has significantly changed how retail investors manage their investments. Our analysis shows that even on curated sites such as SeekingAlpha, broad sentiment is a poor indicator of market performance. However, a subset of SeekingAlpha authors provide valuable content that can be leveraged to build trading strategies that significantly outperform the broader markets. More importantly, these authors can be identified not only by their statistical performance, but more easily by the feedback their articles generate from other users. This shows that even for a complex and domain-specific such as stock trading, broader input from the crowd can help identify high quality content in a sea of data. Finally, results from our user survey confirm that most SeekingAlpha users have seen and have learned to distinguish biased or manipulative articles from useful articles.
2 2. Background and Methodology
Seeking Alpha. Launched in 2004, SeekingAlpha (SA) is the most popular platform today for independent stock analysis. As of early 2014, SA has more than 8 million unique monthly viewers and 3 million registered users [35]. SA’s content is mainly contributed by roughly 8000 registered contributors [1], and articles are vetted by an editorial board before publication on the site. Users can subscribe to stocks of interest to receive related articles and news summaries, follow contributors to receive their articles, and interact with contributors and other users through comments on articles. SA contributors include independent investors, portfolio managers, professional investors and investment firms. Roughly 400 out of 8000 contributors self-identify as investment firms. SA pays each contributor $10 per 1000 page views on articles.
StockTwits. StockTwits (ST) started in 2009 as a financial social network for sharing ideas among traders. Anyone on StockTwits can contribute content – short messages limited to 140 characters that cover ideas on specific investments, and post their messages to a public stream visible to all. There’s no editorial board or content curation, and users are not compensated for their messages. Like Twitter, ST users follow others to build directional social links; and also follow the stock symbols they are interested in. Unlike SeekingAlpha, StockTwits provides real-time streaming of investor sentiment towards individual stocks. As of the end of 2013, StockTwits has over 300K registered users and its content reaches an audience of 40 million across the Internet [2].
Goals and Methodology. Seeking Alpha and StockTwits represent the largest and most representative sites in expert and peer-based investment analysis. The main goals of this study are to quantify correlation between sentiment in user-contributed investment analysis to real movements in stock equities, how and if such correlations can be leveraged for investment gain, and how users view and utilize platforms such as SeekingAlpha in their investments. Our methodology is as follows:
-
•
First, we gather complete datasets of contributed articles from SeekingAlpha and “twits” from StockTwits (). We then develop sentiment analyzers for both datasets and evaluate their accuracy ().
-
•
Second, we compute statistical correlation between sentiment of contributed content to the performance of stocks they discuss (). We do so for different time scales and both individual stocks and the aggregate market. We also sort authors by their performance to identify authors whose content consistently correlate with stock performance.
-
•
Third, we propose strategies for identifying and trading stocks using sentiments from top authors in both platforms, and evaluate them against baseline market indices (). We explore the efficacy of strategies that identify top authors by historical performance and by interactions with other users.
- •
| Site |
|
|
|
|
|
||||||||||
|---|---|---|---|---|---|---|---|---|---|---|---|---|---|---|---|
| SeekingAlpha | 2004 | 410K | 163K | 228K (8783) | 10.4K | ||||||||||
| StockTwits | 2009 | 12.7M | 8.5M | 86K (86K) | 9.3K |


3 3. Data Collection and Initial Analysis
3.1 3.1 Data Collection
SeekingAlpha. In April 2014, we crawled the complete list of historical articles published on SeekingAlpha since its launch in 2004. This produced 410,290 articles written by 8,783 authors, 2,237 news and conference transcripts111Transcripts cover board meetings and conference calls.. Our analyses focus on articles and do not include news in the form of SA “market currents” or transcripts. Our crawl also produced 4,115,719 total comments, of which 75% were written by 227,641 non-contributing users. The remaining 25% are from authors themselves. We crawl profiles of all authors and active users for their brief bio and number of followers and followees.
Each SeekingAlpha article has an “about” field that lists what stock(s) the article discusses. 163,410 (about 40%) of our articles have at least one stock symbol in their about field. Articles without stock symbols usually discuss overall market trends or sectors of stocks. From our entire dataset of SeekingAlpha articles, we were able to extract 10,400 unique stock symbols.
StockTwits. We are fortunate to receive permission from StockTwits Inc. to access their historical message archive, including all messages posted from 2009 (initial launch) to February 2014. The dataset contains 12,740,423 messages posted by 86,497 users. Each message includes a messageID, author’s userID, author’s number of followers (followees), timestamp, and message text. Each message is limited to 140 characters, and stock symbols are preceded by a “CashTag” ($). In our dataset, about 67% of StockTwits messages have at least one CashTag. From these messages, we extract 9,315 unique stock symbols.
StockTwits messages can also be labeled “bullish” or “bearish” by the author to label their sentiment towards the mentioned stocks. 10% of messages (1.3 million) have this label. We use these labeled messages later as ground-truth to build and evaluate sentiment analysis tools.
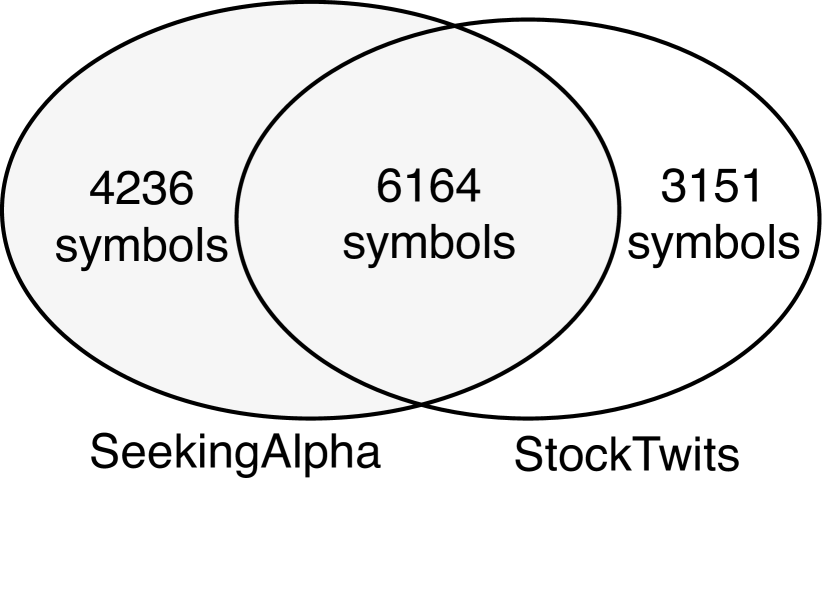
Stock Historical Price Data. Our two datasets include a total of 13,551 unique stock symbols. Symbols from two sites do not completely overlap (Figure 2): 6,164 symbols appear in both datasets, most represent stocks on the NASDAQ and NYSE exchanges. SeekingAlpha-only symbols (4,236) are mostly small stocks sold on Over-The-Counter Bulletin Board (OTCBB), while StockTwits-only symbols (3,151) are mostly from the Toronto Stock Exchange.
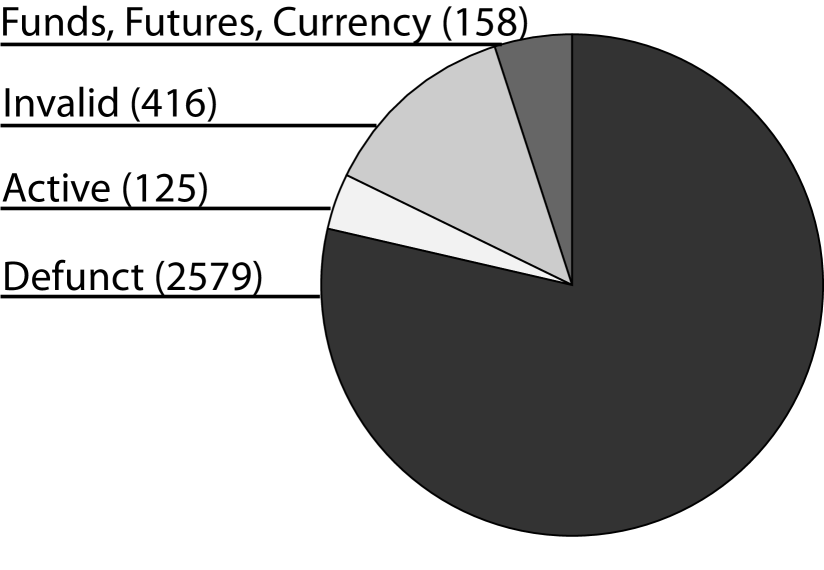
We use the Yahoo! Finance open API [3] to crawl historical prices for all stock symbols. For each stock, we obtain its historical daily opening and closing prices, volume, and intraday price range. Of our 13,551 symbols, we found data for 10273 symbols. We track down the 3278 missing symbols using both Yahoo Finance and Bloomberg (see Figure 2). First, 2579 missing symbols are defunct, i.e. symbols made invalid due to corporate breakups, merge/acquisitions, or bankruptcy. Second, 125 are active stocks, either on foreign exchanges or OTC stocks not covered by Yahoo. Third, 158 symbols are ETF or mutual Funds, Futures contracts, and Currencies. Finally, we manually inspect the remaining 416 symbols, and find they are often user-defined symbols such as $CRASH, or non-listed companies such as $QUORA. Missing symbols account for 7% of SeekingAlpha articles and 6% of StockTwits messages, thus we believe it would not impact our overall conclusion. We summarize our final datasets used in our analysis in Table 1.
3.2 3.2 Preliminary Analysis
Here, we briefly analyze our datasets to understand the structure of user communities and content in these two systems. The two systems are quite different. SeekingAlpha focuses on detailed, blog-like contributions by a small group of “experts” further curated by editors, and the large majority of users consume and comment on articles. In contrast, StockTwits encourages short, terse contributions by all users. We compare and contrast the platforms on growth over time, skew of author contributions, distribution of stocks covered, and the structure of social connections in the community.
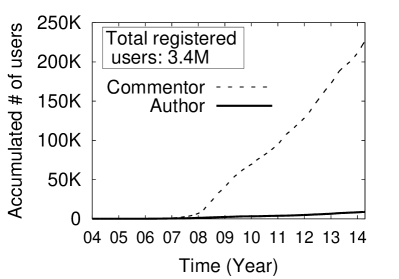
User Growth. Figure 4 plots the growth of users over time for both systems. Recall our SeekingAlpha data includes all users who have contributed or commented on at least 1 article. At both sites, active users are growing at a stable rate, but only make up a small portion of all registered accounts (236,000 active versus 3.4 million accounts in SeekingAlpha, and 86,000 active versus 300K accounts for StockTwits).
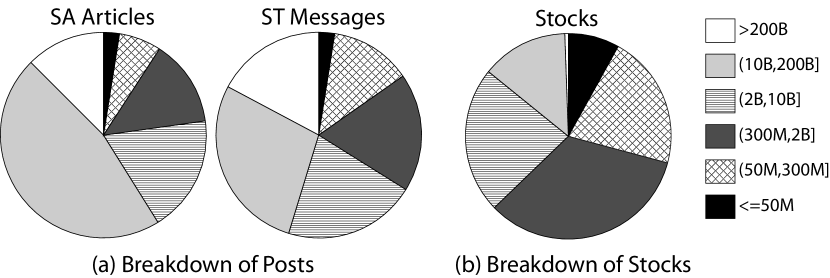
Distribution of content over authors and stocks. Author’s contribution to the platform is measured by the number of articles from the author. For both SeekingAlpha and StockTwits, we find the contribution per authors is highly skewed (Figure 4(a)). On SeekingAlpha, 20% of the most active users contributed 80% of articles, while on StockTwits, 20% of active users contributed 90% of the messages. Even though StockTwits tries to leverage the power of the crowd, it has an even higher skewness in content contribution than SeekingAlpha. This sheds concerns that the wisdom of the crowd is likely to be dominated by the most active authors.
Content posted on both sites is also highly skewed to a small portion of “popular” stocks (Figure 4(b)). More than 70% of SeekingAlpha articles cover top 10% of the most popular stocks. The skew is even stronger in StockTwits, with 90% of messages focusing on 10% most popular stocks.
Figure 5 shows the heavy emphasis of articles on large capitalization companies. 47% of SeekingAlpha articles and 28% of StockTwits messages cover stocks of companies between $10 Billion and $200 Billion in market cap, which account for only 14% of all stocks. The emphasis is stronger for the largest companies (market cap $200 Billion). They account for only 0.3% of all stocks, but are covered by 10-15% of the content on both platforms.
| Graph | Nodes | Edges |
|
|
|
Assort. | ||||||
|---|---|---|---|---|---|---|---|---|---|---|---|---|
| SeekingAlpha | 386K | 3.9M | 19.91 | 0.150 | 3.09 | -0.428 | ||||||
| Facebook [36] | 1.22M | 121M | 199.6 | 0.175 | 5.13 | 0.17 | ||||||
| Orkut [24] | 3.07M | 224M | 145.5 | 0.171 | 4.25 | 0.072 | ||||||
| Flickr [24] | 1.85M | 22.6M | 24.5 | 0.313 | 5.67 | 0.202 |
Social Connections and Graphs. We analyze social connections in SeekingAlpha to understand the structure of the network (similar data was not available for StockTwits). We crawled a full snapshot of the SeekingAlpha network in October 2013, using contributors as seeds and crawling all reachable users. The result graph has 386K nodes and 3.9M edges.
We compute key graph metrics and compare them against those of popular social networks in Table 2. The Facebook graph is from the Australia regional network in the reference paper [36]. First, SeekingAlpha has a similar clustering coefficient to other social networks, indicating that SeekingAlpha has a similar level of local connectivity. Second, SeekingAlpha has a dramatically different (negative) assortativity value compared to other networks. Assortativity measures how strongly users tend to connect to others with similar degree of connectivity. Positive assortativity indicates a preference to link to users with similar degree, while negative assortativity indicates a preference to link to users with different degree. SeekingAlpha’s extremely negative assortativity (-0.428) indicates that SeekingAlpha exhibits a highly bi-partite structure, where most connections are between users following contributors, but with fewer connections amongst accounts of the same type. Finally, the very low average path length in SeekingAlpha is indicative of networks where supernodes produce short connections between users.
4 4. Sentiment Extraction
Our analysis on the value of user-contributed investment analysis hinges on our interpretation of sentiment in SeekingAlpha articles and StockTwits messages. The first step in this process is developing reliable tools to extract sentiment (positive or negative opinion) on stocks from posted articles and messages. We discuss our sentiment analysis techniques here, and rely on them in later sections to compute stock performance correlation and to drive trading strategies.
Our approaches to extract sentiment from SeekingAlpha and StockTwits are quite different. More specifically, SeekingAlpha articles are sufficiently long to apply an approach using a keyword dictionary, while we applied a supervised machine learning approach for the short messages in StockTwits, using messages with “bullish” or “bearish” labels as training data. Our validation results show we achieve an accuracy of 85.5% for SeekingAlpha and 76.2% for StockTwits. We note that these accuracy results are on par or significantly better than existing sentiment analysis techniques [8, 15].
4.1 4.1 Sentiment Analysis: Seeking Alpha
We develop a dictionary based method to extract sentiment from SeekingAlpha articles. At a high level, we measure author sentiment (towards a stock) based on the ratio of positive and negative keywords in the article. We rely on a widely used financial sentiment dictionary [22] to identify positive and negative keywords in the article, and calculate the sentiment score as , where () is the number of positive (negative) words or phrases in sentence . The sentiment score is a decimal value with high positive value indicating strong and positive sentiment, and vice versa. For example, an extremely positive article with 100 positive words and 0 negative words gets a score of 4.6; an extremely negative article with 100 negative words and 0 positive words scores -4.6.
However, there are problems with applying this method naively to SeekingAlpha articles. First, many articles discuss multiple stocks, and sentiments may be quite different for each discussed stock. Generating one sentiment score for all stocks is clearly oversimplifying. Second, simple keyword counting can easily make mistakes. For instance, “low risk” contains negative keyword “risk” but the overall sentiment is positive. Also negation usually changes the sentiment of words, such as “not good,” or “no benefits.”
We make several refinements to our method to address these challenges. First, we partition multi-stock articles and assign individual sentences to each stock symbol222Stock symbols are easily recognized as hyperlinks in each article.. Our method is a simple distance-based slicing: we consider stock symbols (and its company names) as landmarks, and we assign each sentence to the closest landmark in the article. Next, we make two adjustments to basic keyword counts. First, we identify the sentiment of noun phrases such as “higher revenue,” “low return,” “low risk.” We extract frequent noun phrases that occur in more than 1% of articles, and manually label their sentiment. Second, we reverse the sentiment of words or phrases affected by negation words [29].
To validate our method, we sample 300 articles from our article collection and manually label their sentiment as positive or negative. We have three graduate students read each article and vote for the final label. Then we run our sentiment extraction method on these articles to generate sentiment scores. The result shows our method achieves 85.5% accuracy. Note that this accuracy only considers the polarity of the scores, i.e. whether an article is positive or negative.
4.2 4.2 Sentiment Analysis: StockTwits
Roughly 10% of StockTwits messages already have sentiment labels, either “bullish” or “bearish.” Our goal is to extract sentiment for the remaining 90% of messages. We choose to use supervised Machine Learning method, since messages are too short for dictionary-based approaches (we confirmed this with experiments).
To build a machine learning classifier, we follow prior work [28] to use the existence of unigrams as features. To reduce noise in the machine learning model, we exclude infrequent unigrams that occur less than 300 times over all messages, and remove stopwords, stock symbols and company names from messages. We use the ground-truth messages as training data, and empirically test multiple machine learning models, including Naive Bayes, Supported Vector machine (SVM) and Decision Trees. We randomly sample 50K messages labeled as “bearish” and 50K labeled as “bullish,” and run 10-fold cross validation. We find the SVM model produces the highest accuracy (76.2%), and use SVM to build the final classifier used on all messages.
The sentiment score of StockTwits messages is binary: 1 indicates positive sentiment and -1 indicates negative sentiment. For rare messages with multiple symbols, we attribute the same sentiment score to all symbols in the message (messages are too short to slice).
5 5. Predicting Stock Price Changes
Using our sentiment analysis tools, we can now quantify the value of SeekingAlpha and StockTwits content, by measuring statistical correlation between their sentiment towards individual stocks, and each stock’s near-term price performance. Our goal is to study such correlation for different time periods after the content was published, for both platforms and over different historical periods (to account for bull/bear cycles in the stock market).
5.1 5.1 Per-article Sentiment and Stock Performance
We start by studying how well each article predicts the future price trends of the stocks it discusses. We compute the Pearson correlation coefficient [30] between article’s sentiment (positive or negative) and stock’s future price change. For simplicity, we ignore magnitude of price movements and strength of sentiments, and reduce both metrics to binary (positive/negative) values. Pearson correlation coefficient is widely used to measure the linear correlation between two variables333 For two variables and , the Pearson correlation coefficient , where and is the mean and standard deviation of and is the expectation.. Its value ranges from -1 to 1, where 1 means perfect positive correlation, 0 means no correlation, and -1 means perfect negative correlation. In this context, the Pearson coefficient is 1 if a stock always increases in value after it is discussed positively by an article.
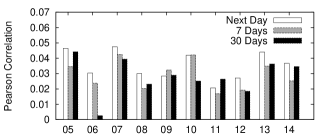
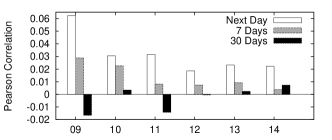
We compute the Pearson coefficient between two variables and . is 1 (-1) if the article’s sentiment is positive (negative); and is 1 or -1 depending on whether the discussed stock goes higher or lower in price. We study stock price changes in different time windows after a relevant article is published, including the next day, the next week and the next month. For articles with multiple stock symbols, we count each stock as one data point. We also group articles in each year and compute the per-year Pearson correlation coefficient to understand the consistency of correlation across different years. Results are shown in Figure 6.
First, we observe that correlation is extremely low across different time windows and different market years for both systems. To better understand the Pearson values, consider that a prediction history of 75% correlation would produce a Pearson coefficient of 0.4. The most significant correlation in our results is 0.05, which translates to a prediction accuracy of 53%, 3% better than a random guess. This means that taken as an aggregate, SeekingAlpha articles and StockTwits messages provide minimal value for investors.
Looking closer, SeekingAlpha generally does a bit better than random, while StockTwits has weaker, sometimes negative correlations. Clearly StockTwits is better as a gauge of instantaneous market sentiment, and a poor predictor of even near-term performance. In contrast, SeekingAlpha is a bit more consistent over different time windows, and still has some value for predicting price movements in the following month. We note that SeekingAlpha accuracy is a bit lower for market years with high volatility (2008–2009, 2011–2012).
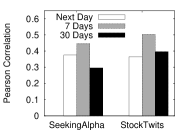
The natural followup question is: is the weak correlation consistent across all authors, or are there authors whose contributions provide consistently good predictors of stock performance but are buried in the noise? Here, we perform a simple test to determine if more accurate authors exist. We rank authors based on how well their articles predict stock returns in a single year, e.g. 2013. For each author, we measure the average hypothetical return per article for all her articles as a percentage after a time window . If is the stock closing price of a given day , and the article is posted on day , then return from a positive article is , and return on a negative article is .
For our simple experiment, we set to one week, and compute the average return per article to rank authors in 2013. We then take a closer look at correlations of 500 stocks discussed by the top ranking authors. Figure 7(a) clearly shows that correlation scores for top authors in SeekingAlpha and StockTwits are both very high (around 0.4), i.e. top authors can predict stock movement within a week with accuracy.
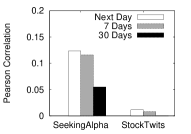
In reality, we cannot identify top authors using data from future months in the same year. We can only rely on past performance to guide us. Thus we repeat the experiment: using 2012 data to rank authors, and then we study the performance of their 2013 stock recommendations. As expected, correlation results for those authors’ stocks in 2013 (see Figure 7(b)) are much lower. Top SeekingAlpha authors show a significant correlation score around 0.12, which is still significantly better than the average. This confirms our intuition, that filtering out the “noise” does indeed reveal more accurate contributors in the crowd. Note that the same does not hold for StockTwits, i.e. no StockTwits authors can consistently predict stock performance over different time periods.
5.2 5.2 Aggregated Sentiment for Market Prediction
Since the correlation between articles and individual stocks is weak, we consider aggregated sentiment of all articles as a possible predictor for the market as a whole. Here we use the S&P 500 index444S&P 500 is a widely-accepted market index based on the market capitalizations of 500 large companies. as a metric for overall market performance. Here, we treat the S&P 500 index as a single stock and trade it based on the aggregated sentiment over time. In practice, this can be done using SPY, an Exchange Traded Fund (ETF) that tracks the S&P 500.
The process is intuitive: we start by holding a position in the S&P 500. After every days, we check the aggregated sentiment of articles posted in the past days, and choose to either buy or sell the S&P 500. Sentiment over a window of days is computed by first computing the average sentiment of all articles for each day, then setting the overall sentiment to positive if there are more net-positive days than net-negative days. If the sentiment for a window is negative, we sell our entire position (if any) in the S&P 500. If the sentiment is positive, we buy back our full position if we have none, or hold it if we already have a position.
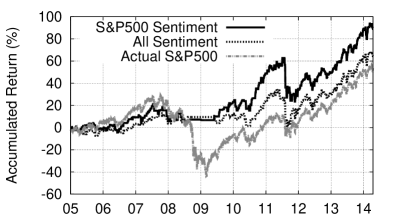
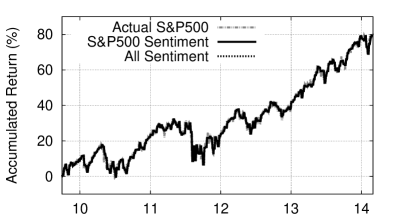
Long-term Performance. We simulate this trading strategy using data from SeekingAlpha (January 2005 to March 2014) and StockTwits (September 2009 to February 2014)555SeekingAlpha only had 3 total articles in 2004. Thus we start our SeekingAlpha simulations from 2005.. We set time window to one week (we evaluate ’s impact later). On each dataset, we run two configurations, one using “all” sentiment from the entire network, and the other only taking sentiment specifically about the 500 stocks listed in S&P 500 index666The stocklist of S&P 500 index changes periodically, and we adapt the list in our evaluation accordingly.. As a baseline, we run a “buy-and-hold” strategy on S&P 500 index, that is, holding the stock for the entire duration of the simulation.
Figure 9 plots the total return (normalized by initial investment) accumulated over time. For SeekingAlpha (Figure 8(a)), we find both configurations outperform the actual S&P 500. Aggregated sentiment can generally predict market trends. Not surprisingly, sentiment specifically about the 500 stocks in the index produces more accurate results. A closer look shows that our strategy significantly outperforms the real market during 2008–2010, when the financial crisis caused the stock market (and the S&P 500) to lose more than half of its value. Given the overall negative sentiment in SeekingAlpha, our strategy held no positions and avoided much of the market losses. For StockTwits (Figure 8(b)), we find that all three lines completely overlap. In fact, after we aggregate the sentiment of the whole network, StockTwits’s overall opinion towards the market is almost always positive. Our sentiment-driven trading is equivalent to buy-and-hold.
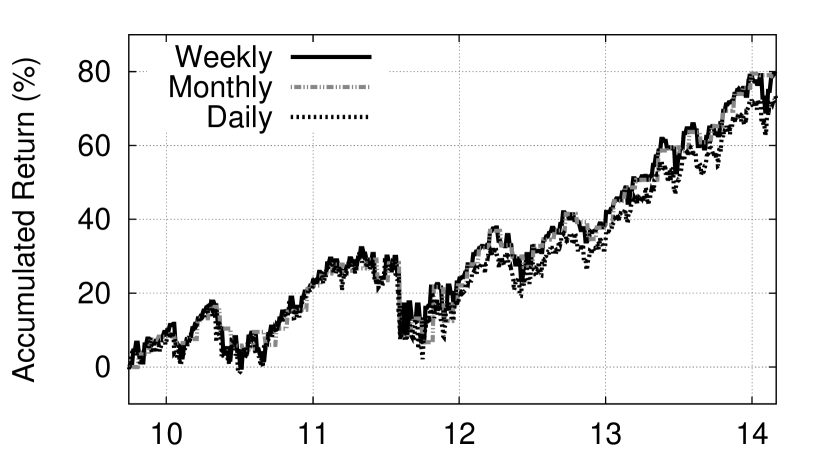
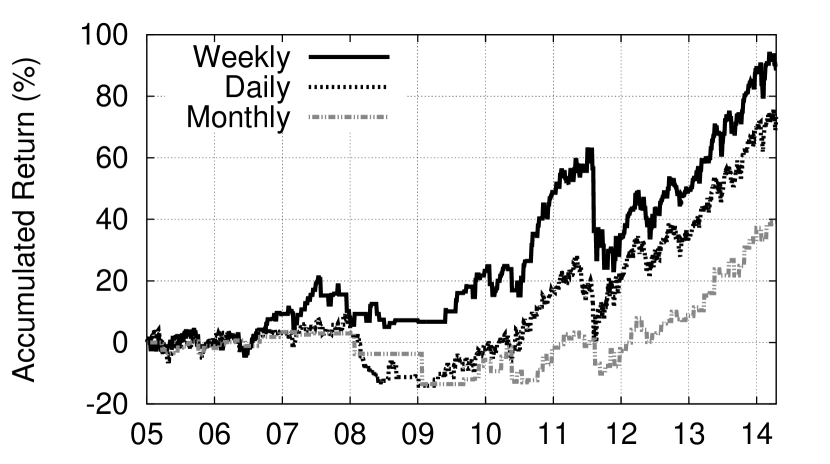
Impact of Time Window . To understand the time frame for aggregating sentiment that optimizes accuracy, we test 1-day, 1-week and 1-month respectively and run the trading method only with sentiment related to the 500 stocks in the index. The results are shown in Figure 9-10. For SeekingAlpha, acting on weekly sentiment is clearly the sweet spot. Acting on daily sentiment over-reacts, while acting on monthly sentiment is too slow to respond to market changes. For StockTwits, different values have minimal impact, but daily outperforms weekly by a narrow margin. We use weekly sentiment aggregation in our later trading strategies.
In summary, our analysis shows that sentiment to performance correlation is quite low for both SeekingAlpha and StockTwits. However, there are authors who consistently provide high-correlation analysis in their articles. The challenge is to identify them efficiently. In the next section, we address this challenge and develop practical sentiment-driven strategies for stock trading that can significantly outperform the market.
6 6. Practical Sentiment-based Trading
Thus far, we have determined that while correlation to stock performance is low over all articles as a whole, certain subsets of the user population contribute content with much stronger correlation to stock performance. Two key questions remain. First, can these “valuable” authors be identified easily? Second, once identified, can their content be analyzed to form the basis of real stock trading strategies, and how would such strategies perform?
We address these questions in three parts. First, we explore several possible ranking heuristics for identifying the valuable authors (and their analysis contributions) from both SeekingAlpha and StockTwits. Second, we consider possible stock trading strategies based on sentiment analysis of these contributions. Finally, we use historical stock data to drive simulations of these trading strategies, and use empirical results to draw conclusions about the value of these top authors, and the efficacy of our mechanisms to identify them.
6.1 6.1 Ranking Authors
To identify the (possibly small) subset of top authors in our systems, we explore two different sets of heuristics. First, we consider using empirical past performance, i.e. correlation between sentiment and stock performance, as a gauge to rank authors. While this is likely the most direct way to rank authors by performance, its computation requires access to significant resources, including past stock data and sentiment analysis tools. Second, we consider a simpler alternative based on user interactions (comments). The intuition is that user feedback and engagement with content provides a good indicator of valuable content.
Ranking Authors by Prediction Accuracy. Our first ranking heuristic is purely empirical: we rank authors based on how well their previous articles predict stock returns. For a given author and historical time period (e.g. a year), we compute average hypothetical return of her articles posted during that given period. Recall that we used this in Section 5 as a metric of an author’s prediction ability. A variant of this ranking metric is an author’s average hypothetical return per stock. Compared to the per article metric, this highlights authors who have consistently good performance over a range of stocks over those who write numerous articles on a small set of stocks. We consider both metrics in our experiments.
Ranking Authors by Received Comments. The challenge with empirical performance-based metrics is that it requires significant resources in historical data and computation. Here, we also consider the value of a simpler approximation based on reader engagement. The intuition is that the audience in these systems is a valuable asset, and we can observe reader responses to contributed content and indirectly infer the value of the content. More specifically, we use two heuristics that rank authors based on either total number of comments or comments per-article. Without semantic analysis of comments, we use the number of comments as an approximate indicator of user agreement.
6.2 6.2 Sentiment-based Stock Trading Strategies
Given a ranking of top authors, the next step is to formulate a stock trading strategy that takes advantage of (hopefully) valuable and predictive sentiment on individual stocks. Our strategies build up on these articles by selecting stocks mentioned by top authors in their (recent) articles. For simplicity, we build a portfolio for our simulations from the 500 stocks mentioned by the top-ranked authors. Experiments with smaller portfolios show highly consistent results, and are omitted for brevity.
In terms of trading strategies, we implement two simple strategies: a basic “long” strategy (buy or sell based on sentiment) similar to the one used to trade the SPY in Section 5.2, and a more aggressive “long/short” strategy that allows investors to short stocks. For both strategies, we trade stocks on a weekly basis based on earlier results (Figures 9–10).
Long Strategy. Our long strategy builds a portfolio by initially spreading funds evenly to purchase stocks, for our examples. Then we make trading decisions on each stock independently on a weekly basis. For a stock in the portfolio, we sell our entire position in the stock if the aggregated sentiment about this stock in the past week is negative. Otherwise, we hold the stock (or buy it back if we sold it earlier). We use the same sentiment aggregation method as before (§5.2), but only consider the top author’s sentiment on each stock. The return of the portfolio is the sum of returns over all stocks.
Long/Short Strategy. A more aggressive “long/short” strategy not only buys stocks with positive sentiment, but also proactively “shorts” stocks with negative sentiments. Investors “short” a stock they believe will drop in value, by “borrowing” stock shares and selling at the current price, then buying the stock shares back later at a lower price. The investor earns the price difference after a price drop. Shorting is generally considered to be very risky, because the price of a stock can go up without limit, thus there is no limit to the size of potential losses on a short position.
In our short strategy, if the aggregated sentiment on a stock is negative in previous week, we not only sell any shares of the stock in our portfolio, but we also short the stock for a week (and buy shares back at the end of the week). We short a number of shares equal to value to of our total portfolio. If and when we have lost 100% of the value initially allocated to a stock, then we close our position on that stock and remove it from our portfolio.
6.3 6.3 Empirical Evaluation
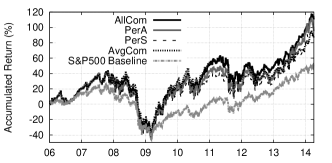
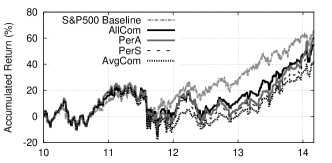
We evaluate trading strategies generated using a combination of author ranking heuristics and long vs. long/short trading strategies. For our author ranking heuristics, we use average return per article (PerA), average return per stock (PerS), number of total comments (AllCom), and average comments per article (AvgCom). As described above, we choose 500 stocks mentioned by the top ranked authors, and split the funds of a hypothetical portfolio evenly among them. Each week, we trade them based on aggregated sentiment from our chosen top authors from the previous week. By default, we regard one year as a cycle, and rerank authors and reset the list of stocks for the portfolio at the beginning of each year (using the heuristics of previous year).
Q1: Do our strategies outperform the broader markets?
We simulate our strategies using historical stock price data and compare them to a baseline following a “buy-and-hold” strategy on the S&P 500 index. We ignore transaction fees in our simulations and initially focus on the long-only strategy. We plot results in Figure 11.
The first takeaway is that SeekingAlpha clearly out-performs the baseline market under all settings. For example, our “all comment” strategy produces a normalized total return of 108% at the end of the 8-year period, compared to 47.8% of the S&P 500. This represents more than 10% annual compounded return, during a time period that includes two market crashes (2008, 2011), and not including dividends. Since StockTwits only started in 2009, its simulations ran on only 4 years of historical data. The same strategy on StockTwits produced a total return of around 54.5% from 2010 to 2014. This is a good return in absolute terms, but significantly below the baseline S&P 500 (64.1%) during the same timeframe.
Implications. This result is significant, because it means we can in fact use empirical methods to identify the articles of value from SeekingAlpha. More importantly, we significantly outperform the S&P 500 using a very simple trading strategy that ignores semantic meaning of the articles and uses only binary sentiment values. As context, we consider hedge funds, which manage money for large investors, and charge annually 2% of assets managed and 20% commission on all gains. The 2.5 trillion dollar hedge fund industry has underperformed the S&P 500 for 5 years in a row, and has fallen behind the S&P by 97% since 2008 [19]. Significantly outperforming the S&P over a period of 10 years would be considered excellent performance for a managed hedge fund. The fact that this is achieved by mining an open community like SeekingAlpha is quite surprising.
Q2: What ranking method identifies experts most effectively?
The next big question is can we validate a simple methodology for identifying the top performing authors. Among a number of author ranking heuristics, we find the all-comment metric (R-allC) to obtain the highest level of investment returns in our SeekingAlpha simulations (see Figure 11). Similarly, the same strategy also performs the best for StockTwits, outperforming other metrics in most years.
Implications. This result implies that not only does something as simple as comment count do a great job of identifying top authors in SeekingAlpha, but it does even better than heuristics based on prior-year performance. Note that we are not leveraging sentiment analysis on comments, only the number of comments. This implies that the majority of comments are supportive notes that validate the article’s analysis and insights. More importantly, this highlights the value of the SeekingAlpha user population as a filter to identify the best analysts among the authors. Even for a subject as complex and domain specific as stock analysis, a reasonably knowledgeable crowd can serve to pinpoint valuable content in an otherwise mixed collection of content.
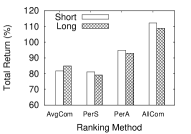

Q3: Do more aggressive strategies improve performance?
We also study the impact of allowing shorts of stocks along with traditional long positions. Shorting stocks is a typical strategy used by hedge funds, but rarely used by individual investors because of its potential for unbounded loss. We repeat the same experiment as above, but add a long/short strategy in addition to the long strategy. The results are plotted in Figure 12 (note the different time frames in the two subfigures). The high level observation is that adding shorts does improve performance for trading strategies based on SeekingAlpha, the improvement is not significant enough to justify the added risk.
Implications. Shorting stocks is a highly valued tool for hedge funds, who are expected to use it to produce positive returns even in negative markets. Yet our results show that the majority of user-contributed short strategies do not produce significant gains over long-only strategies. Given the significant added risk, this suggests that sentiment-based trading strategies should focus on long-only strategies to minimize risk while achieving the gains of a long/short strategy.
In summary, our measurement shows by carefully identifying top authors, data from SeekingAlpha can provide significant investment returns that consistently outpace the broader market. We also find that through their interactions and article comments, the broader user population can provide an effective filter for top authors and content.
7 7. SeekingAlpha User Survey
The final component of our study deploys a user survey on SeekingAlpha to better understand users’ levels of investment experience, and how they feel about the utility and reliability of SeekingAlpha articles. These responses will help us understand the level of impact articles have on SA users, and how they deal with any potentially manipulative articles.
7.1 7.1 Survey Setup
In May 2014, we sent out a user survey via private messages in SeekingAlpha to 500 authors and 500 non-contributing users. We received 199 responses (95 from authors and 104 from normal users). We chose authors and users to ensure we captured a full range of activity levels. We sorted authors into buckets by the number of articles written and users into buckets by the number of comments, and randomly sampled from each bucket to choose our targets.
We asked normal users 5 questions and authors 4 questions (see the full questions in Table 3 in the Appendix). First, to measure demographics, we ask both authors and users about their levels of investing experience (Q1). Second, to understand user’s perceived value of the platform, we ask whether normal users trade stocks based on SA articles (Q2) and whether they trust authors (Q3). For authors, we ask which platforms if any they would use to disseminate investing ideas if SeekingAlpha were no longer available (Q7). Third, in terms of risks in the platform, we ask both authors and users whether they have seen heavily biased (potentially manipulative) articles (Q4). Finally, we ask normal users for their reaction to stock manipulation (Q5), and authors whether they believe articles can actually impact stock price (Q6).

7.2 7.2 User Responses
We first look at demographics of the survey respondents. We plot responses to Q1 in Figure 13(a). The large majority of respondents have over 10 years of investing experience. Surprisingly, we find that the portion of experienced investors (i.e. 10 years) is higher in normal users than in authors.
Perceived Value. First, in response to Q2, 70% of users stated that they “sometimes” or “very often” traded stocks following opinions from SeekingAlpha. 5% of users stated they “always” relied on information from SA articles. The remaining 25% “never” followed views from articles. Two respondents added clarifying comments that they treated SeekingAlpha as an important information source for research, but did not follow opinions blindly. As a whole, it is clear that SeekingAlpha articles play an important role in most users’ investment decisions.
In response to Q3, 83% of users stated they trusted “some” or “most” SeekingAlpha authors, and 1% stated they fully trusted authors. 16% did not trust authors at all. This suggests that while SeekingAlpha users generally acknowledge the value of the platform, hesitations and concerns remain.
Q7 asked authors where they would disseminate their ideas if SeekingAlpha were no longer available. Surprisingly, only 6% of authors chose StockTwits, and more chose Twitter (7%), Yahoo! Finance Message Board (9%) and Motley Fool (22%). Still, the majority of authors (56%) did not choose any existing platform, but preferred a personal website or nothing at all. Clearly, SeekingAlpha provides a unique and valuable platform for its contributors.
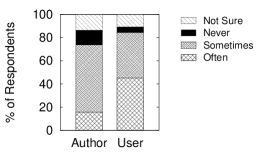
Biased Articles and Stock Manipulation. SeekingAlpha’s nature makes it possible for companies or individuals to profit by influencing users and manipulating stock prices. Some of these efforts were identified and publicly documented [11, 18]. Surprisingly, both authors and users (80%) stated that they have seen manipulative articles on SA (Figure 13(b)). More normal users reported frequently seeing manipulative articles. When asked about their response to manipulative articles (Q5), 42% stated that they would dispute the conclusions using comments on the article, 3% would report to SeekingAlpha admins, while 25% “do nothing.” 20 users added further detailed comments to explain: 15 respondents stated biased articles are to be expected and ignored; 2 people said they would blacklist the author and never read their articles again; 2 stated they could still extract value from dissenting comments on the article. Finally, one user stated that it was very difficult to distinguish between real stock manipulation articles and those from authors with strong personal preferences.
Impact. We ask if authors believe their articles have the power to impact stock prices (Q6). More than 62% of authors believed their articles could impact stock prices; 14% said no, and the rest were unsure. One author commented that SeekingAlpha articles typically cannot impact large cap stocks like Apple (AAPL), but they could affect small and micro cap stocks.
Finally, we also received unsolicited anecdotal feedback from past authors on additional types of author misbehavior. They identified some authors who generated large volumes of articles solely for the purpose of soliciting users to subscribe to their investment website memberships. They also identified others who produced detailed articles at extremely high volumes, too high to be produced even by a full time professional. The assertion is these accounts are managed by teams of writers who generate numerous articles to increase in reputation and ranking, only to then profit by manipulating one or two stocks they own in large volume. While we cannot confirm or disprove these assertions, they are consistent with other survey responses, and could account for the apparent disconnect between poor average correlation of articles and high correlation of articles by top authors (Section 6).
8 8. Related Work
Stock Market Prediction. Stock market prediction via data mining has been explored in a variety of contexts, including Google trends [31], Wikipedia [25], online blogs [9, 13], financial news [12, 33], and social content from Twitter [6, 7, 32, 34] and Facebook [17]. Some have studied stock-centered social networks, i.e. StockTwits [26, 27] and SeekingAlpha [8]. Most of these draw their conclusions based on short-term data of less than a year, despite the highly cyclical nature of bull and bear markets that lasts multiple years. In contrast, our data covers up to 9 years, long enough to cover both crashes (2008–2009) as well as strong bull markets (2013). In addition, our comparative analysis between StockTwits and SeekingAlpha helps us understand the impact of leveraging experts as contributors versus average users.
Sentiment-based Investment Strategies. There are a few works on sentiment based investment strategy. Most papers focus on the prediction and investment on several selected stocks [27]. Other work [23] invests on all possible stocks in the market. Prior works [4, 20] use small datasets from Twitter/StockTwits to quantify the high level of noise in overall sentiment, and to motivate the need for contributions from experts. This is consistent with our results that show the best performance is achieved from identifying and relying on top experts.
Sentiment Analysis. Existing sentiment analysis methods vary widely from dictionary based methods [10, 14, 22] to supervised machine learning algorithms [21, 29, 5]. Dictionary based methods require domain specific dictionaries [22] instead of general dictionaries such as WordNet [10], and do not work well with short texts like tweets [5] and reviews [29]. Researchers have applied supervised machine learning algorithms to sentiment classification, with common features such as term frequency, parts of speech, and negations [21].
Crowd-based Stock Prediction. Finally, Estimize777http://www.estimize.com is an open financial platform that aggregates estimates of company earnings reports from the opinions of independent, buy-side, and sell-side analysts, along with private investors. Estimize has contributions from 4628 analysts covering over 900 stocks. Note that Estimize focuses on predictions of quarterly earnings results, not stock performance.
9 9. Conclusions and Future Work
In this paper, we analyze the correlation between stock performance and user contributed content sentiment over a period of 4–9 years. Our analysis shows that while expert-contributed stock analysis in SeekingAlpha provides more positive correlation than user-generated content from StockTwits, the correlation is very weak. We show that valuable content can be extracted using well designed filters based on user comments, and can lead to strategies that significantly outperform the broader stock market. Future work lies in better identification of biased or manipulative content on SeekingAlpha, as well as further analysis of how to extend such methods to other platforms.
Our work suggests that even complex, domain specific tasks such as stock analysis can benefit from crowd-contributed content. While only a small portion of users can deliver valuable content, others in the crowd help by indirectly identifying the valuable content through their interactions. This bodes well for the application of crowdsourcing platforms to broader expert applications in the future.
References
- [1] About seekingalpha. http://seekingalpha.com/page/about_us.
- [2] About stocktwits. http://stocktwits.com/about.
- [3] Yahoo finance api. https://code.google.com/p/yahoo-finance-managed/.
- [4] Bar-Haim, R., et al. Identifying and following expert investors in stock microblogs. In Proc. of EMNLP (2011).
- [5] Barbosa, L., and Feng, J. Robust sentiment detection on twitter from biased and noisy data. In Proc. of COLING (2010).
- [6] Bollen, J., Mao, H., and Zeng, X. Twitter mood predicts the stock market. Journal of Computational Science 2, 1 (2011), 1–8.
- [7] Brown, E. D. Will twitter make you a better investor? a look at sentiment, user reputation and their effect on the stock market. In Proc. of SAIS (2012).
- [8] Chen, H., et al. Wisdom of crowds: The value of stock opinions transmitted through social media. Review of Financial Studies 27, 5 (2014), 1367–1403.
- [9] De Choudhury, M., et al. Can blog communication dynamics be correlated with stock market activity? In Proc. of HyperText (2008).
- [10] Esuli, A., and Sebastiani, F. Pageranking wordnet synsets: An application to opinion mining. In Proc. of ACL (2007).
- [11] Feuerstein, A. Galena biopharma pays for stock-touting campaign while insiders cash out millions. TheStreet News, February 2014.
- [12] Fung, G. P. C., et al. Stock prediction: Integrating text mining approach using real-time news. In Proc. of CIFER (2003).
- [13] Gilbert, E., and Karahalios, K. Widespread worry and the stock market. In Proc. of ICWSM (2010).
- [14] Godbole, N., Srinivasaiah, M., and Skiena, S. Large-scale sentiment analysis for news and blogs. In Proc. of ICWSM (2007).
- [15] Gonçalves, P., Araújo, M., Benevenuto, F., and Cha, M. Comparing and combining sentiment analysis methods. In Proc. of COSN (2013).
- [16] 2013 investment company fact book. Tech. rep., Investment Company Institute, 2013. http://www.ici.org/pdf/2013_factbook.pdf.
- [17] Karabulut, Y. Can facebook predict stock market activity? SSRN eLibrary (2011).
- [18] Kimelman, J. An insider’s tale of a stock promotion plan. Barrons News, March 2014.
- [19] Kishan, S., and Bit, K. Hedge funds trail stocks by the widest margin since 2005. Bloomberg News, December 2013.
- [20] Liao, W., et al. Winning by following the winners: Mining the behaviour of stock market experts in social media. In Proc. of SBP. 2014.
- [21] Liu, B. Sentiment analysis and opinion mining. Synthesis Lectures on Human Language Technologies 5, 1 (2012), 1–167.
- [22] Loughran, T., and McDonald, B. When is a liability not a liability? textual analysis, dictionaries, and 10-ks. The Journal of Finance 66, 1 (2011), 35–65.
- [23] Makrehchi, M., Shah, S., and Liao, W. Stock prediction using event-based sentiment analysis. In Proc. of WI-IAT (2013).
- [24] Mislove, A., et al. Measurement and analysis of online social networks. In Proc. of IMC (2007).
- [25] Moat, H. S., et al. Quantifying wikipedia usage patterns before stock market moves. Scientific Reports 3 (2013).
- [26] Oh, C., and Sheng, O. Investigating predictive power of stock micro blog sentiment in forecasting future stock price directional movement. In Proc. of ICIS (2011).
- [27] Oliveira, N., Cortez, P., and Areal, N. On the predictability of stock market behavior using stocktwits sentiment and posting volume. In Progress in AI. 2013.
- [28] Pang, B., and Lee, L. Opinion mining and sentiment analysis. FTIR 2, 1-2 (2008), 1–135.
- [29] Pang, B., Lee, L., and Vaithyanathan, S. Thumbs up?: sentiment classification using machine learning techniques. In Proc. of ACL (2002).
- [30] Pearson, K. Contributions to the mathematical theory of evolution. II. skew variation in homogeneous material. Phil. Trans. R. Soc. A 186 (1895), 343–414.
- [31] Preis, T., Moat, H. S., and Stanley, H. E. Quantifying trading behavior in financial markets using google trends. Scientific Reports 3 (2013).
- [32] Rao, T., and Srivastava, S. Analyzing stock market movements using twitter sentiment analysis. In Proc. of ASONAM (2012).
- [33] Schumaker, R. P., and Chen, H. Textual analysis of stock market prediction using breaking financial news: The azfin text system. ACM TOIS 27, 2 (2009), 12.
- [34] Sprenger, T. O., et al. Tweets and trades: The information content of stock microblogs. European Financial Management (2013).
- [35] Tweney, D. Seeking alpha: Who needs an acquisition when we’re doing so well? VentureBeat News, October 2013.
- [36] Wilson, C., et al. User interactions in social networks and their implications. In Proc. of EuroSys (2009).
Appendix A – SeekingAlpha Survey
These are the questions sent out in our questionnaire to SeekingAlpha users and contributors. We focused on limiting the number of questions to improve our chances of getting responses. Authors or contributors were asked four questions (#1, #4, #6, and #7 in Table 3), while non-contributing users were asked five questions (#1, #2, #3, #4, and #5).
| ID | Question | Tester |
|---|---|---|
| 1 | How many years of experience do you have in investing in the stock market? | Author & User |
| 2 | How often do you trade stocks based on opinions and information gathered from reading SeekingAlpha articles? | User |
| 3 | Do you think you can trust the authors on SeekingAlpha? | User |
| 4 | How often have you seen articles on SeekingAlpha that looked like they were heavily biased, written with the intent to manipulate a particular stock (to move its price up or down)? | Author & User |
| 5 | If and when you did see what looked like an article intent on stock manipulation, what is your general reaction? | User |
| 6 | Do you think SeekingAlpha articles can impact the future movement of stocks they focus on? | Author |
| 7 | If SeekingAlpha did not exist, where would you post your investment ideas? | Author |