Navigating in a sea of repeats in RNA-seq without drowning
Abstract
The main challenge in de novo assembly of NGS data is certainly to deal with repeats that are longer than the reads. This is particularly true for RNA-seq data, since coverage information cannot be used to flag repeated sequences, of which transposable elements are one of the main examples. Most transcriptome assemblers are based on de Bruijn graphs and have no clear and explicit model for repeats in RNA-seq data, relying instead on heuristics to deal with them. The results of this work are twofold. First, we introduce a formal model for representing high copy number repeats in RNA-seq data and exploit its properties for inferring a combinatorial characteristic of repeat-associated subgraphs. We show that the problem of identifying in a de Bruijn graph a subgraph with this characteristic is NP-complete. In a second step, we show that in the specific case of a local assembly of alternative splicing (AS) events, we can implicitly avoid such subgraphs. In particular, we designed and implemented an algorithm to efficiently identify AS events that are not included in repeated regions. Finally, we validate our results using synthetic data. We also give an indication of the usefulness of our method on real data.
1 Introduction
Transcriptomes can now be studied through sequencing. However, in the absence of a reference genome, de novo assembly remains a challenging task. The main difficulty certainly comes from the fact that sequencing reads are short, and repeated sequences within transcriptomes could be longer than the reads. This short read / long repeat issue is of course not specific to transcriptome sequencing. It is an old problem that has been around since the first algorithms for genome assembly. In this latter case, the problem is somehow easier because the coverage can be used to discriminate contigs that correspond to repeats, e.g. using Myer’s A-statistics [6] or [7]. In transcriptome assembly, this idea does not apply, since the coverage of a gene does not only reflect its copy number in the genome, but also and mostly its expression level. Some genes are highly expressed and therefore highly covered, while most genes are poorly expressed and therefore poorly covered.
Initially, it was thought that repeats would not be a major issue, since they are mostly in introns and intergenic regions. However, the truth is that many regions which are thought to be intergenic are transcribed [2] and introns are not always spliced out yet when mRNA is collected to be sequenced. Repeats are therefore very present in real samples, especially transposable elements, and cause major problems in transcriptomic assembly.
Most, if not all current short-read transcriptome assemblers are based on de Bruijn graphs. Among the best known are Oases [12], Trinity [3], and to a lesser degree Trans-Abyss [9] and IDBA-tran [8]. Common to all of them is the lack of a clear and explicit model for repeats in RNA-seq data. Heuristics are thus used to try and cope efficiently with repeats. For instance, in Oases short nodes are thought to correspond to repeats and are therefore not used for assembling genes. They are added in a second step, which hopefully causes genes sharing repeats not to be assembled together. In Trinity, there is no attempt to deal with repeats explicitly. The first module of Trinity, Inchworm, will try and assemble the most covered contig which hopefully corresponds to the most abundant alternative transcript. Then alternative exons are glued to this major transcript to form a splicing graph. The last step is to enumerate all alternative transcripts. If repeats are present, their high coverage may be interpreted as a highly expressed link between two unrelated transcripts. Overall, assembled transcripts may be chimeric or spliced into many sub-transcripts.
In the method we developed, KisSplice, which is a local transcriptome assembler [10], repeats may be less problematic, since the goal is not to assemble full-length transcripts. Instead, KisSplice aims at finding variations in the transcriptome (SNPs, indels and alternative splicings). However, we previously reported that we were not able to deal with large parts of the de Bruijn graph containing subgraphs associated to highly repeated sequences [10].
Here, we try and achieve two goals: (i) give a clear formalization of the notion of repeats in RNA-seq data, and (ii) give a practical way to enumerate bubbles that are lost because of such repeats. Recall that we are in a de novo context, so we assume that neither a reference genome/transcriptome nor a database of known repeats, e.g. RepeatMasker [13], is available.
In particular, we formally introduce a model for representing the repeats and exploit its properties to infer a parameter characterizing repeated-associated subgraphs in a de Bruijn graph. We prove its relevance but we also show that the problem of identifying in a de Bruijn graph a subgraph corresponding to repeats using such a characteristic is NP-complete. Hence, a polynomial time algorithm for repeat identification that uses such characterization is unlikely. Finally, we show that in the specific case of a local assembly of alternative splicing (AS) events, we can implicitly avoid such subgraphs. More precisely, it is possible to find the structures (i.e. bubbles) corresponding to AS events in a de Bruijn graph that are not contained in a repeated-associated subgraph. Finally, using simulated RNA-seq data we show that the new algorithm can improve by a factor 2 the sensitivity of KisSplice, while also improving the precision. We also give an indication of the usefulness of our method in real data.
2 Preliminaries
Let be an alphabet of fixed size . Here we always assume . Given , let denote its length, the th element of , and the substring for any .
A -mer is a sequence . Given an integer and a set of sequences each of length , we define as the set of all distinct -mers that appear as a subsequence in .
Definition 1
Given a set of sequences (reads) and an integer , we define the directed de Bruijn graph where and .
Given a directed graph and a vertex , we denote its out-neighborhood (resp. in-neighborhood) by (resp. ), and its out-degree (in-degree) by (). A (simple) path in is a sequence of distinct vertices in which , and for each , is an arc of . If the graph is weighted, i.e. if there is a function associating a weight to every arc in the graph, then the length of a path is the sum of the weights of the traversed arcs, and is denoted by .
An arc is called compressible if and . The intuition behind this definition comes from the fact that every path passing through should also pass through . It should therefore be possible to “compress” or contract this arc without losing any information. Note that the compressed de Bruijn graph [3, 12] commonly used by transcriptomic assemblers is obtained from a de Bruijn graph by replacing, for each compressible arc , the vertices by a new vertex , where , and the label is the concatenation of the -mers of and without the overlapping part. See Fig. 1 for an example of a compressible arc in a de Bruijn graph.
3 Repeats in de Bruijn graphs
Given a de Bruijn graph generated by a set of reads for which we do not have any information, the aim is to identify whether there are subgraphs of that correspond each to a set of repeats in . To this end, we try to identify and then exploit some of the topological properties of the subgraphs that are induced by repeats. Starting with a formal model for representing the repeats, we show that the number of compressible arcs, which we denote by , is a relevant parameter for such a characterization. However, we also prove that, for an arbitrary de Bruijn graph, identifying a subgraph with bounded is NP-complete.
3.1 Simple uniform model for repeats
We now present the model we adopted for representing the repetition of a same sequence in a genome or transcriptome. This model is a simple one and as such should be seen as only a first approximation of what may happen in reality. Moreover, it allowed us to infer one characteristic of repeated-associated subgraphs in a de Bruijn graph, namely that such subgraphs contain few compressible arcs. It is important to point out however that the model is realistic enough in most cases. In particular, it enables to model well recent invasions of transposable elements which often involve a large number of similar copies. Such elements are among the most important sources of repeats in the analysis of NGS data (DNA or RNA-seq). The number of compressible arcs is one of the criteria used to define so-called short nodes in Oases but no model or theoretical justification was given [12]. This is one of the main contributions of this paper. In future, it would be important to consider more realistic models, and we mention one in the perspectives. Mathematically, one has to be aware however that such models will be harder to analyze.
The model is as follows. First, due to mutations, the sequences that represent the repeats are not identical. However, provided that the number of such mutations is not high (otherwise the concept of repeats would not apply), the repeats are considered “similar” in the sense of pair-wisely presenting a small Hamming distance. We recall that, given two equal length sequences and in , the Hamming distance between them, denoted by , is the number of positions for which .
The model has then the following parameters: , the length of the repeat, the number of copies of the repeat, an integer (for the length of the -mers considered), and the mutation rate, , i.e. the probability that a mutation happens in a particular position.
We first choose uniformly at random a sequence . At step , we create a sequence as follows: for each position , with probability , whereas with probability a value different from is chosen uniformly at random for . We repeat the whole process times and thus create a set of such sequences from (see Fig.2 for a small example). The generated sequences thus have an expected Hamming distance of from .
3.2 Topological characterization of the subgraphs generated by repeats
Given a de Bruijn graph , if is a compressible arc labeled by the sequence , then by definition, is the only outgoing arc of the vertex labeled by the sequence and the only incoming arc of the vertex labeled by the sequence . Hence the -mer will appear as a substring in , always preceded by the symbol and followed by the symbol . For the sake of simplicity, we refer to such -mers as being boundary rigid. It is not difficult to see that the set of compressible arcs in a de Bruijn graph stands in a one-to-one correspondence with the set of boundary rigid -mers in .
We now calculate and compare among them the expected number of compressible arcs in when corresponds to a set of repeats that are generated: (i) uniformly at random, and (ii) according to our model. We show that is “small” in the cases where the induced graph corresponds to similar sequences, which provides evidence for the relevance of this parameter.
Claim
Let be a set of sequences randomly chosen from . Then the expected number of compressible arcs in is .
Proof
The probability that a sequence of length occurs in a fixed position in a randomly chosen sequence of length is . Thus the expected number of appearances of a sequence of length in a set of randomly chosen sequences of length is given by . If , then this value is upper bounded by , and all the sequences of length are boundary rigid (as a sequence appears once). The claim follows by observing that there are different -mers. ∎
We consider now for . We upper bound the expected number of compressible arcs by upper bounding the number of boundary rigid -mers.
Theorem 3.1
Given integers with and a real number , the de Bruijn graph has expected compressible arcs.
Proof
Let be a sequence chosen randomly from . Let be the set of repeats generated according to our model starting from . Consider now the de Bruijn graph . Recall that the number of compressible arcs in this graph is equal to the number of boundary rigid -mers in . Let be a random variable representing the number of boundary rigid -mers in . Consider the repeats in in a matrix-like ordering as in Fig.2 and observe that the mutations from one column to another are independent. Due to the symmetry and the linearity of expectation, is given by (the total number of -mers) multiplied by the probability that a given -mer is boundary rigid.
The probability that the -mer is boundary rigid clearly depends on the distance from the starting sequence . Let be the distance .
Observe that if the -mer is not boundary rigid then there exists a sequence in such that for all and either or . It is not difficult to see that the probability that this happens is lower bounded by . Hence we have:
By approximating the above expression we therefore have that,
| (1) | ||||
For a sufficiently large number of copies (e.g. ) and using the fact that , we have that is . This concludes the proof. ∎
The previous result shows that the number of compressible arcs is a good parameter for characterizing a repeat-associated subgraph.
3.3 Identifying a repeat-associated subgraph
As we showed, a subgraph due to repeated elements has a distinctive feature: namely it contains few compressible arcs. Based on this, a natural formulation to the repeat identification problem in RNA-seq data is to search for large enough subgraphs that do not contain many compressible arcs. This is formally stated in Problem 1. In order to disregard trivial solutions, it is necessary to require a large enough connected subgraph, otherwise any set of disconnected vertices or any small subgraph would be a solution. Unfortunately, we show that this problem is NP-complete, so an efficient algorithm for the repeat identification problem based on this formulation is unlikely.
Problem 1 (Repeat Subgraph)
INSTANCE: A directed graph and two positive integers , .
DECIDE: If there exists a (connected) subgraph , with and having at most compressible arcs.
In Theorem 3.2, we prove that this problem is NP-complete for all directed graphs with the (total) degree, i.e. the sum of in and out-degree, bounded by 3. The reduction is from the Steiner tree problem which requires finding a minimum weight subgraph spanning a given subset of vertices. It remains NP-hard even when all arc weights are 1 or 2 (see [1]), this version is denoted by STEINER. More formally, given a complete undirected graph with arc weights in , a set of terminal vertices and an integer , it is NP-complete to decide if there exists a subgraph of spanning with weight at most , i.e. a connected subgraph of containing all vertices of .
We specify next a family of directed graphs that we use in the reduction. Given an integer we define the directed graph as a cycle on vertices numbered in a clockwise order and where the arcs have alternating directions, i.e. for any , is an arc. Note that in all vertices in even positions, i.e. have out-degree and in-degree and those out-degree and in-degree . Clearly, none of the arcs of is compressible.
Theorem 3.2
The Repeat Subgraph Problem is NP-complete even for directed graphs with degree bounded by , for any .
Proof
Given a complete graph , a set of terminal vertices and an upper bound , i.e. an instance of STEINER, we transform it into an instance of Repeat Subgraph Problem with a graph with degree bounded by . Let us build the graph . For each vertex in , add a corresponding subgraph in and for each vertex in , add a corresponding subgraph in . For each arc in with weight , add a simple directed path composed by compressible arcs connecting to in , the subgraphs corresponding to and . The first vertex of the path should be in a sink of and the last vertex in a source of . By construction there are at least vertices with in-degree and out-degree (sink) and vertices with out-degree and in-degree (source) in both and . It is clear that has degree bounded by . Moreover, the size of is polynomial in the size of and it can also be polynomially constructed.
In this way, the graph has one subgraph for each vertex of and a path with one or two (depending on the weight of the corresponding arc) compressible arcs for each arc of . Thus, there exists a subgraph spanning in with weight at most if and only if there exists a subgraph in with at least vertices and at most compressible arcs. This follows from the fact that any subgraph of with at least vertices necessarily contains all the subgraphs , where , since the number of vertices in all , with , is at most and the only compressible arcs of are in the paths corresponding to the arcs of . ∎
We can obtain the same result for the specific case of de Bruijn graphs. The reduction is very similar but uses a different graph family.
Theorem 3.3
The Repeat Subgraph Problem is NP-complete even for subgraphs of de Bruijn graphs on symbols.
4 Bubbles “drowned” in repeats
In the previous section, we showed that an efficient algorithm to directly identify the subgraphs of a de Bruijn graph corresponding to repeated elements is unlikely to exist since the problem is NP-complete. However, in this section we show that in the specific case of a local assembly of alternative splicing (AS) events, we can implicitly avoid such subgraphs. More precisely, it is possible to find the structures (i.e. bubbles) corresponding to AS events in a de Bruijn graph that are not contained in a repeat associated subgraph, thus answering to the main open question of [10].
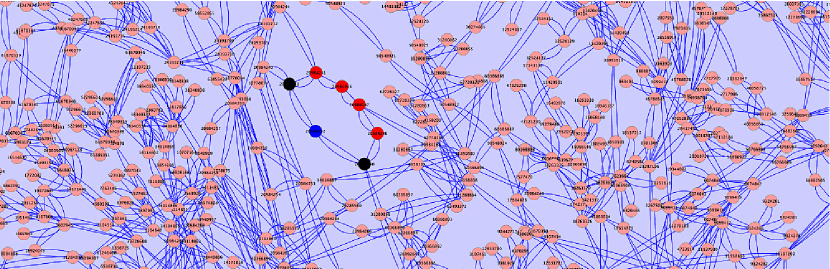
KisSplice [10] is a method for de novo calling of AS events through the enumeration of so-called bubbles, that correspond to pairs of vertex-disjoint paths in a de Bruijn graph. The bubble enumeration algorithm proposed in [10] was later improved in [11]. However, even the improved algorithm is not able to enumerate all bubbles corresponding to AS events in a de Bruijn graph. There are certain complex regions in the graph, likely containing repeat-associated subgraphs but also real AS events [10], where both algorithms take a huge amount of time. See Fig. 3 for an example of a complex region with a bubble corresponding to an AS event. The enumeration is therefore halted after a given timeout. The bubbles drowned (or trapped) inside these regions are thus missed by KisSplice. Here, we impose an extra restriction to the bubbles, reflecting the fact that they are in complex regions but not in a repeat-associated subgraph. In this way, we can enumerate bubbles in complex regions implicitly avoiding repeat-associated subgraphs.
Definition 2 (-bubbles)
Given a directed graph and two vertices , an -bubbles is a pair of vertex-disjoint -paths , with lengths bounded by , each containing at most branching vertices.
This extends -bubbles (Def. 1 in [11]) by adding the extra condition that each path should have at most branching vertices. The number of branching vertices is proportional to the number of incompressible arcs. Intuitively, if a bubble contains many incompressible arcs, it is likely contained in a repeat-associated subgraph. Hence, by limiting the number of branching vertices (incompressible arcs) we avoid the vertices from repeat-associated subgraphs. Indeed, in Section 4.2 we show that by considering bubbles with at most branching vertices in KisSplice, we increase both sensitivity and precision. This supports our claim that by focusing on -bubbles, we avoid repeat-associated subgraphs and recover at least part of the bubbles trapped in complex regions.
4.1 Enumerating bubbles avoiding repeats
In this section, we modify the algorithm of [11] to enumerate all bubbles with at most branching vertices in each path. Given a weighted directed graph and a vertex , let denote the set of -bubbles of . The algorithm recursively partitions the solution space at every call until the considered subspace is a singleton (contains only one solution) and in that case it outputs the corresponding solution. In order to avoid unnecessary recursive calls, it maintains the invariant that the current partition contains at least one solution. It proceeds as follows.
Invariant: At a generic recursive step on vertices (initially, ), let be the paths discovered so far (initially, are empty). Let be the current graph (initially, ). More precisely, is defined as follows: remove from all the vertices in and but and . Moreover, we also maintain the following invariant (): there exists at least one pair of paths and in that extends and so that and belongs to .
Base case: When , output the -bubble given by and .
Recursive rule: Let denote the set of -bubbles to be listed by the current recursive call, i.e. the subset of with prefixes . Then, it is the union of the following disjoint sets111The same holds for instead of ..
-
•
The bubbles of that use , for each arc out-going from , that is , where is the subgraph of after the removal of and all its incident arcs.
-
•
The bubbles that do not use any arc from , that is , where is the subgraph of after the removal of all arcs out-going from .
In order to maintain the invariant (), we only perform the recursive calls when or are non-empty. In both cases, we have to decide if there exists a pair of (internally) vertex-disjoint paths and , such that , , and have at most branching vertices, respectively. Since both the length and the number of branching vertices are monotonic properties, i.e. the length and the number of branching vertices of a path prefix is smaller than this number for the full path, we can drop the vertex-disjoint condition. Indeed, let and be a pair of paths satisfying all conditions but the vertex-disjointness one. The prefixes and , where is the first intersection of the paths, satisfy all conditions and are internally vertex-disjoint. Moreover, using a dynamic programming algorithm, we can obtain the following result.
Lemma 1
Given a non-negatively weighted directed graph and a source , we can compute all shortest paths from using at most branching vertices in time.
As a corollary, we can decide if is non-empty in . Now, using an argument similar to [11], i.e. leaves of the recursion tree and solutions are in one-to-one correspondence and the height of the recursion tree is bounded by , we obtain the following theorem.
Theorem 4.1
The -bubbles can be enumerated in time. Moreover, the time elapsed between the output of any two consecutive solutions (delay) is .
4.2 Experimental results
To evaluate the performance of our method, we simulated RNA-seq data using the FluxSimulator version 1.2.1 [4]. We generated 100 million reads of 75 bp with the default error model provided by the FluxSimulator. We used the RefSeq annotated Human transcriptome (hg19 coordinates) as a reference and we performed a two-step pipeline to obtain a mixture of mRNA and pre-mRNA (i.e. with introns not yet spliced). To achieve this, we first ran the FluxSimulator with default settings with the Refseq annotations. Then we modified the annotations to include the introns and re-ran FluxSimulator on this modified version. In this second run, we additionally constrained the expression values of the pre-mRNAs to be correlated to the expression values of their corresponding mRNAs, as simulated in the first run. Finally, we mixed the two sets of reads to obtain a total of 100M reads. We tested two values: 5% and 15% for the proportion of reads stemming from pre-mRNAs. Those values were chosen so as to correspond to realistic ones as observed in a cytoplasmic mRNA extraction (5%) and a total (cytoplasmic + nuclear) mRNA extraction [14].
On this simulated dataset, we ran KisSplice [10] version 2.1.0 (KsOld) and 2.2.0 (KsNew, with a maximum number of branching nodes set to 5) and obtained lists of detected bubbles that are putative alternative splicing (AS) events.
In order to assess the precision and the sensitivity of our method, we compared our set of found AS events to the set of true AS events. Following the definition of Astalavista, an AS event is composed of two sets of transcripts, the inclusion/exclusion isoforms respectively. An AS event is said to be true if at least one transcript among the inclusion isoforms and one among the exclusion isoforms is present in the simulated dataset with at least one read. We outline that this definition is very permissive and includes AS events with very infrequent transcripts.
To compare the results of KisSplice with the true AS events, we propose that a true AS event is found (counted as a true positive (TP)) if there is a bubble with one path corresponding to the inclusion set and the other to the exclusion set. If not, the event is counted as a false negative (FN). In the meantime, if a bubble does not correspond to any true AS event, it is counted as a false positive (FP). To align the paths of the bubbles to transcript sequences, we used the Blat aligner [5] with 95% identity and a constraint of 95% of each bubble path length to be aligned (to account for the sequencing errors simulated by FluxSimulator). We computed the sensitivity TP/(TP+FN) and precision TP/(TP+FP) for each simulation case and we report their values for various classes of expression of the minor isoform. Expression values are measured in reads per kilobase (RPK).
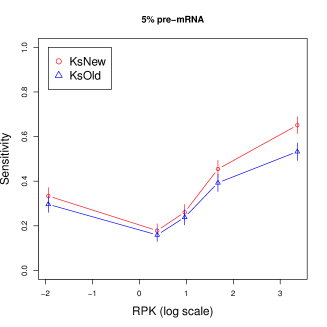
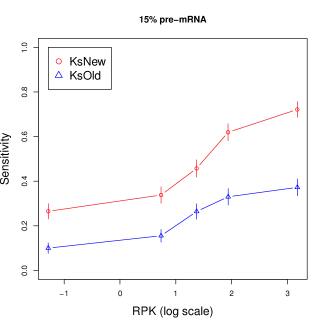
The plots for the sensitivity of each version on the two simulated datasets are shown in Fig. 4. On the one hand, both versions of KisSplice have similar sensitivity in the 5% pre-mRNA dataset, with KsNew performing slightly better, especially for highly expressed variants. On the other hand, the sensitivity of the new version is considerably better over all classes of expression levels in the 15% pre-mRNA dataset. In this case, the precisions for KsNew and KsOld are 21% and 41%, respectively. This represents an improvement of almost 100% over the old version. The results reflect the fact that the most problematic repeats are in intronic regions. A small unspliced mRNA rate leads to few repeat-associated subgraphs, so there are not many AS events drowned in them (which are then missed by KsOld). In this case, the advantage of using KsNew is less obvious, whereas a large proportion of pre-mRNA leads to more AS events drowned in repeat-associated subgraphs which are identified by KsNew and missed by KsOld.
Clearly, any improvement in the sensitivity is meaningless if there is also a significant decrease in precision. This is not the case here. In both datasets, KsNew improves the precision of KsOld. It increases from 95% to 98% and from 90% to 99%, in the 5% and 15% datasets, respectively. Moreover, both running times and memory consumption are very similar for both versions.
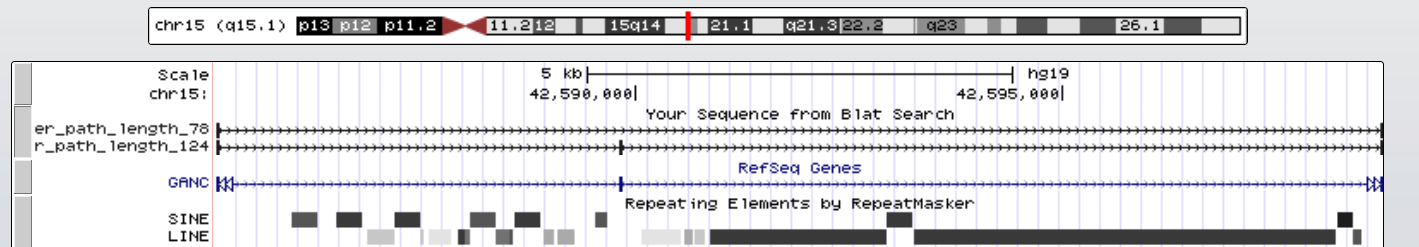
In order to give an indication of the usefulness of our repeat-avoiding bubble enumeration algorithm with real data, we also ran KsNew and KsOld in the SK-N-SH Human neuroblastoma cell line RNA-seq dataset (wgEncodeEH000169, total RNA). In Fig. 5 we have an example of a non-annotated exon skipping event not found by KsOld. Observe that the intronic region contains several transposable elements (many of which are Alu sequences), while the exons contain none. This is a good example of a bubble (exon skipping event) drowned in a complex region of the de Bruijn graph. The bubble (composed by the two alternative paths) itself contains no repeated elements, but it is surrounded by them. In other words, this is a bubble with few branching vertices that is surrounded by repeat-associated subgraphs. Since KsOld is unable to differentiate between repeat-associated subgraphs and the bubble, it spends a prohibitive amount of time in the repeat-associated subgraph and fails to find the bubble.
5 Conclusion
Although transcriptome assemblers are now commonly used, their way to handle repeats is not satisfactory, arguably because the presence of repeats in transcriptomes has been underestimated so far. Given that most RNA-seq datasets correspond to total mRNA extractions, many introns are still present in the data and their repeat content cannot be simply ignored. In this paper, we propose a simple model for repeats. Clearly this model could be improved, for instance by using a tree-like structure to take into account the evolutionary nature of repeat (sub)families. Variability in the sizes of the copies of a repeat family would also enable to model more realistically the true nature of families of transposable elements (the type of repeats which cause most trouble in assembly). Certainly, a mathematical analysis of a more realistic model would be more difficult to obtain. On the other hand, our simple model captures an important qualitative characteristic of repeat-associated subgraphs: the presence of few compressible arcs. This characterization allows us to design an efficient algorithm to identify bubbles corresponding to AS events implicitly avoiding repeat-associated subgraphs. This approach improves both the sensitivity and the precision of KisSplice.
References
- [1] M. Bern and P. Plassmann. The steiner problem with edge lengths 1 and 2. Information Processing Letters, 1989.
- [2] S. Djebali, C.A. Davis, A. Merkel, and A. Dobin et al. Landscape of transcription in human cells. Nature, (7414):101–108, 2012.
- [3] M. G. Grabherr, B. J. Haas, M. Yassour, and J.Z. et al. Levin. Full-length transcriptome assembly from RNA-Seq data without a reference genome. Nature Biot., 2011.
- [4] T. Griebel, B. Zacher, P. Ribeca, and E. Raineri et al. Modelling and simulating generic RNA-Seq experiments with the flux simulator. Nucleic Acids Res., 2012.
- [5] W. J. Kent. BLAT–the BLAST-like alignment tool. Genome Research, 12(4):656–664, 2002.
- [6] E. W. Myers, G. G. Sutton, A. L. Delcher, and I.M. Dew et al. A whole-genome assembly of drosophila. Science, 287(5461):2196–204, March 2000.
- [7] P. Novák, P. Neumann, and J. Macas. Graph-based clustering and characterization of repetitive sequences in next-generation sequencing data. BMC Bioinformatics, 2010.
- [8] Y. Peng, H. C. M. Leung, S.-M. Yiu, and M.-J. Lv et al. IDBA-tran: a more robust de novo de bruijn graph assembler for transcriptomes with uneven expression levels. Bioinformatics, 29(13):326–334, 2013.
- [9] G. Robertson, J. Schein, R. Chiu, and R. Corbett et al. De novo assembly and analysis of RNA-seq data. Nature methods, 7(11):909–912, 2010.
- [10] G. Sacomoto, J. Kielbassa, R. Chikhi, and R. Uricaru et al. KISSPLICE: de-novo calling alternative splicing events from RNA-seq data. BMC Bioinformatics, 13(Suppl 6):S5, 2012.
- [11] G. Sacomoto, V. Lacroix, and M.-F. Sagot. A polynomial delay algorithm for the enumeration of bubbles with length constraints in directed graphs and its application to the detection of alternative splicing in rna-seq data. In WABI, pages 99–111, 2013.
- [12] M. H. Schulz, D. R. Zerbino, M. Vingron, and E. Birney. Oases: robust de novo RNA-seq assembly across the dynamic range of expression levels. Bioinformatics, 2012.
- [13] A. F. A. Smit, R. Hubley, and P. Green. RepeatMasker Open-3.0, 1996-2004.
- [14] H. Tilgner, D. G. Knowles, R. Johnson, and C. A. Davis et al. Deep sequencing of subcellular RNA fractions shows splicing to be predominantly co-transcriptional in the human genome but inefficient for lncRNAs. Genome Res., 22(9):1616–1625, 2012.