Constraints on the gas masses of low- damped Lyman- systems
Abstract
We report a deep search for redshifted Hi 21cm emission from three damped and sub-damped Lyman- absorbers (DLAs) at with the Green Bank Telescope (GBT). No evidence for a redshifted Hi 21cm emission signal was obtained in the GBT spectra of two absorbers, with the data on the third rendered unusable by terrestrial interference. The non-detections of Hi 21cm emission yield strong constraints on the Hi masses of the associated galaxies, M M⊙ for the sub-DLA at towards J1553+3548, and M M⊙ for the DLA at towards J1619+3342, where is the Hi 21cm line width, in km s-1. This continues the trend of low Hi masses found in all low- DLAs and sub-DLAs that have been searched for redshifted Hi 21cm emission. Low-redshift absorbers with relatively low Hi column densities, cm-2, thus do not typically arise in massive gas-rich galaxies.
keywords:
galaxies: evolution: – galaxies: high redshift – quasars: absorption lines – radio lines: galaxies1 Introduction
Understanding the nature of the galaxies that give rise to damped Lyman- systems (DLAs) and their redshift evolution has been an important question in galaxy evolution for nearly thirty years. With Hi column densities cm-2, similar to those seen on sightlines through local galactic disks, DLAs are the highest Hi column density systems detected in absorption in the optical and ultraviolet (UV) spectra of background quasars and are presumably the high- counterparts of today’s normal galaxies. Further, while the Hi content of high- DLAs is insufficient (by about a factor of 2) to entirely fuel the stars observed in today’s galaxies (e.g. Prochaska et al., 2005; Noterdaeme et al., 2009), DLAs contain the bulk of the neutral hydrogen at high redshifts (%; e.g. O’Meara et al., 2007).
The fact that DLAs are selected to lie along the sightline to bright quasars implies that it is difficult to directly image the host galaxies, and estimate their stellar masses and star formation rates (SFRs). Indeed, despite numerous searches, galaxy counterparts have been identified and/or SFRs estimated for only about ten DLAs at (see, e.g., Krogager et al., 2012, and references therein), with a few more systems identified at (e.g. Péroux et al., 2012). It is also clear from these studies that typical high- DLAs have low SFRs, yr-1, making them additionally difficult to detect in optical/near-infrared line or continuum emission (e.g. Fumagalli et al., 2010). Finally, sensitivity issues with current radio telescopes have precluded the detection of, or even useful limits on, radio Hi 21cm or CO line emission from high- DLAs (e.g. Wiklind & Combes, 1994; Kanekar et al., 2006).
Most of our information on DLAs at all redshifts hence stems from absorption spectroscopy. For example, optical and UV spectroscopy have yielded estimates of metallicities and abundances in a large number of DLAs out to (see Rafelski et al., 2012, and references therein). DLA metallicities are now known to evolve with redshift, with the average metallicity higher at low redshifts (e.g. Prochaska et al., 2003; Rafelski et al., 2012); however, low metallicities are typical at all redshifts. The correlations observed between DLA metallicities and both the velocity widths or rest equivalent widths of low-ionization metal lines (Wolfe & Prochaska, 1998; Ledoux et al., 2006; Prochaska et al., 2008) suggest the presence of a mass-metallicity relation in DLAs (e.g. Møller et al., 2013; Neeleman et al., 2013), as has been observed in other high- galaxies (e.g. Tremonti et al., 2004). High- DLAs have been shown to have low molecular fractions, typically , with only one-sixth showing detectable absorption (e.g. Ledoux et al., 2003; Noterdaeme et al., 2008). High- DLAs also have low fractions of cold atomic gas, with most of the Hi in the warm phase for absorbers at (e.g. Kanekar & Chengalur, 2003; Kanekar et al., 2014), apparently due to the low DLA metallicities and hence, the paucity of cooling routes (Kanekar & Chengalur, 2001; Kanekar et al., 2009). Low-ionization metal lines detected in DLAs tend to have multiple components, sometimes with very different relative abundances (e.g. Dessauges-Zavadsky et al., 2006; Kanekar et al., 2006), and large velocity widths, km s-1 (Prochaska & Wolfe, 1997).
While the above results provide insight on physical conditions in DLAs, they only trace conditions along the narrow pencil beam towards the background QSO. There is hence often ambiguity in their interpretation, even in terms of the big-picture view (e.g. large disk galaxies versus small merging systems; Prochaska & Wolfe, 1997; Haehnelt et al., 1998). As a result, we as yet have very little information on the basic physical characteristics of high- DLAs, especially their mass and size.
At low redshifts, Hubble Space Telescope and ground-based imaging of DLA fields have found DLAs to arise in a range of galaxy types, from dwarfs to large spiral disks (e.g. le Brun et al., 1997; Rao et al., 2003; Chen et al., 2005), consistent with the general galaxy population (e.g. Zwaan et al., 2005). However, these results have been limited both by the small sample size and by concerns that a fainter galaxy at yet smaller impact parameter (i.e. beneath the quasar) might be responsible for the DLA absorption. As such, the crucial missing pieces in our understanding of DLA evolution remain the masses and sizes of the absorbing galaxies.
Low- DLAs offer the exciting possibility of resolving the above issues through a direct measurement of the Hi mass, the spatial extent of the neutral gas and the gas velocity field, via Hi 21cm emission observations. Unlike optical imaging studies, which, even for low- DLAs are typically stymied by the quasar (although see Fumagalli et al., 2010), Hi 21cm observations permit detections of galaxies at all impact parameters from the quasar sightline. And, of course, it would be possible to relate the measured properties to the characteristics of the DLA obtained from optical/UV absorption spectroscopy (e.g. metallicities, abundances, etc) and optical/UV imaging (e.g. star formation rates, stellar masses, etc) to obtain a comprehensive picture of the absorbing galaxies.
Until recently, the weakness of the Hi 21cm transition as well as the lack of damped and sub-damped Lyman- absorbers at low redshifts, had limited searches for Hi 21cm emission to three absorbers, at towards PG 1216+069 (Kanekar & Chengalur, 2005; Briggs & Barnes, 2006), at towards SBS1549+543 (Bowen et al., 2001; Chengalur & Kanekar, 2002) and towards PKS 0439433 (Kanekar et al., 2001). The high far-ultraviolet sensitivity of the new Cosmic Origins Spectrograph (COS) onboard the Hubble Space Telescope (HST) has resulted in the detection of three new DLAs and sub-DLAs at (Meiring et al., 2011). In this Letter, we report a search for redshifted Hi 21cm emission from these absorbers, at towards J1553+3548, towards J1619+3342 and towards J1009+0713, using the Green Bank Telescope (GBT).
2 Observations, data analysis and results
The GBT L-band receiver was used for the observations between June and September 2011, with the AutoCorrelation Spectrometer (ACS) as the backend, four 50 MHz ACS sub-bands, two linear polarizations, and 10-second records. The same frequency settings were used for all four absorbers, with three ACS sub-bands centred on the three redshifted Hi 21cm line frequencies, so as to test for radio frequency interference (RFI). Each ACS sub-band was divided into 8192 spectral channels, yielding a velocity resolution of km s-1 and a total velocity coverage of km s-1 for each absorber. Position switching was used to calibrate the passband shape, with a 10-min. On/Off cycle, while the flux density scale was determined via online system temperature measurements with a blinking noise diode. The total observing time was 9 hours (J1553+3548), 11 hours (J1619+3342) and 33 hours (J1009+0713). Note that more time was spent on the DLA towards J1009+0713 as strong RFI was detected during the observations at MHz, close to its redshifted Hi 21cm line frequency.
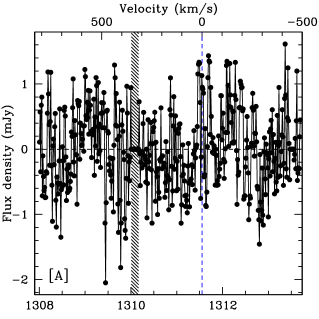
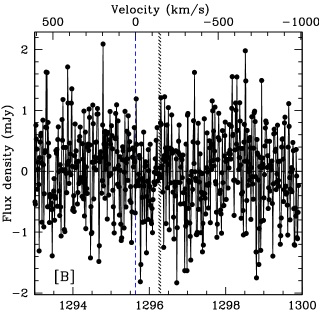
All data were analysed using dish, the aips++ single-dish package. Detailed data editing was necessary, due to the presence of significant amounts of RFI in all datasets as well as ACS failures. This was done via visual inspection of the calibrated dynamic spectra. About 20% of the data had to be edited out for the absorbers towards J1553+3548 and J1619+3342, while the data towards J1009+0713 were entirely unusable. After the data editing, the individual spectra were calibrated, with a second-order baseline fit to each 10-second spectrum and subtracted out. The Hanning-smoothed and re-sampled spectra were then averaged together, to produce a spectrum for each observing epoch. For each source, the spectra from different epochs were shifted to the barycentric frame and then averaged together, using weights based on the root-mean-square (RMS) noise values. The final spectra for the absorbers towards J1553+3548 and J1619+3342 had RMS noise values of mJy per 2.8 km s-1 channel; these are shown in the two top panels of Fig. 1.
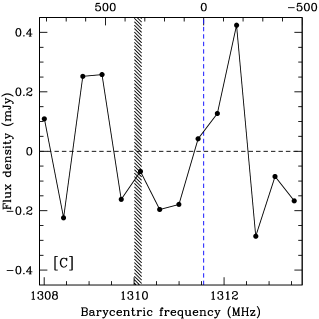
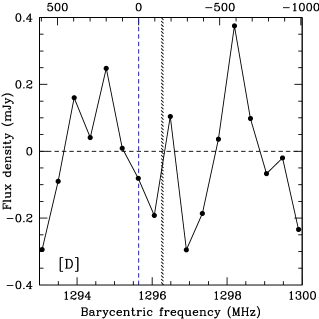
The search for redshifted Hi 21cm emission was carried out after smoothing the spectra to, and re-sampling at, velocity resolutions of , , and km s-1. The lower panels of Fig. 1 show the two Hi 21cm spectra at velocity resolution of km s-1. The grey shaded regions indicate frequency ranges affected by narrow-band RFI, while the dashed vertical line marks the expected redshifted Hi 21cm line frequency. It is clear that there is no evidence for either RFI or Hi 21cm line emission within km s-1 of the expected redshifted line frequencies. The RMS noise values at a velocity resolution of km s-1 are 0.22 mJy (J1553+3548) and 0.19 mJy (J1619+3342).
3 Discussion
| QSO | MHIa | [Z/H]b | Reference | ||
| cm-2 | M⊙ | ||||
| PG 1216+069 | 0.0063 | 0.2 | 1,2,11 | ||
| SBS 1543+543 | 0.009 | 2.2 | 3,4,5 | ||
| SDSS J1553+3548 | 0.0830 | 0.35 | 6,7,8 | ||
| SDSS J1619+3342 | 0.0963 | 3.5 | 6,7,8 | ||
| PKS 0439433 | 0.101 | 0.71 | 9,10 |
(1) Kanekar & Chengalur, 2005; (2) Briggs & Barnes, 2006; (3) Bowen et al., 2001; (4) Chengalur & Kanekar, 2002; (5) Bowen et al., 2005; (6) Meiring et al., 2011; (7) this work; (8) Battisti et al., 2012; (9) Kanekar et al., 2001; (10) Chen et al., 2005; (11) Tripp et al. 2005.
a The Hi masses have been scaled to the CDM cosmology used in this paper, with mass limits quoted at a velocity resolution of km s-1.
The three DLAs and sub-DLAs that were observed with the GBT were discovered via HST-COS ultraviolet spectroscopy of a set of background quasars, selected for studies of gas at entirely different redshifts (Meiring et al., 2011; Tumlinson et al., 2013). The absorber redshifts are well-constrained by both the Ly and associated metal-line transitions to an accuracy better than a few tens of km s-1 (Battisti et al., 2012). The metal-line transitions also enable estimates of the gas-phase elemental abundances, and hence, the absorber metallicities. The three absorbers studied here have metallicities (relative to solar) of [Z/H] , using S or Si abundances, and making appropriate ionization corrections for the sub-DLA towards J1553+3548 (Battisti et al., 2012).
Our GBT non-detections of Hi 21cm line emission can be used to place constraints on the total Hi mass of the two absorbers, using the relation (e.g. Rohlfs & Wilson, 2006)
| (1) |
where MHI (in M⊙) is the Hi mass of the galaxy, is its redshift, (in Mpc) is its luminosity distance111We use a -Cold Dark Matter (CDM) cosmology, with H km s-1 Mpc-1, and (Planck Collaboration, 2013)., and (in Jy km s-1) is the velocity integral of the Hi 21cm line flux density.
For non-detections of Hi 21cm emission, one must assume a velocity distribution for the emitting gas to derive limits on the Hi mass. Note that, for a given Hi mass, a galaxy with a narrower Hi 21cm emission profile would yield a lower peak line flux density. We will assume the Hi 21cm emission profiles to be Gaussian, with a line full-width-at-half-maximum km s-1. This yields upper limits of Jy km s-1 (J1553+3548) and Jy km s-1 (J1619+3342) on the integrated Hi 21cm line flux density, and MHI M⊙ (J1553+3548) and MHI M⊙ (J1619+3342) on the Hi masses of the two absorbers.
Table 1 summarizes our current knowledge of the atomic gas masses of low- DLAs and sub-DLAs. The sample consists of five systems, two DLAs and three sub-DLAs. Hi 21cm emission has been detected in only two objects, the sub-DLA towards PG 1216+069 (Briggs & Barnes, 2006) and the DLA towards SBS 1549+543 (Bowen et al., 2001). Table 1 also lists the Hi column densities of the absorbers and (when available) their metallicities and velocity widths.
It is clear from Table 1 that the inferred Hi masses or limits on the Hi mass are in all cases significantly lower (by a factor of at least a few) than the Hi mass at the knee of the Schechter function that provides a good fit to the Hi mass distribution of galaxies in the local Universe, log[M (Martin et al., 2010), using H km s-1 Mpc-1. Thus, although the number of damped systems that have so far been searched for Hi 21cm emission is still quite small, the present data indicate that low-redshift DLAs and sub-DLAs do not typically arise in massive, gas-rich galaxies.
It is interesting to compare our results with the predictions of Zwaan et al. (2005) for the typical Hi mass of low- DLAs. Zwaan et al. (2005) used Westerbork Synthesis Radio Telescope Hi 21cm emission images of a large sample of nearby galaxies to test whether high- DLAs might arise in galaxies with gas distributions similar to that in the galaxy population. They found both the incidence rate, and the distribution of impact parameters and Hi column densities, of low- DLAs to be consistent with a scenario in which the absorbers arise in the local galaxy population. The median DLA is expected to arise in an low-luminosity (L*/7) galaxy, with an Hi mass of M⊙. While high-mass DLAs do contribute significantly to the cross-section, it is the highest Hi column densities that tend to arise in the most massive galaxies. Comparing with our results, it is clear from Table 1 that the five DLAs and sub-DLAs at that have so far been searched for Hi 21cm emission all have low values, cm-2, and low Hi masses, M⊙. Our results are thus entirely consistent with the predictions of Zwaan et al. (2005). It would be interesting to search for Hi 21cm emission from low- DLAs with high Hi column densities, for which Zwaan et al. (2005) expect the cross-section to be dominated by massive galaxies.
There have been suggestions in the literature that sub-DLAs (also known as super-Lyman limit systems, with cm-2 cm-2) arise in galaxies that are systematically more massive than the galaxies that give rise to DLAs (e.g. Khare et al., 2007; Kulkarni et al., 2010, but see Dessauges-Zavadsky et al., 2009). We emphasize that the three sub-DLAs of Table 1 also have low Hi masses, , contradicting the above arguments. Of course, our conclusion is tempered by sample variance and must be tested with a much larger survey.
Finally, the metallicity of DLAs is known to show a correlation with the velocity width of unsaturated low-ionization metal lines (Wolfe & Prochaska, 1998; Ledoux et al., 2006), as well as with the rest equivalent width of saturated metal lines (Prochaska et al., 2008). These correlations have usually been interpreted in terms of a mass-metallicity relation in the absorbers (e.g. Ledoux et al., 2006; Møller et al., 2013; Neeleman et al., 2013), similar to the mass-metallicity relation that has been found in high- emission-selected galaxies (e.g. Tremonti et al., 2004; Erb et al., 2006; Maiolino & et al., 2008). Three of the absorbers of Table 1 have high metallicities, [Z/H] , in the top 10% of DLA metallicities at all redshifts (e.g. Rafelski et al., 2012). It is interesting that all three of these high-metallicity absorbers show low Hi masses, M M⊙. We thus find that absorbers with high metallicities do not necessarily have high gas masses, in apparent contradiction with the putative mass-metallicity relation. However, it should be emphasized that the metallicity estimates only probe a pencil beam through the three galaxies; testing the mass-metallicity relation would require a larger sample. Further, the mass-metallicity relation for emission-selected galaxies involves the stellar mass while that for DLAs involves the virial mass (dominated by dark matter), neither of which can be immediately linked to the gas mass.
In summary, we have carried out a deep GBT search for redshifted Hi 21cm emission from three DLAs and sub-DLAs at . Our GBT non-detections of Hi 21cm emission yield tight constraints on the Hi mass of two absorbers, MHI M⊙ for the sub-DLA towards J1553+3548, and MHI M⊙ for the DLA towards J1619+3342. The data on the third absorber, at towards J1009+0713, was rendered unusable by strong RFI close to the redshifted Hi 21cm line frequency. Our results are consistent with a scenario in which most low-Hi column density DLAs and sub-DLAs at low redshifts do not arise in massive gas-rich galaxies.
Acknowledgements
PM acknowledges support from the NCRA-TIFR Visiting Students’ Research Programme, and NK from the Department of Science and Technology through a Ramanujan Fellowship. JXP is partly supported by NSF grant AST-1109447. The NRAO is a facility of the National Science Foundation operated under cooperative agreement by Associated Universities, Inc.. We thank an anonymous referee for a careful reading of an earlier version of this paper.
References
- Battisti et al. (2012) Battisti A. J., Meiring J. D., Tripp T. M., Prochaska J. X., Werk J. K., Jenkins E. B., Lehner N., Tumlinson J., Thom C., 2012, ApJ, 744, 93
- Bowen et al. (2001) Bowen D. V., Huchtmeier W., Brinks E., Tripp T. M., Jenkins E. B., 2001, A&A, 372, 820
- Bowen et al. (2005) Bowen D. V., Jenkins E. B., Pettini M., Tripp T. M., 2005, ApJ, 635, 880
- Briggs & Barnes (2006) Briggs F. H., Barnes D. G., 2006, ApJ, 640, L127
- Chen et al. (2005) Chen H.-W., Kennicutt Jr. R. C., Rauch M., 2005, ApJ, 620, 703
- Chengalur & Kanekar (2002) Chengalur J. N., Kanekar N., 2002, A&A, 388, 383
- Dessauges-Zavadsky et al. (2009) Dessauges-Zavadsky M., Ellison S. L., Murphy M. T., 2009, MNRAS, 396, L61
- Dessauges-Zavadsky et al. (2006) Dessauges-Zavadsky M., Prochaska J. X., D’Odorico S., Calura F., Matteucci F., 2006, A&A, 445, 93
- Erb et al. (2006) Erb D. K., Shapley A. E., Pettini M., Steidel C. C., Reddy N. A., Adelberger K. L., 2006, ApJ, 644, 813
- Fumagalli et al. (2010) Fumagalli M., O’Meara J. M., Prochaska J. X., Kanekar N., 2010, MNRAS, 408, 362
- Haehnelt et al. (1998) Haehnelt M. G., Steinmetz M., Rauch M., 1998, ApJ, 495, 64
- Kanekar & Chengalur (2001) Kanekar N., Chengalur J. N., 2001, A&A, 369, 42
- Kanekar & Chengalur (2003) Kanekar N., Chengalur J. N., 2003, A&A, 399, 857
- Kanekar & Chengalur (2005) Kanekar N., Chengalur J. N., 2005, A&A, 429, L51
- Kanekar et al. (2001) Kanekar N., Chengalur J. N., Subrahmanyan R., Petitjean P., 2001, A&A, 367, 46
- Kanekar et al. (2014) Kanekar N., Prochaska J. X., Smette A., Ellison S. L., Ryan-Weber E. V., Momjian E., Briggs F. H., Lane W. M., Chengalur J. N., Delafosse T., Grave J., Jacobsen D., de Bruyn A. G., 2014, MNRAS, 438, 2131
- Kanekar et al. (2009) Kanekar N., Smette A., Briggs F. H., Chengalur J. N., 2009, ApJ, 705, L40
- Kanekar et al. (2006) Kanekar N., Subrahmanyan R., Ellison S. L., Lane W. M., Chengalur J. N., 2006, MNRAS, 370, L46
- Khare et al. (2007) Khare P., Kulkarni V. P., Péroux C., York D. G., Lauroesch J. T., Meiring J. D., 2007, A&A, 464, 487
- Krogager et al. (2012) Krogager J.-K., Fynbo J. P. U., Møller P., Ledoux C., Noterdaeme P., Christensen L., Milvang-Jensen B., Sparre M., 2012, MNRAS, 424, L1
- Kulkarni et al. (2010) Kulkarni V. P., Khare P., Som D., Meiring J., York D. G., Péroux C., Lauroesch J. T., 2010, New Astronomy, 15, 735
- le Brun et al. (1997) le Brun V., Bergeron J., Boissé P., Deharveng J.-M., 1997, A&A, 321, 733
- Ledoux et al. (2006) Ledoux C., Petitjean P., Fynbo J. P. U., Møller P., Srianand R., 2006, A&A, 457, 71
- Ledoux et al. (2003) Ledoux C., Petitjean P., Srianand R., 2003, MNRAS, 346, 209
- Maiolino & et al. (2008) Maiolino R., et al. 2008, A&A, 488, 463
- Martin et al. (2010) Martin A. M., Papastergis E., Giovanelli R., Haynes M. P., Springob C. M., Stierwalt S., 2010, ApJ, 723, 1359
- Meiring et al. (2011) Meiring J. D., Tripp T. M., Prochaska J. X., Tumlinson J., Werk J., Jenkins E. B., Thom C., O’Meara J. M., Sembach K. R., 2011, ApJ, 732, 35
- Møller et al. (2013) Møller P., Fynbo J. P. U., Ledoux C., Nilsson K. K., 2013, MNRAS, 430, 2680
- Neeleman et al. (2013) Neeleman M., Wolfe A. M., Prochaska J. X., Rafelski M., 2013, ApJ, 769, 54
- Noterdaeme et al. (2008) Noterdaeme P., Ledoux C., Petitjean P., Srianand R., 2008, A&A, 481, 327
- Noterdaeme et al. (2009) Noterdaeme P., Petitjean P., Ledoux C., Srianand R., 2009, A&A, 505, 1087
- O’Meara et al. (2007) O’Meara J. M., Prochaska J. X., Burles S., Prochter G., Bernstein R. A., Burgess K. M., 2007, ApJ, 656, 666
- Péroux et al. (2012) Péroux C., Bouché N., Kulkarni V. P., York D. G., Vladilo G., 2012, MNRAS, 419, 3060
- Planck Collaboration (2013) Planck Collaboration 2013, arxiv:1303.5076
- Prochaska et al. (2008) Prochaska J. X., Chen H.-W., Wolfe A. M., Dessauges-Zavadsky M., Bloom J. S., 2008, ApJ, 672, 59
- Prochaska et al. (2003) Prochaska J. X., Gawiser E., Wolfe A. M., Castro S., Djorgovski S. G., 2003, ApJ, 595, L9
- Prochaska et al. (2005) Prochaska J. X., Herbert-Fort S., Wolfe A. M., 2005, ApJ, 635, 123
- Prochaska & Wolfe (1997) Prochaska J. X., Wolfe A. M., 1997, ApJ, 487, 73
- Rafelski et al. (2012) Rafelski M., Wolfe A. M., Prochaska J. X., Neeleman M., Mendez A. J., 2012, ApJ, 755, 89
- Rao et al. (2003) Rao S. M., Nestor D. B., Turnshek D. A., Lane W. M., Monier E. M., Bergeron J., 2003, ApJ, 595, 94
- Rohlfs & Wilson (2006) Rohlfs K., Wilson T. L., 2006, Tools of Radio Astronomy, 4th ed.. Berlin: Springer
- Tremonti et al. (2004) Tremonti C. A., Heckman T. M., Kauffmann G., Brinchmann J., Charlot S., White S. D. M., Seibert M., Peng E. W., Schlegel D. J., Uomoto A., Fukugita M., Brinkmann J., 2004, ApJ, 613, 898
- Tripp et al. (2005) Tripp T. M., Jenkins E. B., Bowen D. V., Prochaska J. X., Aracil B., Ganguly R., 2005, ApJ, 619, 714
- Tumlinson et al. (2013) Tumlinson J., Thom C., Werk J. K., Prochaska J. X., Tripp T. M., Katz N., Davé R., Oppenheimer B. D., Meiring J. D., Ford A. B., O’Meara J. M., Peeples M. S., Sembach K. R., Weinberg D. H., 2013, ApJ, 777, 59
- Wiklind & Combes (1994) Wiklind T., Combes F., 1994, A&A, 286, L9
- Wolfe & Prochaska (1998) Wolfe A. M., Prochaska J. X., 1998, ApJ, 494, L15
- Zwaan et al. (2005) Zwaan M. A., van der Hulst J. M., Briggs F. H., Verheijen M. A. W., Ryan-Weber E. V., 2005, MNRAS, 364, 1467