Measurements and optimization of the light yield of a TeO2 crystal
Abstract
Bolometers have proven to be good instruments to search for rare processes because of their
excellent energy resolution and their extremely low intrinsic background.
In this kind of detectors, the capability of discriminating particles from electrons
represents an important aspect for the background reduction.
One possibility for obtaining such a discrimination is provided by the detection of the Čerenkov
light which, at the low energies of the natural radioactivity, is only emitted by electrons.
This paper describes the method developed to evaluate the amount of light
produced by a crystal of when hit by a 511 keV photon.
The experimental measurements
and the results of a detailed simulation of the crystal and the readout system
are shown and compared.
A light yield of about 52 Čerenkov photons per deposited MeV was measured.
The effect of wrapping the crystal with a PTFE layer, with the aim
of maximizing the light collection, is also presented.
keywords:
Bolometers; Čerenkov light1 Introduction
Tellurium dioxide () crystals have proven to be superb bolometers for the search of neutrino-less double beta decay [1, 2, 3]. They are able to measure energies in the MeV region with a resolution of the order of few keV. One of the main sources of background in these searches is represented by the particles emitted by natural radioactivity. As predicted in [4] and demonstrated in [5, 6], the observation of light emitted by electrons in a bolometer can provide a powerful tool to disentangle from radiation. According to [7], the detected light is compatible with the Čerenkov emission and the absence of the contribution of scintillation light has been demonstrated in [8]. The aims of the experiment presented in this paper are the evaluation of the number of Čerenkov photons emitted by the crystal and the study of the effect on the light collection of wrapping the crystal with a diffusive material.
2 Experimental set-up
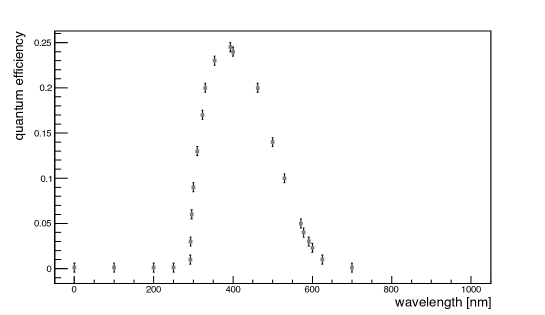
A cm3 crystal of was placed in a light tight box. In order to cross check the obtained results, the crystal was read out on two opposite faces by two photo-multipliers (PMTs) (see Fig.7). Since the emitted light is expected to be due to Čerenkov photons, a good sensitivity in the ultraviolet region is needed to maximize the light collection. For this reason, two Hamamatsu R1924A PMTs were chosen. The 22 mm diameter window in borosilicate glass provides these PMTs with a quantum efficiency larger than 10% between 300 nm and 550 nm, with a peak of about 25% around 400 nm as shown in Fig.1. The PMTs were operated at 1200 V with a nominal gain of about 107.
The signals provided by the PMTs were acquired by an oscilloscope with a bandwidth of 300 MHz and a sampling frequency of 10 GS/s.
3 Calibration of the photo-multipliers
A first step, needed to measure the absolute light yield of the crystal, is the calibration of the PMT response. In particular, the evaluation of the charge provided for a single photo-electron (p.e.) is required. In order to perform this measurement, the light produced by a LED was sent to the PMT by means of an optical fiber. A rectangular electric pulse, 60 ns wide, was used to drive the LED and to simultaneously trigger the oscilloscope acquisition. A diaphragm placed upstream of the optical fiber allowed to regulate the amount of light reaching the PMT window.
3.1 Measurements with open diaphragm
With the diaphragm wide open the average PMT waveform shown in Fig. 2 is obtained (the 0 of the time axis is arbitrary).
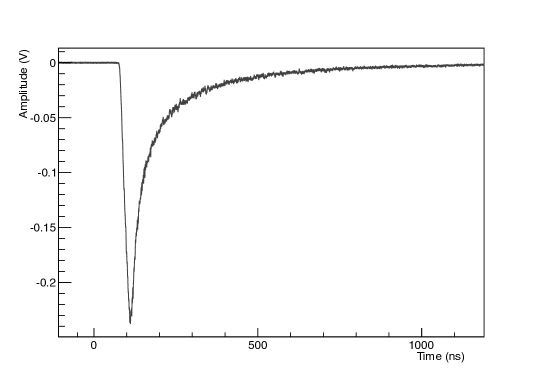
Fig. 3 shows the charge spectrum obtained by integrating event by event the charge produced by the PMT in a 1 s time window before the trigger (left) and after the trigger (right).

A Gaussian fit to the distributions allows to extract the values of the fluctuations due to the electronics () and the total one (). The value of the fluctuation of the charge signal () can be obtained as:
and results to be pC.
In the hypothesis that is mainly due to the statistical variation of the total number of photo-electrons () and that this number follows a Poisson distribution the value of can be calculated as:
being pC the average value of signal charge spectrum (Fig. 3, right). It results that, in this configuration, is , so that, the charge produced by each single p.e. () is about pC.
3.2 Measurements with almost closed diaphragm
To check the obtained results, a direct measurement of the charge produced by a single photo-electron was performed. The diaphragm was almost completely closed in order to reduce the amount of photons reaching the PMT. In some events, one or, very rarely, more than one peaks as the one shown in Fig.4 are visible. Very likely these peaks are signals produced by a single photon converted in an electron on the PMT photo-cathode.
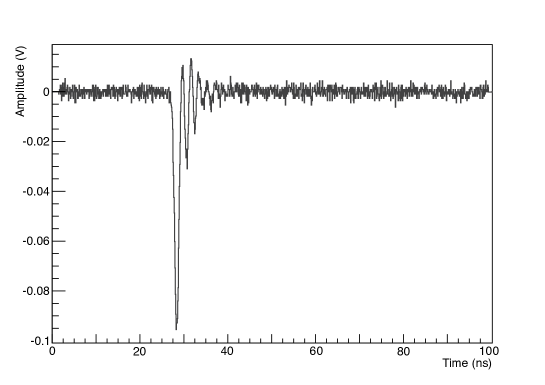
In order to check this hypothesis the distribution of the number of peaks per event is studied. Each acquired waveform is analyzed and the number of times the signal exceeds a threshold is counted. The threshold value is optimized by studying the behavior of the noise before the trigger. A time distance of at least 15 ns was required between two peaks in order to avoid multiple counting of the same signal due to the oscillations after the first peak (see Fig. 4).
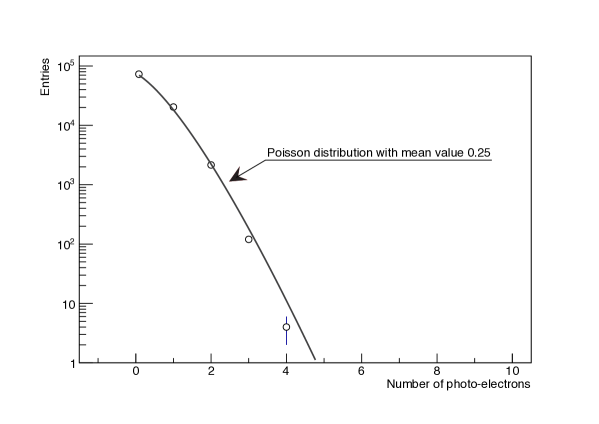
As it is shown in Fig. 5 this quantity follows a Poisson distribution as the number of photo-electrons is expected to.
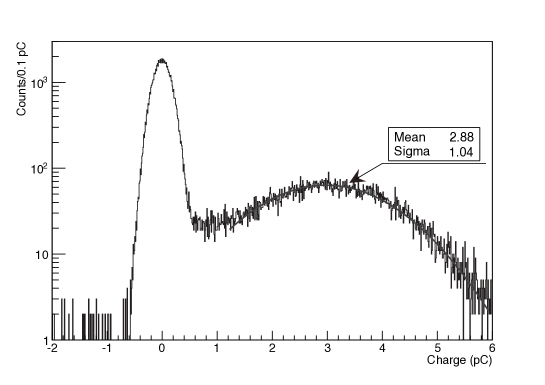
Moreover, a Gaussian fit to the distribution of the charge integrated in a 10 ns time gate around the peak (2 ns before and 8 ns after the maximum amplitude) returns a value of pC (Fig. 6) that is in very good agreement with the one found in 3.1. It is therefore possible to conclude that these peaks are signals due to single photo-electrons and to confirm that 2.88 pC is the corresponding charge. The same calibration performed on the opposite PMT gives a value of about 2.70 pC.
4 Light yield measurement
In order to measure the absolute light yield of the crystal the set-up shown in Fig. 7 was prepared. The idea is to measure the number of photo-electrons provided by the PMT for a given value of energy released in the crystal.
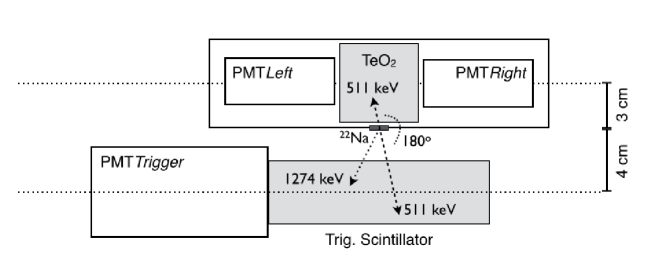
A 22Na source was placed on one side of the black box, exposed towards a plastic scintillator. The signal of the scintillator PMT was sent to the oscilloscope, used as trigger and acquired. The source in use emits two back-to-back 511 keV photons, and, simultaneously, a 1274 keV photon, uncorrelated in space. Given the geometry of the system, in the triggered events one of the two 511 keV photons always reaches the crystal. In order to select events where only the 511 keV photon reaches the crystal the threshold on the trigger signal was tuned to select the events where the 1274 keV photon hits the trigger scintillator.
From the comparison of the results obtained in runs with and without the 22Na source it was evaluated that about 10% of triggers were due to noise in the trigger PMT.
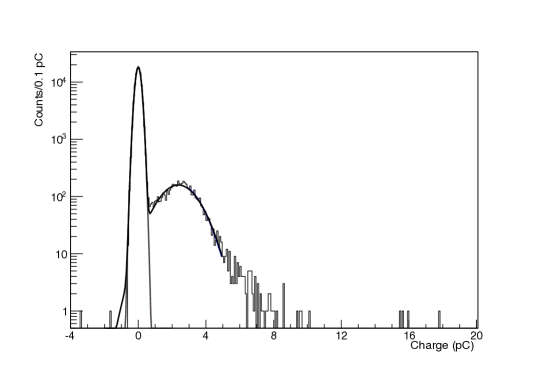
The response spectrum of the crystal in a standard run is represented in Fig. 8 with a superimposed double Gaussian fit.
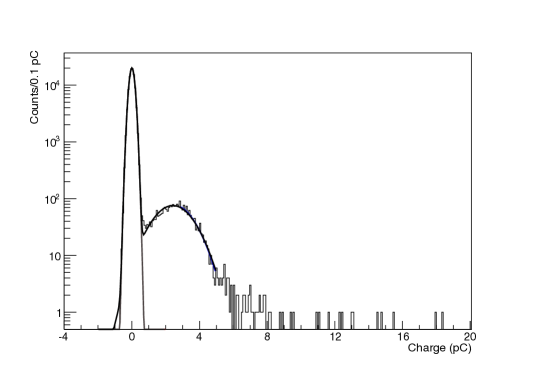
It shows a narrow peak around 0, a large peak around 1 photo-electron and a small tail for higher values. Since the number of produced photo-electrons is expected to follow a Poisson distribution, if P() is the probability of detecting photo-electrons, the average number of collected photo-electrons is given by:
| (1) |
where P(0) and P(1) are evaluated from the results of the fit, after subtracting the noise contribution.
The values of were calculated for the two PMTs and were found to be: and .
5 Monte Carlo simulation
A Monte Carlo simulation of the Čerenkov radiation produced by the 511 keV photon interactions with the crystal and their propagation in the experimental set-up was performed. The simulation is divided in two parts:
-
•
in the first part the total amount of Čerenkov photons for each interaction is evaluated;
-
•
in the second part the propagation of the Čerenkov photons inside the different components of the experimental set-up is reproduced by means of Litrani [11], a software developed to simulate the propagation of the optical photons in any type of optical media and able to model the response of the photo-multipliers.
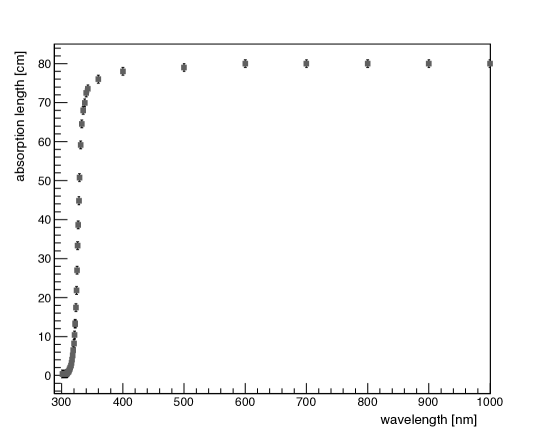
The optical properties required by Litrani to reproduce the propagation of the optical photons within the crystal are the ordinary and extraordinary refractive index and the absorption length. While the refractive indices were taken from [12], the absorption length was measured at room temperature and the result is shown in Fig. 9.
The light diffusion due to the surface properties of the crystal is taken into account in the simulation. The two faces in front of the PMTs were simulated to have a high polishing quality, close to optical polishing grade, while the other four were simulated with higher roughness.
The photo-cathode quantum efficiency (Fig. 1) and the refractive index of the borosilicate window of the PMT are taken into account by Litrani.
The simulation starts with the emission of photons with an energy of 511 keV, from a point-like source located at 5 mm from the crystal with an isotropic angular distribution inside the solid angle covered by the trigger scintillator (see Fig. 7). The energy deposition in the crystal for each interaction is shown in Fig. 10.
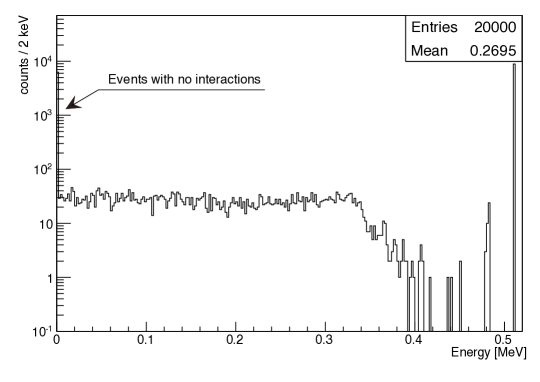
According to the simulation, given the geometry, in about 31% of triggered events the 511 keV photon crossing the crystal does not interact with it, and the average energy released within the crystal is about 0.269 MeV. For each interaction within the crystal, the total number of Čerenkov photons with a wavelength in the range nm is evaluated and its distribution is shown in Fig. 11.
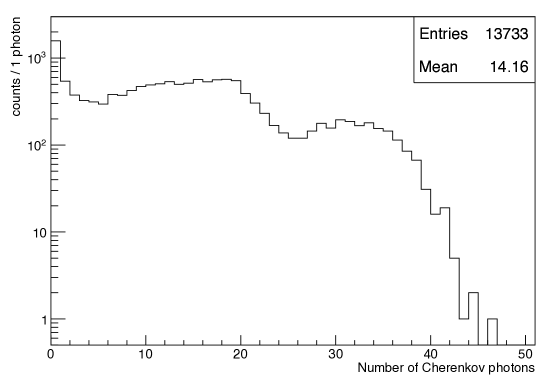
Since the Čerenkov threshold for an electron in crystal is about 50 keV [4] the probability of having zero emitted Čerenkov photons was found to be about 12.1%.
The peak around 30 photons is due to photo-electric effect within the crystal with a release of the whole energy (511 keV) within it. The shoulder between 10 and 20 photons is instead due to single or multiple Compton scattering.
From the ratio between the average number of produced photons and the mean energy released, a value of about 52 Čerenkov photons per MeV released can be calculated.
By means of Litrani the photons are thus simulated inside the experimental set-up. The number of photons detected by the PMTs was found to be = in good agreement with the measured one representing a good validation of the adopted simulation method.
6 Light yield optimization
6.1 Experimental measurements
In order to maximize the amount of light collection in the PMTs, all the crystal faces were wrapped with Polytetrafluoroethylene (PTFE), a white and diffusive material. The measured response spectrum is shown in Fig. 12.
By means of the formula 1 the average number of photo-electrons were computed and found to be = and =.
The use of the PTFE on all faces of the crystal is able to increase by a factor 2.4 the number of photo-electrons detected.
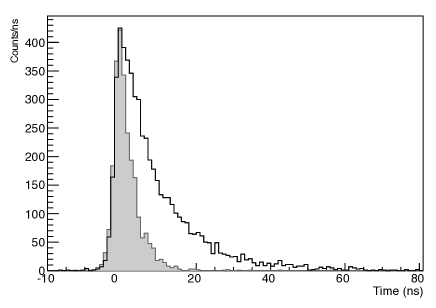
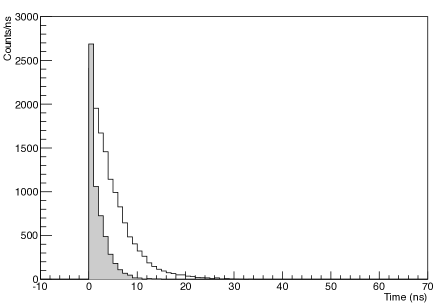
An important aspect is that the signal arrival time distribution (Fig. 13) shows a large tail on high values when the crystal is wrapped. This confirms that the light yield increase is due to photons that are reflected and diffused by the wrapping and travel up to ns before reaching the PMT instead of exiting the crystal from the lateral faces.
 |
6.2 Monte Carlo simulation
The effects of the PTFE wrapping were also studied by means of dedicated simulations. The number of photoelectrons was found to be: = in very good agreement with the experimental data.
Also the simulation results show (Fig. 14) that, thanks to the reflection on the wrapping, several photons that would have been lost are instead driven toward the PMTs and are detected after having traveled for up to 30 ns.
The smaller tail for large times that is found in the simulation can be explained with the time jitter of the PMT that was not taken into account in the simulation.
7 Conclusion
The amount of light produced by a TeO2 crystal exposed to the 511 keV photons produced by a 22Na radioactive source was measured by means of two PMTs. Without any wrapping, an average value of 0.0150.016 photo-electrons was measured (i.e. about 0.055 p.e./MeV). By means of a Monte Carlo simulation, it was possible to derive that the number of primary Čerenkov photons produced per MeV released in the crystal is about 52. The effect of a reflective and diffusive wrapping was studied. The most promising result was obtained by covering all lateral faces with PTFE, that allowed to increase the number of photons reaching the PMTs by a factor 2.4.
References
- [1] C. Arnaboldi et al., “CUORE: a cryogenic underground observatory for rare events,” Nucl. Instrum. Meth. A 518 775 (2004).
- [2] E. Andreotti et al., “130Te neutrinoless double-beta decay with CUORICINO,” Astropart. Phys. 34 822 (2011).
- [3] D. Artusa, et al., (CUORE Collaboration), “Searching for neutrinoless double-beta decay of 130Te with CUORE”, submitted (2014).
- [4] T. Tabarelli de Fatis, “Cherenkov emission as a positive tag of double beta decays in bolometric experiments,” Eur. Phys. J. C 65 (2010) 359.
- [5] J. W. Beemanet al., “Discrimination of alpha and beta/gamma interactions in a TeO2 bolometer,” Astropart. Phys. 35, 558 (2012).
- [6] N. Casali, et al.,“TeO2 bolometers with Cherenkov signal tagging: towards next-generation neutrinoless double beta decay experiments,” arXiv:1403.5528 [physics.ins-det].
- [7] F. Bellini et al., “Measurements of the Cherenkov light emitted by a TeO2 crystal,” JINST 7 (2012) P11014.
- [8] N. Casali et al., “Monte Carlo simulation of the Cherenkov radiation emitted by crystal when crossed by cosmic muons” Nucl. Instrum. Meth. A http://dx.doi.org/10.1016/j.nima.2013.07.024.
- [9] S. Agostinelli et al., Nucl. Instrum. Meth. A 506, (2003) 250.
- [10] J. Allison et al., IEEE Transactions on Nuclear Science 53 No. 1 (2006) 270-278.
- [11] François Xavier Gentit, “Litrani: A general purpose Monte Carlo program simulating light propagation in isotropic or anisotropic media” Nucl. Instrum. Meth. A 486 (2002) 35.
- [12] N. Uchida, “Optical properties of single-crystal paratellurite (TeO2)”, Phys. Rev.B 4, 3736-3745 (1971).