Dynamical structure of the inner 100 AU of the deeply embedded protostar IRAS 16293-2422
Abstract
A fundamental question about the early evolution of low-mass protostars is when circumstellar disks may form. High angular resolution observations of molecular transitions in the (sub)millimeter wavelength windows make it possible to investigate the kinematics of the gas around newly-formed stars, for example to identify the presence of rotation and infall. IRAS16293-2422 was observed with the extended Submillimeter Array (eSMA) resulting in subarcsecond resolution (0.46 0.29, i.e. 55 35 AU) images of compact emission from the C17O (3-2) and C34S (7-6) transitions at 337 GHz (0.89 mm). To recover the more extended emission we have combined the eSMA data with SMA observations of the same molecules. The emission of C17O (3-2) and C34S (7-6) both show a velocity gradient oriented along a northeast-southwest direction with respect to the continuum marking the location of one of the components of the binary, IRAS16293A. Our combined eSMA and SMA observations show that the velocity field on the 50–400 AU scales is consistent with a rotating structure. It cannot be explained by simple Keplerian rotation around a single point mass but rather needs to take into account the enclosed envelope mass at the radii where the observed lines are excited. We suggest that IRAS 16293-2422 could be among the best candidates to observe a pseudo-disk with future high angular resolution observations.
1 Introduction
| SetaaSet 1 was centered on coordinates ( = 16h32m22898, = -24283550). Sets 2 and 3 were centered on coordinates ( = 16h32m22719, = -24283430). | Array | Observed | Rest | Spectral | Synthesized | Flux | |
| Date | Frequency | Resolution | Beam | Conversion | |||
| (GHz) | (km s-1) | ( ) | PA () | (K/(Jy beam-1)) | |||
| (1) | (2) | (3) | (4) | (5) | (6) | (7) | (8) |
| 1 | eSMA | 2009 March 22 | 337.671 | 0.72 | 0.46 0.29 | 52 | 80 |
| 2 | SMAbbJørgensen et al. (2011). | 2007 March 22 | 337.397 | 0.72 | 2.8 1.0 | 52 | 3.7 |
| 3 | SMA eSMA | – | – | 0.72 | 0.59 0.38 | 48 | 48 |
One of the key question in studies of star and planet formation is when and how disk formation occurs. The formation of a circumstellar disk, which will potentially result in planet formation, takes place during the rotating collapse of a dense pre-stellar core. Indeed, pure rotation accompanying collapse will give rise to a centrifugal disk, initially of low mass, evolving and growing with time (Terebey et al., 1984). At the same time, the presence of a magnetic field can lead to the formation of a pseudo-disk around a young stellar object. The circumstellar disk is a product of relatively simple dynamics whereas the magnetic pseudo-disk arises through a magnetic pinch around a young stellar object (Basu, 1998; Hennebelle & Ciardi, 2009; Dapp & Basu, 2010; Davidson et al., 2011; Galli & Shu, 1993a, b). A magnetic pseudo-disk grows continually as material is accreted and it can be much more massive and larger in the early stage of formation and evolution than the pure rotation disk (e.g. Basu, 1998). Such types of magnetic pseudo-disks have already been observed towards Class 0 young stellar objects (e.g. L1527 and IC3480-SMM2, Davidson et al., 2011; Ohashi et al., 1997) and Class I sources (e.g. L1551 IRS 5 and HL Tau, Momose et al., 1998; Takakuwa et al., 2004; Lim & Takakuwa, 2006; Hayashi et al., 1993). Observational studies of the kinematics of low-mass protostars can quantify the importance of rotation and magnetically modified infall, giving considerable insight into the structure of Class 0 protostars and early disk formation in protostellar objects.
The well–studied deeply embedded low-mass protostar IRAS 16293-2422, which lies at a distance of 120 pc (de Geus et al., 1989; Knude & Høg, 1998; Loinard et al., 2008) in the nearby L1689N cloud located in the Ophiuchus cloud complex, is a potential source to undertake a kinematic study. Two related components A and B (Wootten, 1989; Walker et al., 1993), hereafter IRAS16293A and IRAS16293B, separated by 5 (600 AU ; Mundy et al., 1992) are associated with this system. Although the nature of IRAS16293A as a protostellar object (Class 0) is commonly agreed upon, that of IRAS16293B is still debated: it could be a T Tauri star or an even younger protostellar object (Class 0/I or candidate first hydrostatic core, e.g. Stark et al., 2004; Chandler et al., 2005; Takakuwa et al., 2007; Rao et al., 2009; Pineda et al., 2012; Loinard et al., 2013; Zapata et al., 2013). The understanding of this region has been improved by high spatial resolution interferometric observations of complex molecules including organic and prebiotic species for astrochemical studies and of simple species for dynamic and kinematic studies (Kuan et al., 2004; Huang et al., 2005; Chandler et al., 2005; Bottinelli et al., 2004; Takakuwa et al., 2007; Bisschop et al., 2008; Jørgensen et al., 2011, 2012; Pineda et al., 2012). In the present paper, we focus on the latter aspect.
The structure of the protostar IRAS 16293-2422 is complicated by the presence of infalling gas inside the circumstellar envelop (Walker et al., 1986; Narayanan et al., 1998; Ceccarelli et al., 2000; Chandler et al., 2005; Takakuwa et al., 2007), as well as two outflows: one driven by IRAS16293A which is oriented in an east–west direction (e.g. CO and SO observations, see Mundy et al., 1992; Yeh et al., 2008; Jørgensen et al., 2011) and a second that is oriented in a northeast-southwest direction (Walker et al., 1988; Mizuno et al., 1990; Hirano et al., 2001; Castets et al., 2001; Garay et al., 2002; Stark et al., 2004). Likewise, rotating material has also been observed towards this protostar (e.g 13CO, SiO and C18O observations see, Mundy et al., 1986; Menten et al., 1987; Mundy et al., 1990; Zhou, 1995; Schöier et al., 2004; Huang et al., 2005; Remijan & Hollis, 2006). These studies have shown that the high angular resolution obtained with interferometers is required for detailed studies of the kinematics of low-mass protostars.
In this paper we investigate the kinematics of the molecular gas toward IRAS16293A with high angular resolution interferometric observations of carbon monoxide and monosulfide isotopologues (C17O and C34S, respectively). In Sect. 2, we present our Submillimeter Array (SMA, Ho et al., 2004) and extended SMA (eSMA, Bottinelli et al., 2008) data. A description of the data reduction and methodology used for combining these results is also given in this section. The basics results and the data analysis are presented in the sections 3 and 4, respectively. The different scenarios which can explain the observed characteristics of the observations are discussed in Sect. 4 with conclusions in Section 5.
2 Observations
2.1 Extended SMA (eSMA) observations of carbon monoxide and monosulfide
Observations of IRAS 16293-2422 were carried out with the eSMA on 2009 March 22 for 3.4 hours on source in single linear polarization mode. The eSMA combines the SMA array (8 antennas of 6m), the James Clerk Maxwell Telescope (JCMT111The James Clerk Maxwell Telescope is operated by the Joint Astronomy Centre on behalf of the Science and Technology Facilities Council of the United Kingdom, the National Research Council of Canada, and (until 31 March 2013) the Netherlands Organisation for Scientific Research., 15m) and the Caltech Submillimeter Observatory (CSO222The Caltech Submillimeter Observatory is operated by Caltech under cooperative agreement with the National Science Foundation (AST-0838261)., 10.4m) single-dish telescopes, yielding enhanced sensitivity and higher spatial resolution than the SMA alone. The eSMA data presented in this study cover one spectral setup at 337 GHz (see set 1 in Table 1). The phase-tracking centre was = 16h32m22898, = -24283550. The correlator was configured for a single sideband, with a uniform spectral resolution over 2 GHz bandwidth divided into 24 “chunks”, each of 104 MHz width and resulting in 128 channels. The weather conditions were good and stable and we estimate that the atmospheric opacity was 0.05-0.06. Table 1 presents the main parameters of the data (set 1).
In this paper, we focus only on emission lines of the carbon monoxide isotopologue C17O (3-2) and the carbon monosulfide isotopologue C34S (7-6). Table 2 lists the spectroscopic parameters of these transitions. To recover more extended emission we have combined the eSMA data (minimum baseline length of 32k) with observations of the same lines from the SMA in its compact configuration (minimum baseline length of 11k, see Jørgensen et al., 2011, and set 2 in Table 1). Our combined eSMA and SMA observations are therefore not sensitive to structure extended on scales larger than 17 (see Wilner & Welch, 1994).
| MoleculeaaAll spectroscopic data from CO and CS isotopologues available from the CDMS molecular line catalog (Müller et al., 2001, 2005) through the Splatalogue (www.splatalogue.net, Remijan et al., 2007) portal and are based on laboratory measurements and model predictions by Klapper et al. (2003); Cazzoli et al. (2002); Goorvitch (1994); Winkel et al. (1984); Ram (1995); Burkholder et al. (1987); Gottlieb et al. (2003); Ahrens & Winnewisser (1999); Kim & Yamamoto (2003); Bogey et al. (1982, 1981). | Frequency | Transition | Si,j2 | Eu |
|---|---|---|---|---|
| (MHz) | (D2) | (K) | ||
| C17O | 337061.123 | 3 - 2 | 0.01 | 32.35 |
| C34S | 337396.459 | 7 - 6 | 25.57 | 50.23 |
2.2 Data Reduction
The eSMA data were calibrated and reduced using the MIR/IDL package333https://www.cfa.harvard.edu/cqi/mircook.html (Qi, 2007). The nearby quasars 1626-298 and nrao530 (measured flux density of 1.3 Jy and 1.5 Jy, respectively) were used as phase and amplitude calibrators. The absolute flux calibration and the band-pass calibration were performed through observations of the quasar 3C273, with an assumed flux of (10.31.5) Jy, found by interpolating values obtained from the SMA calibrator list444http://sma1.sma.hawaii.edu/callist/callist.html during the period February to April 2009. For details about the reduction of the SMA data see Jørgensen et al. (2011). The coverage of these datasets are shown in Fig. 1.
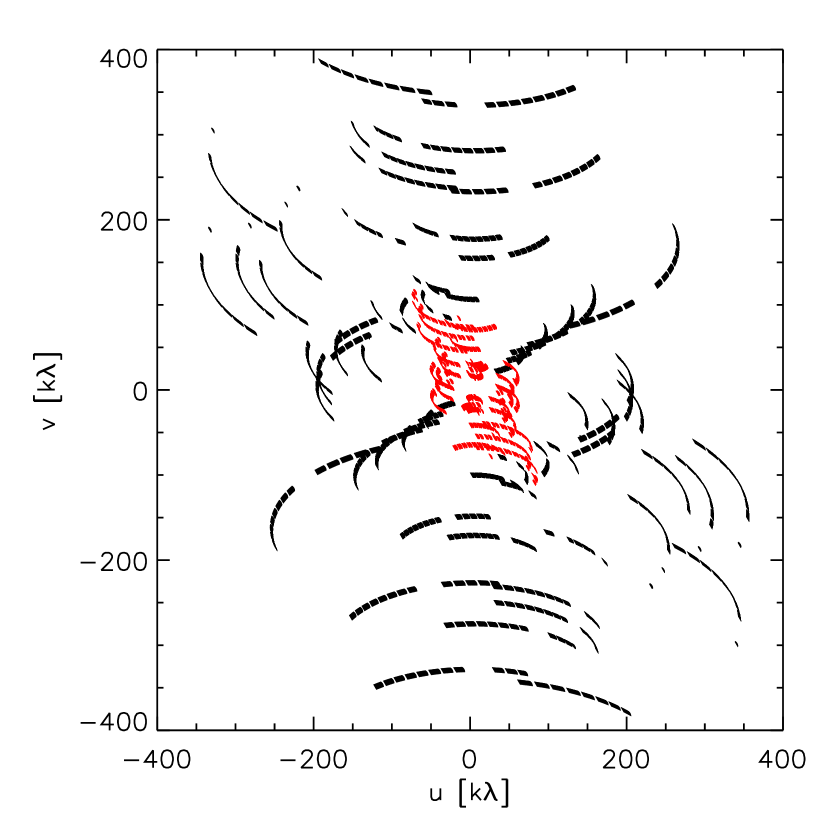
Continuum subtraction and data imaging were performed using the MIRIAD software package (Sault et al., 1995). The calibrated SMA and eSMA data were combined using the MIRIAD tasks uvaver and invert for both continuum and line analysis. Furthermore, in order to prevent any source position problems which could result from the different phase centres of the SMA and eSMA observations (see Table 1), the option mosaic has been used. No cross flux calibration was done between the SMA and eSMA data. By comparing the continuum emission at different and overlapping baselines between the two datasets it appears that they are in agreement at the level of the calibration accuracy (20–30). Also, Our SMA continuum measurements (only) are in agreement with previous SMA observations at 305 GHz and 354 GHz by Chandler et al. (2005) and Kuan et al. (2004) taking into account the different wavelengths and spatial frequencies covered by the observations.
2.3 Resulting continuum and molecular emission maps
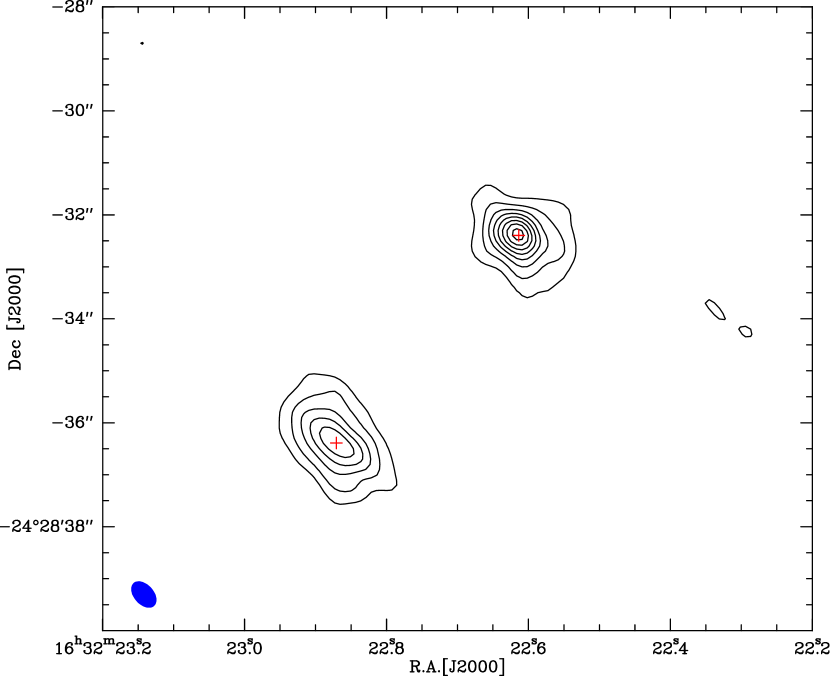
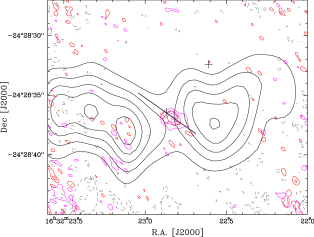
Figure 2 shows the continuum emission observed at 338.9 GHz toward IRAS 16293-2422 with the combined (LSB only) SMA and eSMA data sets. The uniform weighted synthesized beam was 0.58 0.38 (P.A. of 47.6). From Gaussian fits in the plane the positions of the two main continuum sources, IRAS16293A and IRAS16293B, are: = 16h32m2287, = -2428364 and = 16h32m2261, = -2428324. The structure of the emission of the continuum sources reveals both extended and compact emission. More specifically, continuum emission from IRAS16293A is clearly extended along a northeast-southwest axis, whereas toward IRAS16293B the emission appears more compact.
The final combined C17O and C34S emission maps were restored using a uniform weighting, resulting in a synthesized beam size of 0.59 0.38 (P.A. of 47.3 and 48.2, respectively) which corresponds to 71 46 AU at a distance of 120 pc. The most important parameters of the combined data are listed in Table 1 (see set 3).
3 Results
In the following (sub)sections we will only present and discuss results on line emission that were obtained through the combined SMA and eSMA data (see set 3 in Table 1).
3.1 Emission maps and velocity structure
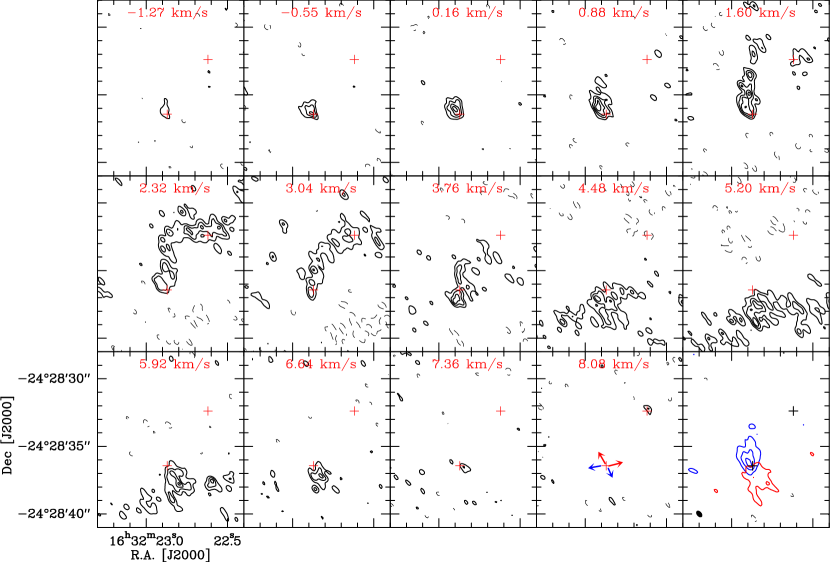
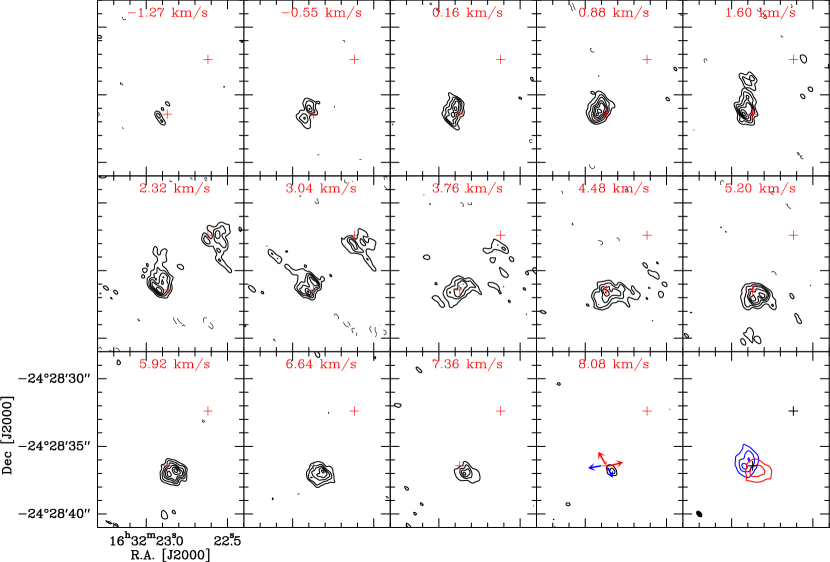
Figures 3 and 4 show i) the channel maps of the C17O (3-2) and C34S (7-6) from LSR = 1.3 km s-1 to 8.1 km s-1, respectively and, ii) the integrated emission maps of these species. The detailed structure of the C17O (3-2) and C34S (7-6) line emission is complex, showing a velocity gradient oriented in a northeast-southwest direction with respect to IRAS16293A. Indeed, the C17O and C34S velocity channel maps, presented in Figs. 3 and 4, show that:
-
•
from LSR= 0.6 km s-1 to 3.8 km s-1 the blue-shifted emission around the systemic velocity peaks toward the north/northeast of IRAS16293A,
-
•
at LSR of 2.3 km s-1 and 3.0 km s-1, some emission appears around IRAS16293B,
-
•
from LSR= 1.6 km s-1 to 5.9 km s-1, the C17O channel maps present some elongated features along an east-west direction, which are consistent with the distribution of the SiO (8-7) emission observed toward IRAS 16293-2422 by Jørgensen et al. (2011),
-
•
and from LSR= 3.8 km s-1 to 7.48.1 km s-1 the red-shifted emission clearly peaks toward the south/southwest of IRAS16293A.
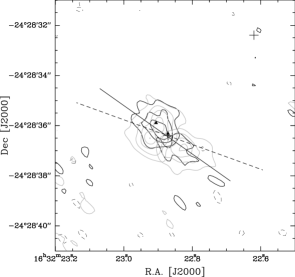
Although the channel maps are complex, the bulk of the C17O and C34S emission is associated with the red and blue structures seen in the integrated intensity emission maps (see final panels of figs. 3 and 4). Figure 5 shows the higher red- and blue-shifted integrated emission maps of both isotopologues from LSR=6.6 to 9.0 km s-1 and LSR=2.6 to 0.7 km s-1, respectively. The orientation northeast- southwest (NE-SW) of the velocity gradient is clearly seen in Fig. 5. The resulting measured position angle is 54.
3.2 Spectra
Fig. 6 displays the spectral profiles of the C17O and C34S, on a (R.A. , Dec) grid centered on IRAS16293A. Most of the blue-shifted emission is stronger in the northern/northeast offsets of IRAS16293A whereas the red-shifted emission is stronger in the southern/southwest offsets.
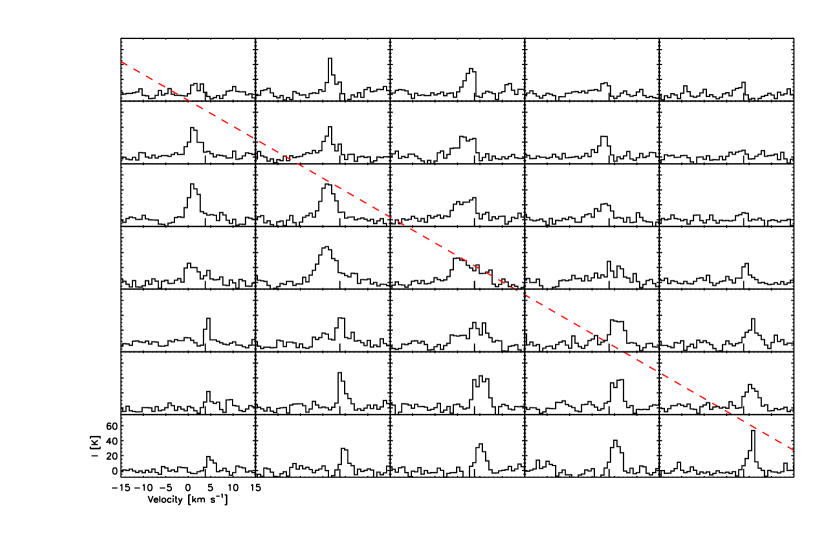
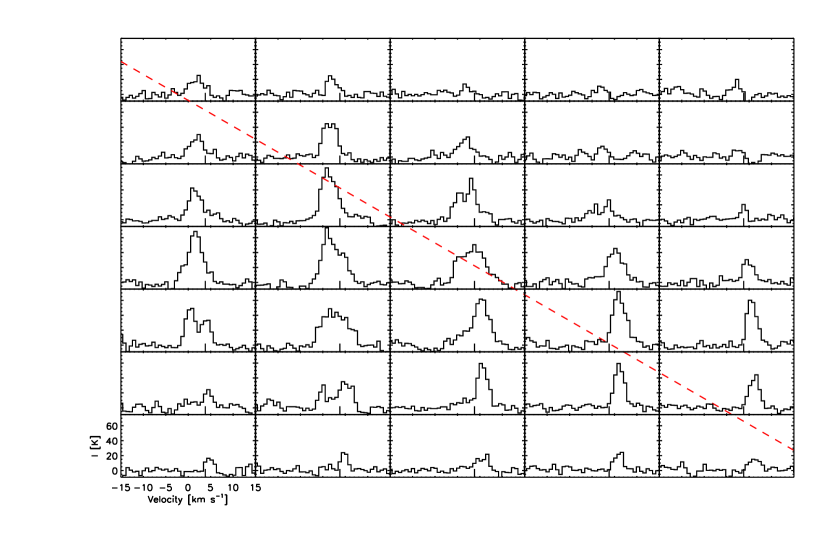
Toward the central source (IRAS16293A), both C34S and C17O spectra can approximately be described by a single Gaussian (v1/2 of 7–7.7 km s-1) centered at 3.4 km s-1 for C34S, which is close to the systemic velocity of the cloud (3–4 km s-1, see Mizuno et al., 1990; Jørgensen et al., 2011) and, at 1.4 km s-1 for C17O. The C17O spectrum being spread toward source IRAS16293A (Fig. 6), the resulting fit is poor, that leads to a non-accurate determination of the center of the Gaussian.
4 Analysis and discussion
4.1 Missing flux
The present section aims to estimate the portion of the total flux resolved out by the interferometer. To estimate the fraction of the total flux is missing, we compared the SMA and eSMA data to archival JCMT observations555The JCMT data used here are public and available from the JCMT Science Archive portal, see http://www.jach.hawaii.edu/JCMT/archive/. and to published CSO observations (Blake et al., 1994) .
The SMA and eSMA C17O spectrum was convolved with a Gaussian beam to mimic the JCMT beam at 337 GHz (15), and the JCMT spectrum has been converted into main beam temperature (Tmb) using Tmb=T/, where T is the antenna temperature and the main beam efficiency. We have adopted a value of 0.64 for (Buckle et al., 2009). In addition, the JCMT spectrum has been smoothed to the same spectral resolution (0.72 km s-1) as that of the combined SMA and eSMA spectrum (see Table 1).
At the systemic velocity of the cloud (3 - 4 km s-1, Mizuno et al., 1990; Jørgensen et al., 2011) almost all the C17O emission is resolved out, since this emission is present largely in the extended surrounding cold gas. However, in the line wings (from LSR = 0 km s-1 to 2 km s-1 and from LSR = 5.5 km s-1 to 7.5 km s-1, as shown in Fig. 7), 60 %–70 % of the C17O flux is recovered by the combined SMA and eSMA observations.
Concerning the C34S emission, no single-dish spectra are available. We therefore compared the integrated line flux, reported by Blake et al. (1994) from CSO observations, with the integrated line flux derived from the convolution of the SMA and eSMA C34S spectrum with a Gaussian beam similar to the CSO beam at 337 GHz (20). The comparison shows that 595 % of the C34S emission is resolved out. We conclude that C34S emission is filtered out by the interferometer in a manner to an extent similar to that for C17O emission.

4.2 Interpretation of the velocity data for C17O and C34S
4.2.1 Indication of non-outflowing gas
The purpose of this section is to investigate the hypothesis that C17O and C34S show any velocity gradient in the propagation direction of the outflow.
Although the orientation of northeast-southwest velocity gradient seen in the C17O and C34S channel and spectral maps (Figs. 3, 4 and 6) is aligned with the one of the northeast-southwest (NE–SW) outflow of the source (P.A. of 45, Walker et al., 1988; Mizuno et al., 1990; Hirano et al., 2001; Castets et al., 2001; Garay et al., 2002; Stark et al., 2004; Chandler et al., 2005; Loinard et al., 2013), the NE-SW outflow harbors large scale structures only (15 000 AU) and does not show any small scale structures (3 000 AU), as discussed in Loinard et al. (2013) and Yeh et al. (2008), in contrast to C17O and C34S that are only probing small scales.
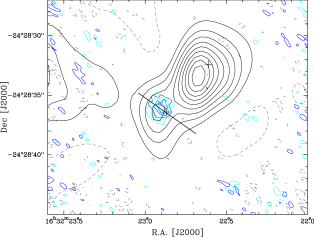
For the east-west (E–W) outflow, Yeh et al. (2008) showed that it had a complex structure in CO emission – but on small scales is oriented in the NE–SW direction with a position angle of about 70. Takakuwa et al. (2007) found that HCN emission observed by the SMA was partly due to the E–W outflow. Figure 8 shows the integrated high blue-shifted (LSR=2.6 to 0.7 km s-1) and red-shifted (LSR=6.6 to 9.0 km s-1) velocities C17O and C34S and CO (2–1)666The CO (2–1) observations were carried out with the SMA by Jørgensen et al. (2011).. Contrary to HCN emission, the C17O and C34S emission appears to be nearly 40 and 90 different in angles than the CO emission for the high red-shifted and blue-shifted emission, respectively. Furthermore, as shown in Fig. 5, a position angle of 70 doesn’t fit on the higher red- and blue-shifted integrated emission maps of both isotopologues. Our finding suggests that C17O and C34S are unlikely to probe a structure which is associated with the east-west outflow and, could originate from a different source than IRAS16293A, which likely drives the E-W outflow (Yeh et al., 2008).
4.2.2 Rotation pattern
The emission of C17O and C34S, which we assume to be optically thin, is complex. The observed northeast/north – southwest/south velocity gradients and line profiles do not appear to trace outflowing material but may indicate rotation signatures. The presence of rotating material towards source IRAS16293A (roughly perpendicular to the second outflow of IRAS16293, that is oriented in an east–west direction, see Mundy et al., 1992; Yeh et al., 2008; Jørgensen et al., 2011) has been reported based on single-dish and interferometric observations of 13CO, C18O, H2CO and C32S (Mundy et al., 1986; Menten et al., 1987; Mundy et al., 1990; Zhou, 1995; Schöier et al., 2004). Likewise, from SMA observations of HCN and HC15N, Takakuwa et al. (2007) and Huang et al. (2005) also reported a velocity gradient in a northeast/north-southwest/south direction (i.e. along the outflow oriented NE-SW). Takakuwa et al. (2007) interpreted the observed flattened structure as an accreting disk and Huang et al. (2005) suggested the emission is probing an inclined (30, with respect to the sky) rotating circumstellar disk. These earlier velocity gradient observations are all consistent with our SMA and eSMA C17O and C34S observations (see Figs. 3, 4, 5 and 6), but are of lower resolution.
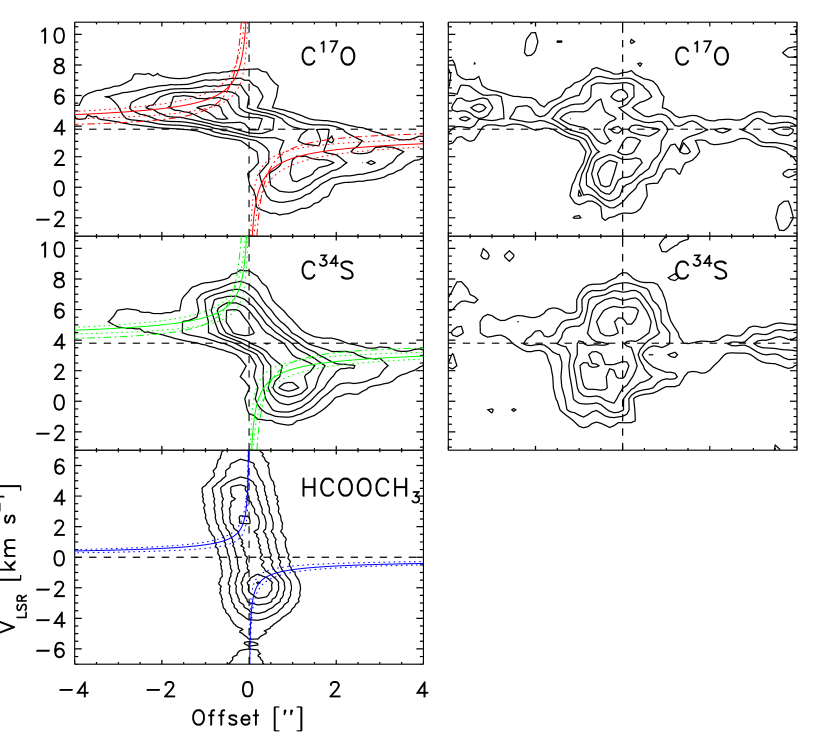
Rotational motion, in particular of Keplerian type, can be distinguished from solid body motions and infall signatures through position-velocity diagrams (hereafter PV-diagrams). Typically, if the gas is dominated by rotation, the PV-diagram along the supposed axis of rotation should present no evidence of rotation, whereas the PV-diagram along the perpendicular axis should show the maximum effect (e.g. Brinch et al., 2009). Figure 9 presents the PV-diagrams for C17O and C34S centered on the position of IRAS16293A i) for a slice along the northeast-southwest velocity gradient direction (54) and ii) for a slice along its perpendicular direction (144), which is assumed to be the rotational axis. We note that, for both isotopologues, no evidence of systemic motions is observed along the supposed rotational axis. Also, the perpendicular axis, that is oriented in the northeast-southwest direction, clearly represents a strong rotation pattern (see the left hand upper and middle panels of Fig. 9): i) the blue-shifted emission is located in the north whereas the red-shifted emission is mainly seen in the south, ii) the related main blue-and red-shifted emission peaks are shifted west and east from the systemic velocity axis and, iii) the emission drops at low velocities and the distribution of the emission can be described by a “butterfly wing” shape in the upper-left and bottom-right quadrants only. The positions of the blue and red-shifted emission peaks in the C17O and C34S velocity profiles are consistent with PV-diagrams in CS, 13CO, C18O, HCN and HC15N, towards IRAS16293A, for which rotation of material has been reported (see Mundy et al., 1986, 1990; Zhou, 1995; Menten et al., 1987; Huang et al., 2005).
4.2.3 Keplerian-type rotation or reflection of a rotating/infalling core ?
Both C17O and C34S PV-diagrams present a “butterfly wing” shape along the northeast-southwest axis. This specific pattern is usually associated with Keplerian motion of the gas. Indeed, it has been seen toward several Class I young stellar objects for which disks in Keplerian rotation have been observed (e.g L1489 IRS, IRS43, IRS 63, Elias 29 and HH 111, see Hogerheijde, 2001; Lommen et al., 2008; Jørgensen et al., 2009; Lee, 2010). Our results in Fig. 9 appear to indicate that motion of the gas could be dominated by Keplerian-type rotation. Nonetheless, rotation of material which has a constant angular momentum could also fit the observed patterns. In order to estimate whether the rotation is purely Keplerian or reflecting a rotating infalling core, simple models of a rotation velocity profile have been performed (see left–hand panels in Fig. 9). The velocity field was parameterized by a rotational velocity depending on the radius:
-
•
for purely Keplerian rotation, where the stellar mass dominates over the envelope mass, we adopted a velocity profile for a disk seen edge-on ;
(1) where the mass of the central object,
-
•
and for infall with conservation of the angular momentum, we used a simple power law ; V r-1 assuming an angular momentum of 150 AU km s-1, that is in agreement with the typical values reported by Belloche (2013).
In addition, our velocity profile studies also includes gas probed by the methyl formate molecule (HCOOCH3). Pineda et al. (2012) have suggested, from ALMA science verification observations, that HCOOCH3 PV-diagram along the north/northeast–south/southwest direction toward IRAS16293A is consistent with rotation of a disk.
The best models, roughly fitting both emission peaks and the 3 edge, are presented in the left hand panels on Fig. 9. For the infall model, our best model is well described by the following law: V km s-1. A salient result is that Keplerian rotation cannot be unambiguously distinguished from rotation conserving its angular momentum the C17O and C34S PV-diagrams. Our data are therefore consistent with rotation and we might be observing a change of rotation profile in the envelope as observed in some Class I objects (e.g. Lee, 2010; Momose et al., 1998) but we can make no firm conclusion.
Also, the rotation seems to reflect the decrease in envelope mass. Indeed, the predicted curves for a purely Keplerian rotation profile are obtained for a central object of 0.49 M☉ based on C17O observations – which is in agreement within 10 with the masses of the central object derived by Looney et al. (2000); Huang et al. (2005); Pineda et al. (2012), but a factor 2 lower than the central mass derived in Takakuwa et al. (2007) – and, for central objects of 0.39 M☉ and 0.09 M☉ from C34S and HCOOCH3 observations, respectively. The results indicate that a single central mass is inconsistent with the data. One possibility is that the envelope mass (Menv(r)) is getting closer to the stellar mass resulting in a rotation profile better described by:
| (2) |
Also, the HCOOCH3 ALMA-SV observations suggest that if the mass of the central object is greater than 0.1 M⊙ then a purely Keplerian velocity field will be inconsistent with our measurements (see Fig. 9).
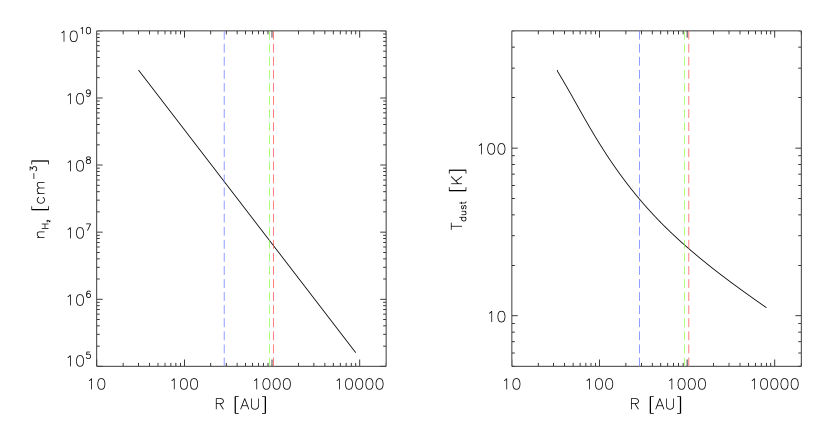
In summary, our analysis suggests that the velocity field is inconsistent with pure Keplerian rotation around a single point-mass ; rather the enclosed envelope mass plus stellar mass is influencing the distribution of the rotational velocities. In this instance, different tracers may have different enclosed masses and thus the rotation curves may be more distinct. In this case, the inferred dynamical mass from C17O and C34S must be larger than the dynamical mass from HCOOCH3 with each probing larger scales. This point is illustrated in Figure 10, which shows the density and dust temperature profiles of IRAS 16293-2422 from Schöier et al. (2002) and indicates the radii equivalent to the radii of the enclosed masses corresponding to the HCOOCH3, C34S and C17O mass estimates. We also conclude that methyl formate is clearly probing denser and warmer gas than C34S and C17O.
4.2.4 Other possible hypotheses
Our analysis shows that C34S and C17O are probing a rotating structure. Nevertheless, other scenarios, that cannot be ruled out at the present time, can also explain our observations.
The first hypothesis implies that the observed structure may be contaminated by infall motions in the envelope. In that connection, Takakuwa et al. (2007) interpreted the observed flattened structure seen in HCN and HC15N, which shows a velocity gradient along a northeast/southwest direction, but with a different P.A., as an accreting disk. Although, our present data are consistent with rotation, we cannot rule out the possibility that a part of the material is actually infalling at some place in the envelope (i.e. at P.A. other than 144). In that light, Tobin et al. (2012) have shown that at scale larger than 1000 A.U. a mix of infall and (solid-body) rotation can result in a PV-diagram which present similarities with the PV-diagrams for C17O and C34S (see, for example, Figure 1 of Tobin et al., 2012). Likely, infall can also affect a Keplerian-type PV-diagram on scale smaller than 1000 AU.
Another hypothesis involves the nature of the circumstellar infalling envelope. Recently, Tobin et al. (2011, 2012) have shown that the morphology of an envelope can affect the kinematics on scales larger than 1000 AU. Indeed, due to projection effects, a filamentary infalling envelope could give rise to a PV-diagram similar to a differential rotation PV-diagram. Although unlikely, the nature of the envelope might affect the kinematic we are observing at scales close to 1000 AU (see Fig. 10).
Alternatively, C17O and C34S could be probing a magnetic pseudo-disk (see Galli & Shu, 1993a, b; Davidson et al., 2011; Hennebelle & Ciardi, 2009). In this connection, Davidson et al. (2011) have shown that pseudo-disks are observed for Class 0 young stellar objects (e.g. L1527, IC348–SMM2). The salient reasons which support the hypothesis that a pseudo-disk may give rise to our observations are as follows:
- •
-
•
polarization observations support the presence of a magnetic pseudo-disk.
With regard to the magnetic field, large scale polarization has been reported by Rao et al. (2009) and Tamura et al. (1995) based on observations of the dust continuum emission toward IRAS 16293-2422. According to Rao et al. (2009) the magnetic energy associated with the magnetic field of about 4.5 mG is comparable with the rotational energy of the system given that it is a rotating disk. Very briefly, the rotational energy (Er) of the disk divided by the magnetic energy (Emag) in the disk is given by:
| (3) |
where r is the radius of the disk, is the angular velocity of the disk, the average density in the disk, the permittivity of free space and B the magnetic field. If we use the ansatz that Bb(n, where b is a constant between 1 and 5, then we obtain the result that the rotational and magnetic energies are roughly equal for b3. Here we have used the observed quantities of r300 AU and is given by 1.710-10 rad s-1. In this connection, Hennebelle & Ciardi (2009) have recently performed simulations of disk formation for which both rotation and magnetic field are present. These models show that it is feasible to maintain a magnetic pseudo-disk in the presence of rotation.
The formation of a pseudo disk and its growth are regulated by the geometry of the magnetic field (see Davidson et al., 2011). The rotational axis of such a disk should be aligned with the magnetic field direction (Galli & Shu, 1993b; Crutcher, 2006; Davidson et al., 2011). Recently, Alves et al. (2012) using observations of H2O masers at 22 GHz carried out with the Very Large Array (synthesized beam of 0.14 0.08) described the magnetic field structure around IRAS16293A, assuming that the H2O polarization vectors are parallel to the direction of the magnetic field in the plane-of-the-sky (Alves et al., 2012). Comparison between our eSMA and SMA observations and these H2O linear polarization vectors shows that the configuration of our supposed pseudo-disk symmetry axis is aligned with the magnetic field direction. Our C17O and C34S observations are thus consistent with this scenario.
5 Conclusions
We have performed a subarcsecond (0.59 0.38) interferometric study of the velocity structure of the low-mass protostar IRAS 16293-2422 using combined SMA and eSMA observations of C17O (3–2) and C34S (7–6). Our main results and conclusions are the following:
-
1.
A velocity gradient which is oriented in a northeast–southwest direction is observed towards source IRAS16293A. More specifically, this northeast-southwest velocity gradient prevails in the bulk of the C17O and C34S emission which is composed of blue and red-shifted emissions lying in the LSR range 3 to 9 km s-1.
-
2.
Our observations show that the C17O and C34S emissions are probing larger scales than HCOOCH3 and are therefore consistent with having a larger enclosed mass. In addition, the HCOOCH3 ALMA-SV observations show that if the mass of the central object is greater than 0.1 M⊙ then the Keplerian velocity field will be inconsistent with our measurements.
-
3.
The C17O and C34S observations appear to probe a rotating structure. This structure and the dynamics of the gas could result from the presence of a magnetic field through formation of a magnetic pseudo-disk.
The data presented in this paper illustrate the necessity of high angular resolution observations with high spectral resolution combined with single-dish observations (to recover the extended emission) to disentangle the motion of the gas in this object and understand which scenario prevails here. The data also show that the structure of the low-mass protostar IRAS 16293-2422 is complicated and therefore only a complex model of the source will help us to constrain and access the relative importance of outflowing, infalling and rotational motions.
References
- Ahrens & Winnewisser (1999) Ahrens, V., & Winnewisser, G. 1999, Naturforsch, 54a
- Alves et al. (2012) Alves, F. O., Vlemmings, W. H. T., Girart, J. M., & Torrelles, J. M. 2012, A&A, 542, A14
- Basu (1998) Basu, S. 1998, ApJ, 509, 229
- Belloche (2013) Belloche, A. 2013, in EAS Publications Series, Vol. 62, EAS Publications Series, 25–66
- Bisschop et al. (2008) Bisschop, S. E., Jørgensen, J. K., Bourke, T. L., Bottinelli, S., & van Dishoeck, E. F. 2008, A&A, 488, 959
- Blake et al. (1994) Blake, G. A., van Dishoeck, E. F., Jansen, D. J., Groesbeck, T. D., & Mundy, L. G. 1994, ApJ, 428, 680
- Bogey et al. (1981) Bogey, M., Demuynck, C., & Destombes, J. L. 1981, Chemical Physics Letters, 81, 256
- Bogey et al. (1982) —. 1982, Journal of Molecular Spectroscopy, 95, 35
- Bottinelli et al. (2004) Bottinelli, S., Ceccarelli, C., Neri, R., et al. 2004, ApJ, 617, L69
- Bottinelli et al. (2008) Bottinelli, S., Young, K. H., Chamberlin, R., et al. 2008, in Society of Photo-Optical Instrumentation Engineers (SPIE) Conference Series, Vol. 7012, Society of Photo-Optical Instrumentation Engineers (SPIE) Conference Series
- Brinch et al. (2009) Brinch, C., Jørgensen, J. K., & Hogerheijde, M. R. 2009, A&A, 502, 199
- Buckle et al. (2009) Buckle, J. V., Hills, R. E., Smith, H., et al. 2009, MNRAS, 399, 1026
- Burkholder et al. (1987) Burkholder, J. B., Lovejoy, E. R., Hammer, P. D., & Howard, C. J. 1987, Journal of Molecular Spectroscopy, 124, 450
- Castets et al. (2001) Castets, A., Ceccarelli, C., Loinard, L., Caux, E., & Lefloch, B. 2001, A&A, 375, 40
- Cazzoli et al. (2002) Cazzoli, G., Dore, L., Puzzarini, C., & Beninati, S. 2002, Physical Chemistry Chemical Physics (Incorporating Faraday Transactions), 4, 3575
- Ceccarelli et al. (2000) Ceccarelli, C., Castets, A., Caux, E., et al. 2000, A&A, 355, 1129
- Chandler et al. (2005) Chandler, C. J., Brogan, C. L., Shirley, Y. L., & Loinard, L. 2005, ApJ, 632, 371
- Crutcher (2006) Crutcher, R. M. 2006, Science, 313, 771
- Dapp & Basu (2010) Dapp, W. B., & Basu, S. 2010, A&A, 521, L56
- Davidson et al. (2011) Davidson, J. A., Novak, G., Matthews, T. G., et al. 2011, ApJ, 732, 97
- de Geus et al. (1989) de Geus, E. J., de Zeeuw, P. T., & Lub, J. 1989, A&A, 216, 44
- Galli & Shu (1993a) Galli, D., & Shu, F. H. 1993a, ApJ, 417, 220
- Galli & Shu (1993b) —. 1993b, ApJ, 417, 243
- Garay et al. (2002) Garay, G., Mardones, D., Rodríguez, L. F., Caselli, P., & Bourke, T. L. 2002, ApJ, 567, 980
- Goorvitch (1994) Goorvitch, D. 1994, ApJS, 95, 535
- Gottlieb et al. (2003) Gottlieb, C. A., Myers, P. C., & Thaddeus, P. 2003, ApJ, 588, 655
- Hayashi et al. (1993) Hayashi, M., Ohashi, N., & Miyama, S. M. 1993, ApJ, 418, L71
- Hennebelle & Ciardi (2009) Hennebelle, P., & Ciardi, A. 2009, A&A, 506, L29
- Hirano et al. (2001) Hirano, N., Mikami, H., Umemoto, T., Yamamoto, S., & Taniguchi, Y. 2001, ApJ, 547, 899
- Ho et al. (2004) Ho, P. T. P., Moran, J. M., & Lo, K. Y. 2004, ApJ, 616, L1
- Hogerheijde (2001) Hogerheijde, M. R. 2001, ApJ, 553, 618
- Huang et al. (2005) Huang, H.-C., Kuan, Y.-J., Charnley, S. B., et al. 2005, Advances in Space Research, 36, 146
- Jørgensen et al. (2011) Jørgensen, J. K., Bourke, T. L., Nguyen Luong, Q., & Takakuwa, S. 2011, A&A, 534, A100
- Jørgensen et al. (2012) Jørgensen, J. K., Favre, C., Bisschop, S. E., et al. 2012, ApJ, 757, L4
- Jørgensen et al. (2009) Jørgensen, J. K., van Dishoeck, E. F., Visser, R., et al. 2009, A&A, 507, 861
- Kim & Yamamoto (2003) Kim, E., & Yamamoto, S. 2003, Journal of Molecular Spectroscopy, 219
- Klapper et al. (2003) Klapper, G., Surin, L., Lewen, F., et al. 2003, ApJ, 582, 262
- Knude & Høg (1998) Knude, J., & Høg, E. 1998, A&A, 338, 897
- Kuan et al. (2004) Kuan, Y., Huang, H., Charnley, S. B., et al. 2004, ApJ, 616, L27
- Lee (2010) Lee, C.-F. 2010, ApJ, 725, 712
- Lim & Takakuwa (2006) Lim, J., & Takakuwa, S. 2006, ApJ, 653, 425
- Loinard et al. (2008) Loinard, L., Torres, R. M., Mioduszewski, A. J., & Rodríguez, L. F. 2008, ApJ, 675, L29
- Loinard et al. (2013) Loinard, L., Zapata, L. A., Rodríguez, L. F., et al. 2013, MNRAS, 430, L10
- Lommen et al. (2008) Lommen, D., Jørgensen, J. K., van Dishoeck, E. F., & Crapsi, A. 2008, A&A, 481, 141
- Looney et al. (2000) Looney, L. W., Mundy, L. G., & Welch, W. J. 2000, ApJ, 529, 477
- Menten et al. (1987) Menten, K. M., Serabyn, E., Guesten, R., & Wilson, T. L. 1987, A&A, 177, L57
- Mizuno et al. (1990) Mizuno, A., Fukui, Y., Iwata, T., Nozawa, S., & Takano, T. 1990, ApJ, 356, 184
- Momose et al. (1998) Momose, M., Ohashi, N., Kawabe, R., Nakano, T., & Hayashi, M. 1998, ApJ, 504, 314
- Müller et al. (2005) Müller, H. S. P., Schlöder, F., Stutzki, J., & Winnewisser, G. 2005, Journal of Molecular Structure, 742, 215
- Müller et al. (2001) Müller, H. S. P., Thorwirth, S., Roth, D. A., & Winnewisser, G. 2001, A&A, 370, L49
- Mundy et al. (1986) Mundy, L. G., Myers, S. T., & Wilking, B. A. 1986, ApJ, 311, L75
- Mundy et al. (1992) Mundy, L. G., Wootten, A., Wilking, B. A., Blake, G. A., & Sargent, A. I. 1992, ApJ, 385, 306
- Mundy et al. (1990) Mundy, L. G., Wootten, H. A., & Wilking, B. A. 1990, ApJ, 352, 159
- Narayanan et al. (1998) Narayanan, G., Walker, C. K., & Buckley, H. D. 1998, ApJ, 496, 292
- Ohashi et al. (1997) Ohashi, N., Hayashi, M., Ho, P. T. P., et al. 1997, ApJ, 488, 317
- Pineda et al. (2012) Pineda, J. E., Maury, A. J., Fuller, G. A., et al. 2012, ArXiv e-prints
- Qi (2007) Qi, C. 2007, Advances in Space Research, 40, 639
- Ram (1995) Ram, R. 1995, Journal of Molecular Spectroscopy, 173, 146
- Rao et al. (2009) Rao, R., Girart, J. M., Marrone, D. P., Lai, S.-P., & Schnee, S. 2009, ApJ, 707, 921
- Remijan & Hollis (2006) Remijan, A. J., & Hollis, J. M. 2006, ApJ, 640, 842
- Remijan et al. (2007) Remijan, A. J., Markwick-Kemper, A., & ALMA Working Group on Spectral Line Frequencies. 2007, BAAS, 38, 963
- Sault et al. (1995) Sault, R. J., Teuben, P. J., & Wright, M. C. H. 1995, in Astronomical Society of the Pacific Conference Series, Vol. 77, Astronomical Data Analysis Software and Systems IV, ed. R. A. Shaw, H. E. Payne, & J. J. E. Hayes, 433
- Schöier et al. (2002) Schöier, F. L., Jørgensen, J. K., van Dishoeck, E. F., & Blake, G. A. 2002, A&A, 390, 1001
- Schöier et al. (2004) —. 2004, A&A, 418, 185
- Stark et al. (2004) Stark, R., Sandell, G., Beck, S. C., et al. 2004, ApJ, 608, 341
- Takakuwa et al. (2004) Takakuwa, S., Ohashi, N., Ho, P. T. P., et al. 2004, ApJ, 616, L15
- Takakuwa et al. (2007) Takakuwa, S., Ohashi, N., Bourke, T. L., et al. 2007, ApJ, 662, 431
- Tamura et al. (1995) Tamura, M., Hough, J. H., & Hayashi, S. S. 1995, ApJ, 448, 346
- Terebey et al. (1984) Terebey, S., Shu, F. H., & Cassen, P. 1984, ApJ, 286, 529
- Tobin et al. (2012) Tobin, J. J., Hartmann, L., Bergin, E., et al. 2012, ApJ, 748, 16
- Tobin et al. (2011) Tobin, J. J., Hartmann, L., Chiang, H.-F., et al. 2011, ApJ, 740, 45
- Walker et al. (1993) Walker, C. K., Carlstrom, J. E., & Bieging, J. H. 1993, ApJ, 402, 655
- Walker et al. (1986) Walker, C. K., Lada, C. J., Young, E. T., Maloney, P. R., & Wilking, B. A. 1986, ApJ, 309, L47
- Walker et al. (1988) Walker, C. K., Lada, C. J., Young, E. T., & Margulis, M. 1988, ApJ, 332, 335
- Wilner & Welch (1994) Wilner, D. J., & Welch, W. J. 1994, ApJ, 427, 898
- Winkel et al. (1984) Winkel, Jr., R. J., Davis, S. P., Pecyner, R., & Brault, J. W. 1984, Canadian Journal of Physics, 62, 1414
- Wootten (1989) Wootten, A. 1989, ApJ, 337, 858
- Yeh et al. (2008) Yeh, S. C. C., Hirano, N., Bourke, T. L., et al. 2008, ApJ, 675, 454
- Zapata et al. (2013) Zapata, L. A., Loinard, L., Rodríguez, L. F., et al. 2013, ApJ, 764, L14
- Zhou (1995) Zhou, S. 1995, ApJ, 442, 685