Knight shift and nuclear spin relaxation in Fe/n-GaAs heterostructures
Abstract
We investigate the dynamically polarized nuclear-spin system in Fe/n-GaAs heterostructures using the response of the electron-spin system to nuclear magnetic resonance (NMR) in lateral spin-valve devices. The hyperfine interaction is known to act more strongly on donor-bound electron states than on those in the conduction band. We provide a quantitative model of the temperature dependence of the occupation of donor sites. With this model we calculate the ratios of the hyperfine and quadrupolar nuclear relaxation rates of each isotope. For all temperatures measured, quadrupolar relaxation limits the spatial extent of nuclear spin-polarization to within a Bohr radius of the donor sites and is directly responsible for the isotope dependence of the measured NMR signal amplitude. The hyperfine interaction is also responsible for the Knight shift of the nuclear resonance frequency that is measured as a function of the electron spin accumulation. The Knight shift is shown to provide a measurement of the electron spin-polarization that agrees qualitatively with standard spin transport measurements.
I Introduction
Hyperfine interactions profoundly influence electron-spin dynamics in n-GaAs at temperatures below 100 K.Paget et al. (1977); Salis et al. (2009); Chan et al. (2009); Kölbl et al. (2012) The strong influence is a direct result of the low channel doping of between which is typically used to maximize the electron spin lifetime.Dzhioev et al. (2002); Lou et al. (2006, 2007); Chan et al. (2009); Kölbl et al. (2012) This doping range is only slightly above the metal-insulator transition of GaAs, and so the system is best described with a combination of localized and itinerant electronic states.Romero et al. (1990); Intronati et al. (2012) The wavefunctions of localized electrons have a dramatically enhanced overlap with nearby nuclei, greatly increasing the efficiency of dynamic nuclear polarization by the contact hyperfine interaction.Lampel (1968); Abragam (1961) The action of the spin-polarized nuclear system on the electron system is equivalent to an effective magnetic field that is often larger than the applied field.Overhauser (1953)
In this paper, we report on measurements of nuclear magnetic resonance (NMR) by probing the response of the electronic spin accumulation to this effective field. A typical means of modulating the electron spin accumulation is by dephasing the spins with an applied magnetic field, which is known as the Hanle effect. The presence of the effective nuclear magnetic field can partially cancel the applied field and restore (in part) the electron spin polarization. In this experiment, we extend the earlier work of Ref. Chan et al., 2009 by using NMR to probe the detailed dynamics of the coupled electron-nuclear spin system, allowing for the extraction of information about the occupancy of donor sites by spin-polarized electrons and their coupling to the nuclear spins of the different isotopes. When the nuclear spin-polarization is destroyed by NMR, the electronic spin accumulation changes in the presence of the new effective magnetic field. Therefore to detect NMR, we monitor the polarization of the electronic spin system as a function of the frequency of the applied ac magnetic field.
We show that quadrupolar relaxation of the nuclear spin allows a nonzero nuclear spin polarization to exist only very near donor sites and that this spatial dependence explains the order of magnitude difference in the NMR signal magnitude as a function of isotope. The presence of spin-polarized electrons acts through the hyperfine interaction as an effective magnetic field affecting the nuclei near these donor sites. If the occupation fraction of donor sites is known, the electronic field near donor sites can be calculated for a given spin accumulation. We provide a quantitative estimate for the occupation fraction on the basis of resistivity measurements. Using this model, we show that the magnitude of the electronic spin polarization can be determined using the Knight shift.
Figure 1 shows a schematic of a typical lateral spin-valve device. From bottom to top, the epitaxial Fe/n-GaAs (100) heterostructures consist of a GaAs buffer layer followed by a Si-doped 2.5 m thick channel , a 15 nm transition layer over which the Si-doping is increased to cm-3, followed by a 15 nm thick ( cm-3) layer.Hanbicki et al. (2003) The Fe layer is 5 nm thick and is grown at a nominal substrate temperature of C.Lou et al. (2007, 2006); Chan (2010) The structures are capped with thin layers of Al and Au. The heterostructures are fabricated using standard photolithography and semiconductor processing techniques into lateral spin-valves with injection and detection contacts (5 m × 50 m), labeled and respectively, separated by 10 m. The heavily doped interfacial regions form Schottky tunnel barriers. A spin-polarized current is created at the injection contact () when the Fe/GaAs interface is biased. This spin current leads to a non-equilibrium spin accumulation in the channel, where
| (1) |
and is the concentration of electrons with spin up(down). The spin accumulation is established in the channel by the combined effects of drift, diffusion, relaxation and precession. The presence of the spin accumulation in the channel is detected as a change in voltage relative to a remote contact , at either the injection contact itself in a three-terminal configuration ,Lou et al. (2006); Tran et al. (2009); Chan et al. (2009) or at a nonlocal detection contact (connection not shown).Lou et al. (2007); Salis et al. (2010) In either case, the spin accumulation can be detected by dephasing the spins in the channel using the Hanle effect with an applied magnetic field perpendicular to the magnetization of the contacts.
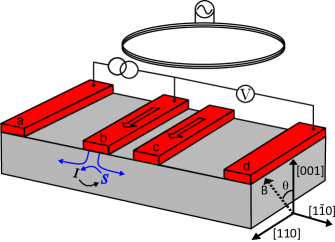
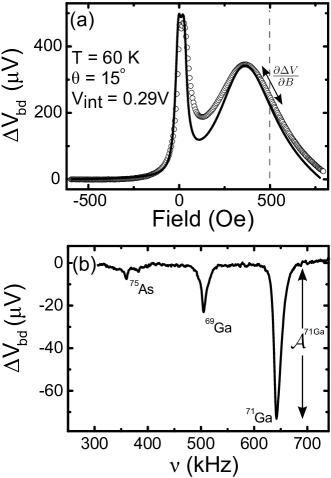
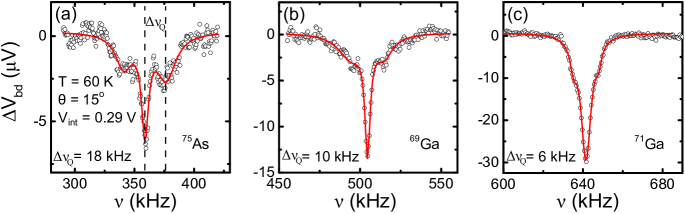
Figure 2(a) shows the change in three-terminal voltage as a function of the applied field . When the field is oriented at an oblique angle from the sample normal as depicted in Fig. 1, two peaks are discernible in the Hanle signal as a function of the applied field. The peak at non-zero field ( Oe in Fig. 2) is a result of the cancellation of the applied field by the effective nuclear field.Paget et al. (1977); Meier and Zakharchenya (1984) To measure NMR, an ac magnetic field is applied using a few-turn coil placed above the sample as shown in Fig. 1. The nuclear field is reduced when the frequency of the ac field matches the nuclear resonance condition , where is the nuclear gyromagnetic ratio for the nuclear isotope , and is the magnitude of the applied field. The slope of the spin signal at a fixed applied field determines the sensitivity to a change in nuclear field. For example in Fig. 2(a), the slope is negative and large at 500 Oe. Figure 2(b) shows the change in the electron spin signal as a function of the ac frequency with the static field fixed at 500 Oe; the decrease in the spin signal at the resonance has an amplitude for each isotope . Note that the measured amplitude at the resonance of is an order of magnitude larger than at the resonance of . Similar differences in the relative magnitudes of NMR signals from different isotopes have been observed at temperatures above 50 K in other dynamically polarized samples doped between 2 and 10 as well as in systems.Chan et al. (2009); Van Dorpe et al. (2005)
In the following sections we show that the observed isotope dependence of the magnitude of the NMR signal arises from the fact that the hyperfine and quadrupolar nuclear-spin relaxation rates are of comparable magnitude. In Section II we review the model of a coupled electron-nuclear spin system. In Section III we demonstrate a simple means of determining the temperature dependence of the donor occupation fraction, which determines the efficiency of DNP, from charge transport. In Section IV we show that the temperature dependence of the measured NMR signal can be reproduced with a quantitative model accounting for the spatial distribution of spin-polarized nuclei. The different NMR signals for each isotope are shown to be a result of a different effective volume of spin-polarized nuclei around donors. In Section V we show that it is possible to measure the Knight shift of the nuclear resonance frequency by using spin transport. We use the Knight shift to extract an alternative measurement of the spin-polarization of the electron system.
II the coupled electron-nuclear spin system
Just above the metal-insulator transition, the bottom of the GaAs conduction band can be described as a combination of localized (impurity) and itinerant states. Electron-electron interactions effectively maintain the same average spin polarization between these states.Paget (1981) The electrons in localized states interact strongly with the lattice nuclei via the contact hyperfine interaction
| (2) |
where is the Bohr magneton, is the free electron g-factor, is the nuclear gyromagnetic ratio, and are the nuclear and electronic spin operators respectively, and is the electronic wavefunction evaluated at a nuclear site. For the purposes of our model, we assume the localized wavefunction is that of a hydrogenic donor-bound electron
| (3) |
with an effective Bohr radius .Shklovskii and Efros (1984) Assuming a hydrogenic wavefunction, Paget et al.Paget et al. (1977) recast the hyperfine interaction in terms of two effective magnetic fields: the Knight field, an effective electronic field acting on the nuclei that depends on the distance from the donor:
| (4) |
and the Overhauser field, an effective nuclear field acting on the electrons that is the weighted sum of all the nuclei in the electron’s Bohr radius:
| (5) |
The strength of the electronic and nuclear fields and have been calculated for GaAs to bePaget et al. (1977); Meier and Zakharchenya (1984)
| (6) |
The occupation factor and leakage factor take into account that and are smaller than their maximum values. represents the fraction of donors that are occupied by an electron. Only these donors can contribute to . The Overhauser field is reduced from its maximum possible value by the leakage factor , which takes into account relaxation of the nuclear system by all other channels besides the hyperfine interaction.
The leakage factor can be easily motivated by considering the following rate equation for a nuclei with spin Abragam (1961)
| (7) |
where the first term represents the polarization of nuclei by spin-polarized electrons, and the second and third terms represent hyperfine relaxation with a rate and all other nuclear spin relaxation mechanisms at a rate respectively. In the steady-state limit (), the average nuclear spin is proportional to the average electron spin polarization and the ratio of the pumping rate due to hyperfine coupling to the total nuclear relaxation rate :
| (8) |
The leakage factor is ratio of the hyperfine to total relaxation rate and can be written as
| (9) |
so that
| (10) |
When the hyperfine relaxation time is small, is unity and the nuclear spin polarization is maximized. If, however, other channels for nuclear spin relaxation besides hyperfine coupling are present, then and the polarization is reduced from its ideal value.
The fields and can be determined from our data by modeling the coupled electron-nuclear spin dynamics.Paget et al. (1977); Chan et al. (2009) In these models the average Overhauser field isPaget et al. (1977); Dyakonov and Perel’ (1973)
| (11) |
where on average the nuclear spins are oriented along the vector sum of the applied field and electronic field . The dipolar field (sometimes called the local field) is described with a phenomenological constant .Paget et al. (1977); Gammon et al. (2001); Abragam (1961) Chan et al.Chan et al. (2009) determined the electronic and nuclear fields as well as in an Fe/n-GaAs device with channel doping of 5 cm-3 by numerically solving the drift-diffusion equations for the electronic spin accumulation self-consistently in the presence of the nuclear field given in Eq. 11 and fitting to Hanle curves measured in an oblique magnetic field. They determined the nuclear fields to be
| (12) |
at 60 K as well as measuring the effective dipolar field to be . Comparing to the theoretically calculated values, the implied occupation factor was . In the following section we show that this value agrees with estimates determined from charge transport.
III Occupation Fraction
As discussed in the previous section, the fractional occupation of the localized states is a parameter which can be measured by modeling the coupled electronic and nuclear spin dynamics. In this section we provide a means of extracting from a model of the electrical resistivity that takes into account the conduction and impurity bands. This model is independent of spin transport measurements and can be used to predict the value of the nuclear hyperfine relaxation rate as well as the Knight field.
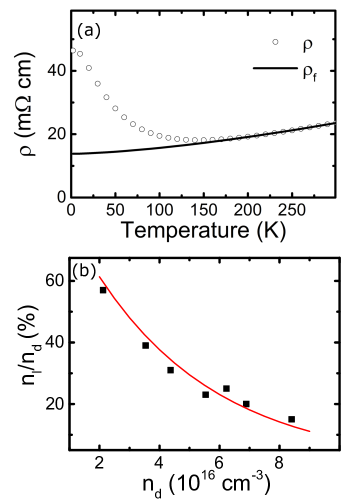
Figure 3(a) shows the resistivity as a function of temperature for a sample doped at 5 cm-3. At 300 K, all of the donors are ionized and the resistivity can be treated as being metallic: , where takes into account ionized impurity scattering in the degenerate limit, and the term with a pre-factor takes into account the phonon contribution to the resistivity.Szmyd et al. (1990); Jacoboni (2010); Lancefield et al. (1987) A curve representing is shown in Fig. 3(a) as a solid black line. As the temperature is lowered, the resistivity drops until electrons become localized by occupying states in the impurity band, at which point the resistivity increases dramatically. We attribute the increase in resistivity to a combination of the decrease in the number of itinerant electrons as they freeze out into localized sites as well as a decreased electron mobility in the localized impurity band. Using Matthiessen’s rule we model the resistivity
| (13) |
where the three scattering rates are due to ionized impurity scattering, optical phonon scattering, and scattering in the impurity band (neutral impurity scattering), and the density of carriers is reduced from the donor density by the number density of occupied isolated donors. Equation 13 can be recast in terms of resistivities:
| (14) |
where is the impurity band resistivity in the limit in which all donors are neutralized. The actual impurity band contribution to the resistivity at any temperature is multiplied by the fraction of singly occupied (neutral) and isolated donors. has been investigated in several semiconductor systems including Ge,Fritzsche (1955); Nishimura (1965); Davis and Compton (1965) and GaAs.Woodbury and Blakemore (1973); Agrinskaya et al. (2010) Our system corresponds to the intermediate doping range in which conduction occurs in the upper-Hubbard or band. This band is composed of donor sites occupied by 2 electrons ( states).Shklovskii and Efros (1984) Based on the increase in resistance at low temperatures in previously studied Ge and GaAs samples,Davis and Compton (1965); Woodbury and Blakemore (1973) as well as simple models of an electron scattering off of neutral donors,Erginsoy (1950); Honig (1966); Maxwell and Honig (1966); Kozhevnikov et al. (1995) the resistivity due to localized impurity states is estimated to be 5-10 times larger than that in the conduction band at low temperatures. We have found that using values of between and only varies the final value of in the analysis below by less than 20%. For the data shown in Fig. 3(a), we use an intermediate value
| (15) |
to determine the contribution of the localized impurity states to the resistivity. Eq. 14 can then be solved for the occupation factor
| (16) |
Assuming a given value of , the only other unknown parameter in Eq. 16 required in order to determine is the number of localized states , which can be estimated from simple statistics. We consider a donor site to be localized if the closest neighboring donor is further away than a critical distance . The number of localized sites is given by the Hertz distribution:Hertz (1909)
| (17) |
where is the average distance between donor sites The number of localized states can be estimated experimentally as a function of doping. Figure 3(b) shows the value for samples doped between , estimated by assuming the occupation factor is unity in the limit of zero temperature. These data can be fit with Eq. 17, and a single value of is found to reproduce over this doping range. The estimated critical radius is approximately twice the Bohr radius , which suggests that the localized states considered here can still be treated as hydrogenic donors.
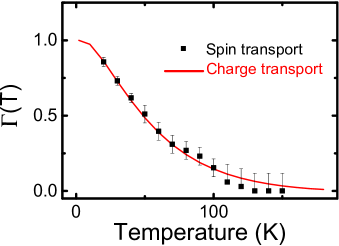
The solid curve in Fig. 4 shows the occupation factor as a function of temperature calculated from the resistivity as described above. The points represent the occupation factor as a function of temperature taken from the measurements of Ref. Chan, 2010, where is determined from spin transport by fitting the coupled electron-nuclear spin system in the same way as described by Chan et al.Chan et al. (2009) In this case, the occupation factor is calculated by assuming that the majority of the Knight field arises from Ga nuclei. In the next section we validate this assumption by showing that spin-polarized As nuclei account for only 1% of the total Overhauser field at 60K. The two measurements of agree to within experimental uncertainties. This result shows that the electronic field comes from localized electronic states distinct from the conduction band. It also provides a simpler means of estimating the hyperfine relaxation rate rather than modeling the electron spin dynamics at each temperature.
IV The nuclear leakage factor
The data of Fig. 2 show an order of magnitude difference in the magnitude of the measured NMR signals of and of at 60 K. We now show that this difference arises from a combination of the spatial dependence of the hyperfine relaxation rate and the strong isotope dependence of nuclear quadrupolar relaxation rate. In this model, the leakage factor becomes a function of position. The hyperfine relaxation rate can be estimated as
| (18) |
where is the correlation time of the hyperfine interaction, is the electronic field acting on the nuclear isotope , and is the nuclear gyromagnetic ratio for that isotope.Paget et al. (1977) Physically, is the time scale over which the hyperfine field fluctuates due to the relaxation and subsequent repolarization of the spin-polarized electron bound to the donor. When the repolarization process is efficient, as we expect for electrical spin injection, we expect to be of the same order as the spin relaxation time . Essentially, Eq. 18 describes a relaxation process in which the nuclear polarization is dephased by precession in the fluctuating hyperfine field, which has a root mean-square value of As in a motional narrowing process, a shorter correlation time (more rapid fluctuation), results in a smaller relaxation rate. The hyperfine relaxation rate becomes exponentially smaller for nuclei further from the donor site.
It has been shown that in undoped GaAs, where hyperfine coupling is irrelevant, that Raman-like scattering of phonons dominates nuclear spin relaxation at temperatures above 30 K.McNeil and Clark (1976) We therefore equate , the nuclear relaxation rate due to non-hyperfine processes, with the quadrupolar relaxation rate in our calculation of the leakage factor (Eq. 9). The electric quadrupole moment of the nuclei couples to the phonons via the electric field gradient induced by these scattering events. The quadrupolar Hamiltonian is non-spin-conserving, resulting in a decrease in the average nuclear spin as phonons are excited. The resulting quadrupolar relaxation rate is given asMcNeil and Clark (1976)
| (19) |
where is is a parameter which takes into account the coupling between phonons and the nuclei, is the quadrupole moment, and is the temperature. The parameter is expected to be independent of doping and of nuclear isotope and is treated as a fitting parameter. The values of the nuclear quadrupolar moments for the isotopes in GaAs are,Lide (2000)
| (20) | |||||
| (21) | |||||
| (22) |
where 1 mb m-2. At fixed temperature, the quadrupolar relaxation rate for should therefore be 9 times larger than for .
In our system, the hyperfine and quadrupolar relaxation mechanisms are similar in magnitude near donor sites. We consider the case of nuclei around a donor occupied by single spin-polarized electron. The leakage factor is
| (23) |
which is explicitly isotope and position dependent. The leakage factor is maximized near the donor where the hyperfine coupling is strongest, and as . Therefore the nuclear field is only large in the region around donor sites where the hyperfine interaction dominates.
We model the spatial extent of the polarized nuclear spins by defining an effective quadrupolar radius at which the two relaxation rates and are equal:Paget et al. (2008)
| (24) |
For , the hyperfine relaxation rate decreases exponentially, and to a good approximation the leakage factor can be assumed to be zero. The effective leakage factor is therefore given by the weighted average
| (25) |
The value of the NMR signal is proportional to the following quantities: the sensitivity of the spin signal with respect to the applied field , the induced change in nuclear polarization, and the isotope dependent leakage factor . This yields the following relation:
| (26) |
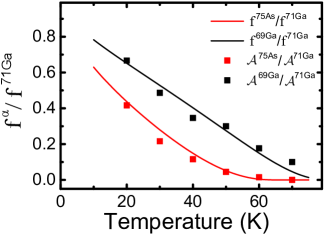
Therefore the ratio of measured resonance signals of any two isotopes at any temperature should be equal to the ratio of their leakage factors. Figure 5 shows the ratio of the magnitude of the NMR signal of and to that of as a function of temperature. The lines are the calculated ratios of the leakage factor taken from our model as a function of temperature. We are able to model the complete temperature dependence by assuming the ratio is constant. We have repeated this analysis on several samples in the doping range of 2 - and found in all cases that
| (27) |
reproduces the temperature dependence of the NMR signals. This result agrees with our previous assumption that quadrupolar relaxation in samples doped just above the metal-insulator transition is independent of doping. It also shows that quadrupolar relaxation essentially localizes the nuclear polarization within a Bohr radius of each donor site. The order of magnitude difference in the measured electronic response to NMR among different isotopes is a direct result of the spatial extent of this nuclear polarization. We emphasize that the strong coupling between electron and nuclear spins implies that the strong spatial inhomogeneity in the nuclear polarization should impact electron spin transport and dynamics.
V Knight Shift
Because the hyperfine field exists only around an occupied donor, the argument of the previous section implies that the nuclear polarization is largest around donors. The spatial average of this field for all three isotopes determines the average hyperfine field experienced by the electrons. The fact that this field decreases rapidly with increasing temperature is due to the dependence in Eq. 19. In comparison, , which governs the hyperfine relaxation rate, depends more weakly on temperature over the range of this experiment ( K). At higher temperatures, decreases exponentially, leading to an even stronger temperature dependence of the hyperfine field. We now shift our focus to the measurement of the electronic field acting on the nuclei by measuring the Knight shift of the resonance frequency as a function of the electronic spin accumulation.
Resonance occurs at the nuclear Larmor frequency , where the total field is the vector sum of the applied field and the much smaller Knight field acting on isotope due to the electronic spin polarization . Note that is parallel to . In the limit where the Knight field is much smaller than the applied field, the nuclear resonance frequency takes the form
| (28) |
where is the oblique angle of the applied field indicated in Fig. 1. The Knight shift is hence determined by the component of parallel to . At a fixed applied field, the Knight shift of the resonance frequency is directly proportional to spin polarization via the electronic field :
| (29) |
where is the electronic field averaged over the envelope of the donor-bound electron wave-function. We assume that the polarized nuclei are confined to a sphere of radius around the donor, where is the quadrupolar radius, so that
| (30) |
where, as found in Ref. Paget et al., 1977,
| (31) |
At 60 K, the average electronic fields using the quadrupole radii calculated from Eq. 24 are -194 G for 75As and -83 G for 69Ga.
Equation 29 predicts the Knight shift of the resonance frequency to be approximately twice as large for than for : for K and . A high precision measurement of the resonance frequency is therefore required to observe the Knight shift. Figure 6 shows the change in the electron spin accumulation as a function of frequency taken using a very slow frequency sweep rate (14 Hz/s) to ensure that the nuclear system remains in steady state. Each resonance has three peaks as a result of a crystal strain field interacting with the quadrupole moment of an isotope with spin .Abragam (1961); Guerrier and Harley (1997) We have verified for each isotope and for several angles that the satellite peaks have a difference in frequency relative to the central peak that is in agreement with the standard formula for quadrupolar splitting in an single uniaxial electric field gradient oriented along the direction perpendicular to the Fe/GaAs interface:
| (32) |
where is the electric quadrupole moment of isotope , is the magnetic quantum number, and is the nuclear spin.Slichter (1963) Fits of the resonance curves assuming a triple Lorentzian model are shown as solid lines in Fig. 6. The Knight shift is determined from the frequency of the central peak measured as a function of the bias current, which determines the electron spin polarization.
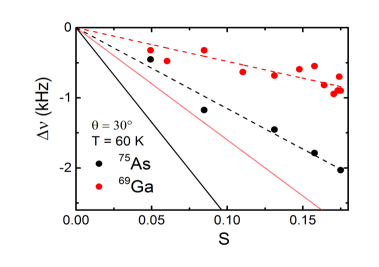
The Knight shift is measured at an angle of . This nearly doubles the frequency shift relative to the data in Fig. 6. Figure 7 shows the resonance frequency taken from fits of NMR curves of and as a function of the electron spin measured by spin transport. The Knight shift was not measured for because at high angles becomes smaller than the NMR line width, making an accurate fit of the resonance frequency impossible.
In an all-electrical spin transport experiment, the spin polarization is directly proportional to the magnitude of the non-local spin signal
| (33) |
where is the spin detection efficiency of the Fe/GaAs interface at zero bias and is the density of states at the Fermi level normalized by the carrier density in the GaAs channel.Hu et al. (2011); Salis et al. (2009, 2010) For Fe/GaAs interfaces the detection efficiency has been measured to be in spin-LED’s.Adelmann et al. (2005) The lines shown in Fig. 7 are the expected Knight shifts determined from Eq. 29, with the non-local electron spin polarization determined from Eq. 33 and extrapolating the measured polarization back to the injector.
As can be seen in Fig. 7, the absolute magnitudes of the Knight shifts predicted by Eq. 29 are larger than the experimental values by a factor of . The measured ratio of the shifts is approximately 2.4 in experiment, while the expected ratio is 1.7. Given the limitations of the experiment, we do not believe that these discrepancies are that significant. The absolute electron spin polarization is impacted by uncertainties in as well as the fact that the density-of-states used in applying Eq. 33 is assumed to be that of an ordinary parabolic conduction band with an effective mass . We estimate that systematic errors in are of the order of 50%. In any case, the maximum value of inferred from Eq. 33 is , which corresponds to a polarization , which we consider an upper bound given the the known spin polarization of iron. Any reduction in would improve the agreement in Fig. 7, and we conclude that the value extracted from transport is probably too large by a factor of approximately two. As expected, the Knight shift for is smaller than for . The ratio of the shifts for the two isotopes is very sensitive to the values of the quadrupole radii calculated from Eq. 24, which was based on several assumptions. This would easily account for the discrepancy in the observed ratio. In summary, we consider the qualitative agreement in Fig. 7, including the sign of the Knight shift, the linearity with , and the relative magnitudes of the shifts for the two isotopes, to be satisfactory.
VI Summary
We have provided a quantitative description of NMR in Fe/n-GaAs lateral spin valve devices by exploiting the strong hyperfine coupling at these dopings. We have shown that the occupation fraction of donors can be estimated from charge transport. The competition between hyperfine coupling and the quadrupolar nuclear relaxation rate leads to a spatially inhomogeneous nuclear polarization that is strongest near donors. The magnitude of the NMR signal of each isotope is directly proportional to the effective volume of polarized nuclear spins around donor sites. We also showed that within this volume the nuclei are directly affected by the presence of the Knight field. Finally, we measured the Knight shifts of the nuclear resonance frequencies as a function of the spin-accumulation. Using the calculated occupation factor, we show that the Knight shift is proportional the spin accumulation as measured by spin transport.
This work was supported by NSF Grants No. DMR-1104951, the NSF MRSEC Program under DMR DMR-0819885, and by C-SPIN, one of the six centers of STARnet, a Semiconductor Research Corporation program sponsored by MARCO and DARPA.
References
- Paget et al. (1977) D. Paget, G. Lampel, B. Sapoval, and V. I. Safarov, Phys. Rev. B 15, 5780 (1977).
- Salis et al. (2009) G. Salis, A. Fuhrer, and S. F. Alvarado, Phys. Rev. B 80, 115332 (2009).
- Chan et al. (2009) M. K. Chan, Q. O. Hu, J. Zhang, T. Kondo, C. J. Palmstrøm, and P. A. Crowell, Phys. Rev. B 80, 161206 (2009).
- Kölbl et al. (2012) D. Kölbl, D. M. Zumbühl, A. Fuhrer, G. Salis, and S. F. Alvarado, Phys. Rev. Lett. 109, 086601 (2012).
- Dzhioev et al. (2002) R. I. Dzhioev, K. V. Kavokin, V. L. Korenev, M. V. Lazarev, B. Y. Meltser, M. N. Stepanova, B. P. Zakharchenya, D. Gammon, and D. S. Katzer, Phys. Rev. B 66, 245204 (2002).
- Lou et al. (2006) X. Lou, C. Adelmann, M. Furis, S. A. Crooker, C. J. Palmstrøm, and P. A. Crowell, Phys. Rev. Lett. 96, 176603 (2006).
- Lou et al. (2007) X. Lou, C. Adelmann, S. A. Crooker, E. S. Garlid, J. Zhang, K. S. M. Reddy, S. D. Flexner, C. J. Palmstrøm, and P. A. Crowell, Nat. Phys. 3, 197 (2007).
- Romero et al. (1990) D. Romero, S. Liu, H. D. Drew, and K. Ploog, Phys. Rev. B 42, 3179 (1990).
- Intronati et al. (2012) G. A. Intronati, P. I. Tamborenea, D. Weinmann, and R. A. Jalabert, Phys. Rev. Lett. 108, 016601 (2012).
- Lampel (1968) G. Lampel, Phys. Rev. Lett. 20, 491 (1968).
- Abragam (1961) A. Abragam, The Principles of Nuclear Magnetism, edited by N. Mott (Oxford U.P., 1961).
- Overhauser (1953) A. W. Overhauser, Phys. Rev. 92, 411 (1953).
- Hanbicki et al. (2003) A. T. Hanbicki, O. M. J. van ’t Erve, R. Magno, G. Kioseoglou, C. H. Li, B. T. Jonker, G. Itskos, R. Mallory, M. Yasar, and A. Petrou, Appl. Phys. Lett. 82 (2003).
- Chan (2010) M. K. Chan, Hyperfine Effects in Ferromagnet-Semiconductor Heterostructures, Ph.D. thesis, UMN-Twin Cities (2010).
- Tran et al. (2009) M. Tran, H. Jaffrès, C. Deranlot, J.-M. George, A. Fert, A. Miard, and A. Lemaître, Phys. Rev. Lett. 102, 036601 (2009).
- Salis et al. (2010) G. Salis, A. Fuhrer, R. R. Schlittler, L. Gross, and S. F. Alvarado, Phys. Rev. B 81, 205323 (2010).
- Meier and Zakharchenya (1984) F. Meier and B. Zakharchenya, eds., Optical Orientation, Modern Problems in Condensed Matter Sciences, Vol. 8 (North Holland, New York, 1984).
- Van Dorpe et al. (2005) P. Van Dorpe, W. Van Roy, J. De Boeck, and G. Borghs, Phys. Rev. B 72, 035315 (2005).
- Paget (1981) D. Paget, Phys. Rev. B 24, 3776 (1981).
- Shklovskii and Efros (1984) B. Shklovskii and A. Efros, Electronic Properties of Doped Semiconductors (Springer, 1984).
- Dyakonov and Perel’ (1973) M. Dyakonov and V. Perel’, Zh. Eskp. Teor. Fiz. 65, 362 (1973).
- Gammon et al. (2001) D. Gammon, A. L. Efros, T. A. Kennedy, M. Rosen, D. S. Katzer, D. Park, S. W. Brown, V. L. Korenev, and I. A. Merkulov, Phys. Rev. Lett. 86, 5176 (2001).
- Szmyd et al. (1990) D. M. Szmyd, M. C. Hanna, and A. Majerfeld, Journal of Applied Physics 68, 2376 (1990).
- Jacoboni (2010) C. Jacoboni, Theory of Electronic Transport in Semiconductors (Springer, 2010).
- Lancefield et al. (1987) D. Lancefield, A. R. Adams, and M. A. Fisher, J. Appl. Phys. 62, 2342 (1987).
- Fritzsche (1955) H. Fritzsche, Phys. Rev. 99, 406 (1955).
- Nishimura (1965) H. Nishimura, Phys. Rev. 138, A815 (1965).
- Davis and Compton (1965) E. A. Davis and W. D. Compton, Phys. Rev. 140, A2183 (1965).
- Woodbury and Blakemore (1973) D. A. Woodbury and J. S. Blakemore, Phys. Rev. B 8, 3803 (1973).
- Agrinskaya et al. (2010) N. Agrinskaya, V. Kozub, and D. Poloskin, Semiconductors 44, 472 (2010).
- Erginsoy (1950) C. Erginsoy, Phys. Rev. 79, 1013 (1950).
- Honig (1966) A. Honig, Phys. Rev. Lett. 17, 186 (1966).
- Maxwell and Honig (1966) R. Maxwell and A. Honig, Phys. Rev. Lett. 17, 188 (1966).
- Kozhevnikov et al. (1995) M. Kozhevnikov, B. M. Ashkinadze, E. Cohen, and A. Ron, Phys. Rev. B 52, 17165 (1995).
- Hertz (1909) P. Hertz, Math. Ann. 67, 387 (1909).
- McNeil and Clark (1976) J. A. McNeil and W. G. Clark, Phys. Rev. B 13, 4705 (1976).
- Lide (2000) D. P. Lide, ed., CRC Handbook of Chemistry and Physics, 81st ed. (CRC PRESS, 2000).
- Paget et al. (2008) D. Paget, T. Amand, and J.-P. Korb, Phys. Rev. B 77, 245201 (2008).
- Guerrier and Harley (1997) D. J. Guerrier and R. T. Harley, Appl. Phys. Lett. 70, 1739 (1997).
- Slichter (1963) C. P. Slichter, Principles of magnetic resonance (Harper & Row, New York, 1963).
- Hu et al. (2011) Q. O. Hu, E. S. Garlid, P. A. Crowell, and C. J. Palmstrøm, Phys. Rev. B 84, 085306 (2011).
- Adelmann et al. (2005) C. Adelmann, X. Lou, J. Strand, C. J. Palmstrøm, and P. A. Crowell, Phys. Rev. B 71, 121301 (2005).