11email: miroslava.dessauges@unige.ch, daniel.pfenniger@unige.ch 22institutetext: Observatoire de Paris, LERMA, 61 Av. de l’Observatoire, 75014 Paris, France
22email: celia.verdugo@obspm.fr, francoise.combes@obspm.fr
CO map and steep Kennicutt-Schmidt relation in the extended UV disk of M63 ††thanks: Based on observations carried out with the IRAM 30 m telescope. IRAM is supported by INSU/CNRS (France), MPG (Germany), and IGN (Spain).
Results from the UV satellite GALEX revealed surprisingly large extensions of disks in some nearby spiral galaxies. While the H emission, the usual tracer of star formation, drops down at the border of the isophotal radius, , the UV emission extends out to 3 to 4 times this radius and often covers a significant fraction of the H I area. M63 is a remarkable example of a spiral galaxy with one of the most extended UV disks, so it offers the opportunity to search for the molecular gas and characterize the star formation in outer disk regions as revealed by the UV emission. We obtained deep CO(1–0) and CO(2–1) observations on the IRAM 30 m telescope along the major axis of the M63 disk from the center out to the galactocentric radius and over a bright UV region at . CO(1–0) is detected all along the M63 major axis out to , and CO(2–1) is confined to , which may betray lower excitation temperatures in the outer disk. CO(1–0) is also detected in the external bright UV region of M63. This is the fourth molecular gas detection in the outskirts of nearby spirals. The radial profiles of the CO emission and of the H, 24 m, NUV and FUV star formation tracers and H I taken from the literature show a severe drop with the galactocentric radius, such that beyond they are all absent with the exception of a faint UV emission and H I. The CO emission detection in the external UV region, where the UV flux is higher than the UV flux observed beyond , highlights a tight correlation between the CO and UV fluxes, namely the amount of molecular gas and the intensity of star formation. This external UV region is dominated by the atomic gas, suggesting that H I is more likely the precursor of H2 rather than the product of UV photodissociation. A broken power law needs to be invoked to describe the Kennicutt-Schmidt (K-S) relation of M63 from the center of the galaxy out to . While all along the major axis out to the K-S relation is almost linear (with a slope of nearly 1 in log space), in the external UV region the SFR regime is highly nonlinear and characterized by a steep K-S relation (with a slope much higher than 1 in log space) and very low star formation efficiency.
Key Words.:
Galaxies: star formation – Ultraviolet: galaxies – Galaxies: ISM – Submillimeter: ISM – Galaxies: evolution1 Introduction
The study of star formation in the outer regions of disks of normal spiral galaxies has gained interest in the past few years, mainly because they are low-metallicity environments (Henry & Worthey 1999), resembling the conditions of early stages of spiral galaxies and high-redshift galaxies. These regions are also known to have low star formation rates (Dong et al. 2008; Bigiel et al. 2010; Alberts et al. 2011). Moreover, there is growing evidence of cold gas accretion in the local Universe, both through the arrival and merging of gas-rich satellites and through gas infall from the intergalactic medium. This new gas could be deposited in the outer regions of galaxies and form reservoirs for replenishing the inner parts and feeding star formation (Sancisi et al. 2008), making outer regions good laboratories for scanning the interface between galaxies and the surrounding intergalactic gas.
With its 1.25 degree field of view and sensitivity to stellar populations younger than a few hundred Myr, the UV satellite GALEX (Galaxy Evolution Explorer) is well suited to address the question of star formation in spiral galaxies at large galactocentric radii. Recent star formation within such environments was detected in H (the principal star formation tracer over the years) and broad-band observations for a few galaxies: NGC 628, NGC 1058, NGC 6946 (Ferguson et al. 1998), M31 (Cuillandre et al. 2001), and NGC 6822 (de Blok & Walter 2003). However, the GALEX far-UV (FUV) and near-UV (NUV) data demonstrate that H observations still fail to detect a significant population of moderate-age stars in the outermost disks of spiral galaxies, since H traces more recent star formation episodes. Indeed, UV-bright disks extending up to 3 to 4 times the optical radius have been reported in about 30% of spiral galaxies, with the most remarkable examples: M63, M83, NGC 2841, and NGC 4625 (Thilker et al. 2005; Gil de Paz et al. 2005, 2007). These extended UV emission (XUV) disks cover a significant fraction of the area detected at 21 cm wavelength, with some correspondence between the position of the brightest UV complexes and peaks in the atomic gas distribution. The measured colors are generally consistent with young populations of O, and predominantly B stars, characterized by ages from a few Myr up to 400 Myr.
The confirmed occurrence of recent and ongoing star formation in the outer disks of normal spiral galaxies has several important implications. First, it supports the presence of molecular gas in the outskirts of spirals, since stars are formed within molecular clouds. Second, this suggests the presence of large reservoirs of hydrogen in the form of H2, which may contribute to the baryonic dark matter of spiral galaxies. Third, it offers the ideal place to study the unresolved issue of the atomic hydrogen gas origin: is H I mainly a product of the star formation process; i.e., does it result from the photodissociation of H2 by the UV flux radiation emanated from newly formed stars (Allen et al. 1986, 2004; Smith et al. 2000), rather than mainly being a precursor to it? Fourth, the presence of recently formed stellar complexes at large galactocentric radii also provides a simplified laboratory for determining the star formation threshold, namely the minimum gas surface density required for star formation to occur spontaneously (Kennicutt 1989; Martin & Kennicutt 2001). Fifth, it allows investigating the star formation in quiescent and low-metallicity environments that may affect the star formation density and the initial mass function.
In this paper we aim to detect the molecular gas expected in the outskirts of spiral galaxies because of the star formation discovered from the XUV observations. The M63 spiral galaxy, known to have an XUV disk, is selected for this work. The search for molecular gas in galaxies is difficult, since we cannot detect cold H2 directly. Instead, the second most common molecule, CO, is used as a proxy. Molecular gas has been detected in many galaxies from the mapping of the CO emission. It is now well established that the CO emission is the strongest in the central regions of spiral galaxies (e.g., Young & Scoville 1991), but then falls off, as does the blue stellar light, with the galactocentric radius (e.g., Young & Scoville 1982; Young et al. 1995). The questions “is this CO emission drop real, or does it reflect the difficulty of detecting the molecular gas in the outer regions of spiral galaxies” remain open. For example, CO emission lines are known to be weaker in media characterized by low metallicities, low gas temperatures, low excitations, and low gas densities, even if substantial molecular gas is present (e.g., Allen 1996; Combes & Pineau Des Forets 2000), and thus in media that may well be potentially representative of outer disk regions.
Schruba et al. (2011) used a very effective stacking technique on HERACLES CO(2–1) data of nearby spiral galaxies, where they stack CO spectra across many sightlines by assuming that the mean H I and CO velocities are similar, to highlight the presence of the faintest CO emission. They focused their analysis on data stacked in bins of galactocentric radius and found that the CO radial profile follows a remarkably uniform exponential decline with a scale length of . But even though this has been shown to be a very effective technique, it still fails to detect CO in the farthest out regions of galactic disks, where they only reach upper limits. Specific very deep CO observations are thus required to trace the molecular gas in the outer disk regions of spiral galaxies, which is precisely the objective of this work.

In Sect. 2 we present the characteristics of the M63 spiral galaxy, selected for deep CO observations in the outer disk regions. We qualify the advantages of M63 in the context of XUV galaxies and cite the previous works done on M63. In Sect. 3 we describe the CO observations performed on the IRAM 30 m telescope and show the corresponding results in Sect. 4. In Sect. 5 we discuss the radial profiles obtained for the acquired CO measurements in comparison to other star formation tracers (FUV, NUV, H, 24 m) and H I, and investigate the Kennicutt-Schmidt relations across the galaxy and beyond the optical radius. Summary and conclusions are given in Sect. 6. Throughout the paper we adopt the “standard” Galactic CO(1–0)-to-H2 conversion factor (Dickman et al. 1986) and include a correction for helium.
| CO(1–0) | CO(2–1) | ||||||||||
|---|---|---|---|---|---|---|---|---|---|---|---|
| Time | rmsa𝑎aa𝑎aRms noises at, respectively, 3 mm and 1 mm, measured per channel of and . The values marked with correspond to rms noises measured per smoothed channel of and , respectively. | FWHMb𝑏bb𝑏bFull widths at half maximum of, respectively, CO(1–0) and CO(2–1) lines as determined from fitting Gaussian profiles. | c𝑐cc𝑐cIntegrated CO(1–0) and CO(2-1) line fluxes as determined from fitting Gaussian profiles. The values marked with correspond to potentially less reliable measurements, because of a CO line detection at only. Upper limits are and are calculated assuming a line width. | rmsa𝑎aa𝑎aRms noises at, respectively, 3 mm and 1 mm, measured per channel of and . The values marked with correspond to rms noises measured per smoothed channel of and , respectively. | FWHMb𝑏bb𝑏bFull widths at half maximum of, respectively, CO(1–0) and CO(2–1) lines as determined from fitting Gaussian profiles. | c𝑐cc𝑐cIntegrated CO(1–0) and CO(2-1) line fluxes as determined from fitting Gaussian profiles. The values marked with correspond to potentially less reliable measurements, because of a CO line detection at only. Upper limits are and are calculated assuming a line width. | d𝑑dd𝑑dCO luminosity ratios defined as , needed to correct the lower Rayleigh-Jeans brightness temperature of the 2–1 transition relative to 1–0. We would like, however, to stress that CO(1–0) and CO(2–1) do not exactly map the same regions, because the CO(1–0) beam area equals the CO(2–1) beam area. The CO luminosity is calculated using the formula (3) from Solomon et al. (1997). | e𝑒ee𝑒eH2 masses calculated from the CO(1–0) luminosity and by adopting the “standard” Galactic CO-to-H2 conversion factor, (Dickman et al. 1986). The applied formula is: , where a factor of 1.36 is included to account for helium. | f𝑓ff𝑓fH2 surface densities calculated from the integrated CO(1–0) line flux and by adopting the CO-to-H2 conversion factor given under (e). The applied formula is: , where is the inclination of M63 (Leroy et al. 2008). | ||
| () | () | (min) | (mK) | (km s-1) | (K km s-1) | (mK) | (km s-1) | (K km s-1) | () | () | |
| 0 | 0 | 31 | 0.24 | ||||||||
| 22 | 0.06 | 8 | 0.16 | ||||||||
| 44 | 0.12 | 8 | 0.17 | ||||||||
| 66 | 0.19 | 8 | 0.13 | ||||||||
| 88 | 0.25 | 8 | 0.17 | ||||||||
| 110 | 0.31 | 8 | 0.20 | ||||||||
| 132 | 0.37 | 8 | 0.16 | ||||||||
| 154 | 0.44 | 23 | 0.15 | ||||||||
| 176 | 0.50 | 23 | 0.16 | ||||||||
| 198 | 0.56 | 23 | 0.14 | ||||||||
| 220 | 0.62 | 31 | |||||||||
| 242 | 0.68 | 101 | 0.17 | ||||||||
| 264 | 0.75 | 101 | |||||||||
| 286 | 0.81 | 55 | |||||||||
| 308 | 0.87 | 47 | |||||||||
| 330 | 0.93 | 63 | 0.14 | ||||||||
| 352 | 0.99 | 155 | 0.38 | ||||||||
| 374 | 1.06 | 109 | |||||||||
| 396 | 1.12 | 117 | |||||||||
| 418 | 1.18 | 93 | |||||||||
| … | … | ||||||||||
| 473 | 1.34 | 381 | |||||||||
2 M63 characteristics
Classified as SA(rs)bc and located at 10.1 Mpc (Leroy et al. 2009), M63 (or NGC5055) looks like a typical spiral galaxy, representative of a large class of local spirals, with no immediate neighbour, which excludes the potentiality of a galaxy in interaction. However, M63 is not very ordinary, since it is a remarkable example of a nearby spiral with a bright and XUV disk. In Fig. 1 we show the GALEX NUV and FUV color-composite image of M63, where an extensive population of UV-bright star-forming regions and stellar clusters (tracing the O and B stars) is revealed. The M63 NUV and FUV surface-brightness profiles show a smooth decrease in the UV emission out to in the equivalent radius (defined as the square root of the product of the half-minor axis times the half-major axis), namely out to 2.5 times the optical equivalent radius (Gil de Paz et al. 2007). The major axis radius of the -band isophote, the so-called isophotal radius, is equal to kpc in M63. About 30% of local spiral galaxies have XUV disks as compared to their optical disks, among which M63 is one of the most extreme cases (Thilker et al. 2005; Gil de Paz et al. 2005, 2007). A metallicity gradient of was reported by Moustakas et al. (2010) for the calibration of Pilyugin & Thuan (2005), which gives for the central metallicity of M63.
The 21 cm observations of M63 also show the presence of a very large, warped gaseous disk extending out to 40 kpc in the major axis radius (e.g., Battaglia et al. 2006). The warp starts around and is exceptionally extended and symmetric. The measured H I column densities are higher than up to 70% of the XUV disk. These high H I column densities plus the extended UV emission, both suggest the presence of molecular gas out to large galactocentric radii. Indeed, recent studies have demonstrated that strong H I emission is on average a good tracer of regions rich in molecular gas (e.g., Crosthwaite et al. 2002; Nieten et al. 2006), and the extended UV emission undeniably betrays the presence of relatively young stars, hence of the molecular gas necessary for their formation.
Molecular gas was looked for in M63 in the context of the BIMA/SONG survey, the first systematic imaging survey of CO(1–0) emission from the centers and disks of nearby galaxies (Helfer et al. 2003, see their Fig. 43). The reported high-resolution CO measurements are confined to the very central area of the M63 optical disk, along the major axis, because of the lack of sensitivity of these data at the border of the map with a primary beam gain drop by a factor of 2. Single-dish spectra from the FCRAO Extragalactic CO Survey (Young et al. 1995, see their Fig. 87), despite their moderate sensitivity and low resolution, show that the CO emission extends over a larger area than mapped by BIMA/SONG, reaching a two times larger galactocentric radius, but still not extending up to the optical disk limit . The signal measured at is equal to , which leaves room for a CO line flux decrease by a factor of 10 to 20 in the outermost XUV disk (depending on the CO line width), when aiming at signals as weak as 10 mK, or weaker, in these extreme regions. More recently, Leroy et al. (2009) mapped the CO(2–1) line in M63 over the full optical disk, as part as the HERACLES survey on the IRAM 30 m telescope, and obtained reliable measurements out to .
| CO(1–0) | CO(2–1) | ||||||||||
|---|---|---|---|---|---|---|---|---|---|---|---|
| Offsets | Time | rmsa𝑎aa𝑎aRms noises at, respectively, 3 mm and 1 mm, measured per channel of and . | FWHMb𝑏bb𝑏bFull widths at half maximum of, respectively, CO(1–0) and CO(2–1) lines as determined from fitting Gaussian profiles. | c𝑐cc𝑐cIntegrated CO(1–0) and CO(2-1) line fluxes as determined from fitting Gaussian profiles. The value marked with corresponds to a potentially less reliable measurement, because of the CO line detection at barely . Upper limits are and are calculated assuming a line width. | rmsa𝑎aa𝑎aRms noises at, respectively, 3 mm and 1 mm, measured per channel of and . | FWHMb𝑏bb𝑏bFull widths at half maximum of, respectively, CO(1–0) and CO(2–1) lines as determined from fitting Gaussian profiles. | c𝑐cc𝑐cIntegrated CO(1–0) and CO(2-1) line fluxes as determined from fitting Gaussian profiles. The value marked with corresponds to a potentially less reliable measurement, because of the CO line detection at barely . Upper limits are and are calculated assuming a line width. | d𝑑dd𝑑d | e𝑒ee𝑒e | f𝑓ff𝑓fCO luminosity ratios, H2 masses, and H2 surface densities, respectively, calculated using the same prescriptions as in Table 1. | |
| () | () | (min) | (mK) | (km s-1) | (K km s-1) | (mK) | (km s-1) | (K km s-1) | () | () | |
| 0 | 118 | ||||||||||
| +22 | 117 | ||||||||||
| 0 | 186 | ||||||||||
| +22 | 164 | ||||||||||
| 0 | 171 | ||||||||||
| +22 | 148 | ||||||||||
| 0 | 0 | 164 | |||||||||
| 0 | +22 | 148 | |||||||||
| +22 | 0 | 123 | |||||||||
| +22 | +22 | 116 | |||||||||
| +44 | 0 | 63 | |||||||||
| +44 | +22 | 62 | |||||||||
| all offsets | 1932 | ||||||||||
3 Observations and data reduction
The CO observations were performed with the IRAM 30 m millimeter-wave telescope at Pico Veleta, Spain, during a first run on September 10–17, 2007 under poor weather conditions, and during a second run on November 2, 16, and 27 and December 1, 2007 under good-to-excellent weather conditions. We used four single-pixel heterodyne receivers, simultaneously, two centered on the 12CO(1–0) line at 115.271 GHz, and two on the 12CO(2–1) line at 230.538 GHz. The telescope half-power beam widths at these two frequencies are and , respectively. The data were recorded using the VESPA autocorrelator with 640 MHz bandwidth and 1.25 MHz resolution at 3 mm, and two 1 MHz filter banks (512 channels each) at 1 mm. The resulting velocity coverage at 115.271 GHz is with a spectral resolution of . The corresponding values at 230.538 GHz are and .
First, we performed a CO mapping along the major axis of the M63 disk from the center of the galaxy located at (J2000) , out to the galactocentric radius by aligning 27 single pointings with a spatial sampling of in the radial direction sustaining a position angle . Second, we mapped a bright UV region in the outer regions of the M63 disk centered on (J2000) , and located at the galactocentric radius with pointings following the sequence from (; ) to (; ) offsets relative to the central coordinates with a spatial sampling in the right-ascension direction and the same in the declination direction. In Fig. 1 we show the false-color GALEX image of M63 on top of which the regions targeted for CO emission are plotted. Observations were performed in wobbler-switching mode with the maximum symmetrical azimuthal wobbler throw of allowed, corresponding to 11.8 kpc in projected distance for this spiral galaxy located at a distance of 10.1 Mpc. The total on-source exposure time obtained per pointing in the M63 disk map and the UV region map is listed in Tables 1 and 2 (column 3), respectively. Only scans with a system temperature lower than 400 K at 3 mm were retained for analysis.
The data were reduced with the CLASS software from the GILDAS package. All the spectra obtained with the two receivers tuned on the 12CO(1–0) line and corresponding to scans at the same pointings were summed up without any smoothing. On the other hand, the spectra obtained with the two receivers tuned on the 12CO(2–1) line were first Hanning-smoothed to a resolution of , since the expected average CO line full width half maximum is approximately , before being summed up when corresponding to scans at the same pointings. No baseline subtraction was performed on individual spectra before summing because we simply did a linear sum. In Tables 1 and 2 (columns 4 and 7), we list the achieved rms in mK at 3 mm and 1 mm for each pointing of the M63 disk map and the UV region map, respectively333The efficiencies of the ABCD receivers on the IRAM 30 m telescope are at 3 mm and at 1 mm (see the online IRAM wiki pages at http://www.iram.es/IRAMES/mainWiki/Iram30mEfficiencies).. These rms values were obtained with a baseline subtraction of degree 0 and with windows set to , both at 3 mm and 1 mm, as defined by the velocity positions of detected CO(1–0) and CO(2–1) lines444Except for the very few inner pointings at , , and , for which a larger window was set, given the larger widths of the CO(1–0) and CO(2–1) lines.. At 3 mm we obtained on average rms values between 4 mK and 21 mK in the M63 disk map, while for seven pointings around the isophotal radius, , and for all the pointings of the UV region map, we pushed the rms limit down to 4 mK to 7 mK.
4 Results
As summarized in Sect. 2, the CO(1–0) and CO(2–1) lines were previously mapped over the full optical disk of M63 in the context of various CO surveys of nearby galaxies. However, none of these observations reaches the sensitivity of our data, in particular around the isophotal radius, , and beyond. High sensitivity can be achieved by mapping CO through individual beam pointings, which is a technique that proves to be very efficient for obtaining deep observations of specific, not extended, areas of a galaxy.
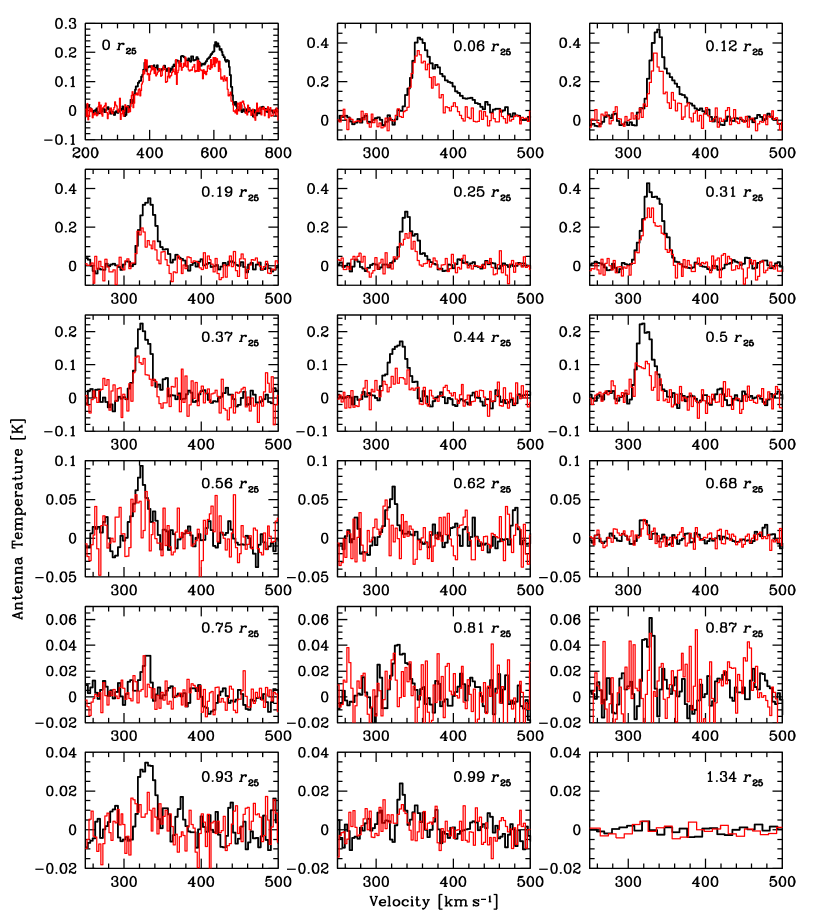
The results of our CO emission mapping of M63 along the major axis of its disk and over the bright UV region at are presented in Tables 1 and 2, respectively. We provide the CO(1–0) and CO(2–1) line full widths half maximum, FWHM (columns 5 and 8) and the integrated CO(1–0) and CO(2–1) line fluxes (columns 6 and 9) at each pointing of the mapping, as determined from fitting Gaussian functions to the CO profiles obtained by summing up all spectra corresponding to all scans per pointing. The CO(1–0) and CO(2–1) line FWHM are in the range from to and from to , respectively. They are greater than those expected for individual giant molecular clouds (GMCs) that have typical line widths of (Solomon et al. 1987), except for a few pointings around and over the UV region. This implies that mostly an ensemble of molecular clouds is emitting per beam of 1 kpc and 0.5 kpc at 3 mm and 1 mm, respectively. In Tables 1 and 2 we also list the molecular gas masses per pointing (column 11), as derived using the “standard” Galactic CO(1–0)-to-H2 conversion factor (Dickman et al. 1986) and including a correction factor of 1.36 for helium. The inferred masses are in the range . Figure 2 shows the summed-up spectra of all scans per pointing of the M63 disk map along the major axis, while Fig. 3 shows the resulting spectrum obtained by summing up all spectra of all scans at the 12 pointings used to map the external UV region.

The radial mapping (Fig. 2) clearly shows a detection of the CO(1–0) emission out to the galactocentric radius , namely out to the isophotal radius . A severe drop in the CO flux is nevertheless observed as a function of the galactocentric radius. Beyond and out to , the limit of our CO search along the M63 major axis, no CO emission is detected anymore (Table 1). Even by summing up all the spectra corresponding to all scans at the ten outermost pointings and by smoothing the resulting spectrum to a resolution of , i.e., similar to the typical FWHM of CO(1–0) lines detected at the outermost pointings, no CO emission is observed. We do, however, derive a stringent upper limit on the integrated CO(1–0) line flux at of , when assuming a line width of . This is equivalent to a molecular gas mass of . On the other hand, the CO(2–1) emission is securely detected only out to , i.e., , in agreement with the CO(2–1) mapping by Leroy et al. (2009), while there are two very tentative detections at at the pointings and (Table 1). The CO(2–1) line thus appears to be excited over about 2/3 of the optical disk. The corresponding CO luminosity ratios, , can be found in Table 1 (column 10). They vary randomly between 0.13 and 0.24 (in the center of M63) along the galactocentric radius, without showing any radial evolution. The absence of any clear detection of the CO(2–1) line beyond suggests that the subthermal excitation sets in around this galactocentric radius. However, this has to be considered with caution because the major axis pointings probe only a small portion of the M63 disk at each radius and the Leroy et al. (2009) CO(2–1) map of the entire M63 disk is not very deep and because there seems still to be plenty of star-forming regions at with high enough densities (locally) to thermalize the CO(2–1) line (see Fig. 1).
Whereas our survey for CO emission along the major axis of the M63 disk seems to indicate that the molecular gas is confined to the isophotal radius of the galaxy, we find a convincing CO(1–0) detection in the selected bright UV region at . The sum of all spectra corresponding to all scans at the 12 pointings used to map the UV region leads to a CO(1–0) detection at with an integrated line flux (Fig. 3). This corresponds to a molecular gas mass of . The CO(1–0) emission appears to be maximal at the offset (; ), where it is detected at (Table 2). The CO(2–1) emission is, on the other hand, not detected down to an integrated line flux , obtained when summing up all the spectra corresponding to all scans at the 12 pointings.
5 Discussion
A few hundred nearby galaxies have been the object of intensive surveys for molecular gas (e.g., Young & Scoville 1991; Young et al. 1995; Helfer et al. 2003; Leroy et al. 2009). However, for only a very few have deep CO searches in their outer disk regions been undertaken. Here, we show the existence of molecular gas up to the isophotal radius, , and beyond in the nearby spiral galaxy M63. This is the fourth such a detection of molecular gas in the outskirts after the spiral galaxies NGC 4414 (Braine & Herpin 2004), NGC 6946 (Braine et al. 2007), and M33 (Braine et al. 2010). To analyze the impact of our observations in the context of star formation in the outer disk of M63, we present the radial profiles of our CO observations along with complementary data of other star formation tracers (FUV, NUV, H, 24 m) and H I, and we investigate the behavior of the Kennicutt-Schmidt relations across the galaxy and beyond in the bright UV region. Characterizing the Kennicutt-Schmidt relation in the outer disk regions, namely in environments with low metallicities, gas temperatures, excitations, and gas densities, which are all properties hostile to star formation, is our main interest.
| Band or line | Telescope | FWHM | Reference |
| () | |||
| CO(2–1) | IRAM | 13.4 | Leroy et al. (2009) |
| FUV | GALEX | 4.3 | Gil de Paz et al. (2007) |
| NUV | GALEX | 5.3 | Gil de Paz et al. (2007) |
| H | KPNO | 0.38 | Kennicutt et al. (2008) |
| 24 m | Spitzer | 6 | Dale et al. (2009) |
| H I (21 cm) | VLA | 6 | Walter et al. (2008) |
5.1 Radial profiles
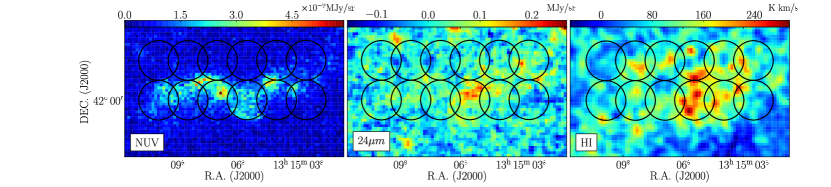
To compare the CO distribution in M63 along the major axis of its disk to H I and other star formation tracers’ distributions, we built comparative radial profiles of the CO, H I, FUV, NUV, H, and 24 m emission. Altogether they provide a complete view of the past and ongoing star formation that took or takes place in the galaxy and of the ingredients needed to sustain the star formation: molecular and atomic gas. The respective data are taken from the literature and are described in Table 3. In Fig. 4 we show the multiwavelength views of the bright UV region at with, from left to right, the NVU, 24 m, and H I 21 cm emission.
As these data were obtained with different instruments and hence at various FWHM resolutions, we first convolved all these data to the resolution of our CO(1–0) data which is equal to the half-power beam width of the IRAM 30 m telescope at 3 mm, i.e., . The images were then rotated by in a north-to-west direction to have the major axis in the horizontal axis, and deprojected by correcting for a inclination angle to bring the galaxy face-on. Finally, we did aperture photometry on these processed images with apertures of diameter using the ‘qphot’ task of the ‘digiphot.apphot’ package of IRAF555IRAF is distributed by the National Optical Astronomy Observatories, which are operated by the Association of Universities for Research in Astronomy, Inc., under cooperative agreement with the National Science Foundation., and we subtracted an average sky value measured away from the galaxy. The photometric measurements were performed at the 27 positions of the radial cut along the M63 major axis used for the CO radial mapping, as well as at the 12 positions used to map CO in the external bright UV region, following the same spacing and pointings exactly.
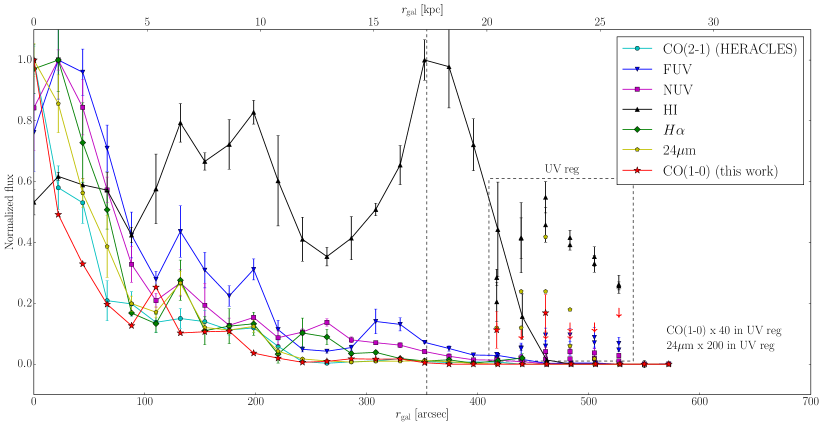
The resulting CO(1–0), CO(2–1), FUV, NUV, H I, H, and 24 m radial profiles along the M63 radial cut are shown in Fig. 5 (connected data points), where the measured fluxes are plotted in a normalized flux scale to allow relative comparisons. All the profiles nicely follow the spiral structure observed at galactocentric radii , 200, and probably . They all show a severe drop with the galactocentric radius, except the profile of the atomic gas, which shows a completely different behavior. We observe that close to the limit, the star formation tracers and CO begin to vanish considerably, and beyond the limit, they all are practically absent with the exception of the faint UV emission. The H I emission is very strong beyond the limit. This shows the importance of looking for molecular gas beyond the optical limit, where evidence of star formation is clearly brought by the UV emission.
While the CO emission is not detected beyond the limit in the M63 major axis map, it is again detected in the external UV region at . The corresponding CO(1–0) fluxes, multiplied by a factor of 40 to make them visible (showing the depth of our data), with H I and other star formation tracer fluxes as measured in the UV region, are also shown in Fig. 5. The FUV and NUV emissions are observed in all pointings over the external UV region, while the H emission is undetected and a faint 24 m emission, whose fluxes were multiplied by a factor of 200 to make them visible, is observed in only eight pointings (see also Fig. 4). It is interesting to point out that the FUV and NUV fluxes in the external UV region are similar to those at the pointing at , the galactocentric limit where CO is still detected along the M63 major axis. Beyond , the FUV and NUV fluxes decrease and get weaker than in the external UV region. This suggests a tight correlation between the UV flux, namely the intensity of star formation and the CO flux that should trace the amount of molecular gas, since the CO emission starts to be detected at a given UV flux level. If correct, the CO emission is not detected beyond along the major axis mapping simply because the amount of CO, corresponding to the molecular gas needed to sustain the star formation that is taking place there, falls below our detection threshold. Consequently, it is likely that molecular gas is present in the outer regions of the M63 disk at least as long as the XUV is present.
| This work | Bigiel et al. 2008 | ||||||||||
| Radial cut out to | UV region at | Radial cut out to | |||||||||
| -1.93 | 1.06 | 0.29 | 0.17 | 3.0 | – | -2.22 | 0.92 | 0.10 | |||
| -2.43 | 1.73 | 0.31 | -2.20 | 4.7 | 0.35 | -2.63 | 1.58 | 0.22 | |||
The considerably larger amount of H I observed in the external UV region relative to CO leads us to speculate that H I is more likely a precursor of H2 rather than a product of photodissociation due to UV radiation. However, the situation might be more complicated in reality. The main complication we may invoke is the reliability of CO as a proxy of H2. As discussed in Sect. 4 and shown in Fig. 5, the absence of a clear CO(2–1) line detection beyond , with a CO luminosity ratio, , below (see Table 1), may betray a decrease in the excitation temperature with the galactocentric radius. If this is the case, it may be that even if substantial H2 is present in the outer regions of the M63 disk, the CO lines may be quite weak, hence remain undetected.
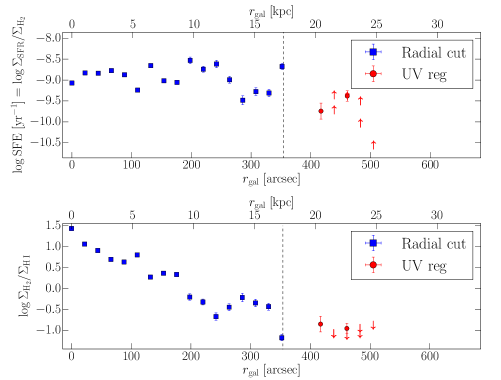
In Fig. 6 we plot the radial profiles of the star formation efficiency (SFE) and the H2-to-H I surface density ratio. The SFE is the star formation rate (SFR) per unit of molecular gas or the inverse of the gas depletion timescale, i.e., the time required for present-day star formation to consume the gas reservoir. It is calculated here as . The various surface densities are computed using Eqs. (5.2) to (3). In the radial cut we only consider the pointings up to the isophotal radius, , where we obtained convincing CO detections (17 pointings), and in the UV region we retain pointings with 24 m detections only (8 pointings) in order to accurately estimate the star formation rate density. We observe that the SFE, as measured over the radial cut of M63, is roughly constant as a function of the galactocentric radius out to the limit. This is in line with the findings by Leroy et al. (2008), which we now extend out to the isophotal radius. Beyond , the two SFE detections tend to show a drop in the SFE in the bright UV region, but upper limits in the other data points prevent us from drawing definitive conclusions. The H2-to-H I surface density ratio shows a smooth decrease with the galactocentric radius, such that the inner regions of the M63 disk are H2-dominated, while the regions at end up to be H I-dominated. This transition between a “mostly-H2” and a “mostly-H I” interstellar medium (ISM) is found to be a well-defined function of local conditions according to Leroy et al. (2008), occurring at characteristic galactocentric radius, stellar and gas surface densities, hydrostatic gas pressure, and orbital timescale. At the limit and beyond, we observe a further and more severe drop of the H2-to-H I surface density ratio. Nevertheless, the behavior of the radial profiles of the SFE and the H2-to-H I surface density ratio may well be inverted, if the trend toward an increasing CO-to-H2 conversion factor with the galactocentric radius, as shown by Sandstrom et al. (2013, see their Fig. 7) for M63 over the radial cut out to , is confirmed.
5.2 Kennicutt-Schmidt relations
Our acquired CO measurements offer the opportunity to analyze the Kennicutt-Schmidt relations across the optical disk of the M63 galaxy and, in particular, close to and beyond the isophotal radius, . This exercise is especially of interest in the bright UV region located in the outer disk of M63 at the galactocentric radius , whose stellar emission is solely dominated by the UV emission, so where the star formation rate, metallicity, gas temperature, excitation, and gas density are potentially lower. For this purpose, we use the photometric measurements obtained in Sect. 5.1 for the FUV, 24 m, and H I data. At each pointing of the CO radial mapping and the CO mapping of the bright UV region, we compute the star formation rate surface density, , the atomic gas surface density, , and the molecular gas surface density, . We can question how these surface densities determined over single pointings along the radial major axis cut are representative of surface densities that Leroy et al. (2008) obtained by performing azimuthal averages over the entire disk of M63. The comparison of the respective molecular gas surface densities as a function of the galactocentric radius is excellent. The SFR surface densities for the radial cut show an offset toward higher values, but the respective radial profiles are the same. Only the atomic gas surface density measurements seem to severely diverge between the radial cut and the azimuthal averages. This difference comes from the fact that the radial cut along the major axis crosses a spiral arm like structure, which is very bright in H I and covers an H I emission peak in the outer parts of the radial profile. This certainly also explains the higher we observe for the radial cut, where the star formation activity is slightly enhanced.
The SFR surface density is determined using the calibration from Leroy et al. (2008):
| (1) |
which includes the FUV flux to measure the unobscured star formation through the emission of O and B stars, and the 24 m flux that traces the obscured FUV emission that is re-emitted in the far-IR by dust grains. The atomic gas surface density is measured with the calibration of Bigiel et al. (2010):
| (2) |
which includes a factor of 1.36 to reflect the presence of helium. Finally, the molecular gas surface density (see Tables 1 and 2) is calculated with our integrated CO(1–0) line fluxes using the calibration of Leroy et al. (2008):
| (3) |
where the “standard” Galactic CO-to-H2 conversion factor, (Dickman et al. 1986), as well as the factor of 1.36 to account for helium are adopted. The inclination correction by an angle is taken into account. This correction is also considered in the SFR and atomic gas surface densities when deprojecting the FUV, 24 m, and H I images (see Sect. 5.1).
We compare the star formation rate surface densities with the atomic and molecular gas surface densities separately in the two top panels of Fig. 7. The two plots show that the gas surface density of M63 in its radial cut is dominated by the molecular gas, whereas the bright UV region is strongly dominated by the atomic gas, as also observed in Fig. 6 (bottom panel). Interestingly, the H I surface density of the UV region is very similar to the one observed along the radial cut, in contrast to its molecular gas surface density, which is significantly lower. Finally, in the bottom panel of Fig. 7 we show the star formation rate surface density as a function of the total gas surface density, , namely the sum of both and .
To characterize the star formation in M63, we use the Kennicutt-Schmidt (K-S) relation that relates the SFR surface density to the gas surface density. In all plots of Fig. 7, we fit a power law of the form , which in log space translates into a simple linear relation. The coefficient traces the absolute star formation efficiency (Kennicutt 1998), and the exponent relates the star formation rate to the gas density present and tells us how close the two variables are to linearity. We use the least-square bisector method, which is suitable for two independent variables (Isobe et al. 1990), for the fit in log space and leave and as free parameters. It is important to note that for the fitting procedure alone (not the plotting), we rescaled by a factor of 10, such that . We made this rescaling to minimize the covariance of and in the fit777This rescaling has no influence on the results of the exponent , so only the coefficient will need to be corrected by the factor of 10. and to make our results comparable to those of Bigiel et al. (2008) for M63. They used the same FUV and H I data as we did, but the CO data were taken from the HERACLES CO(2–1) database (Leroy et al. 2009) with a resolution and a CO(2–1)/CO(1–0) line ratio of 0.8. Our CO(1–0) data reach much deeper sensitivity than the HERACLES CO(2–1) data, which is essential for properly characterizing the K-S relations over all the optical disk and especially beyond the limit.
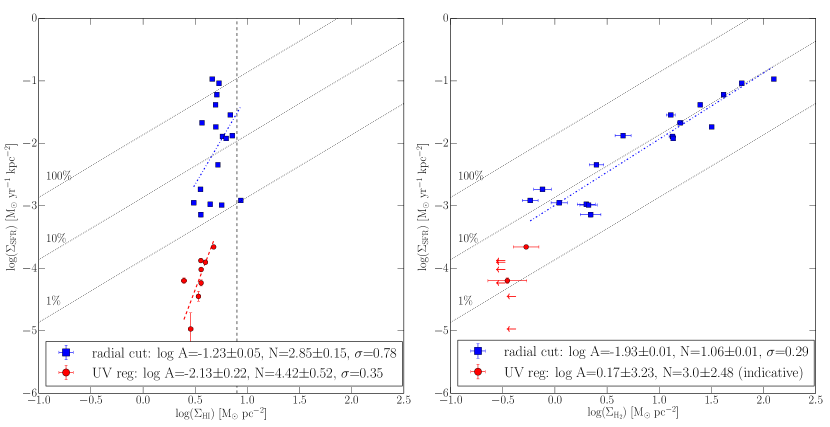
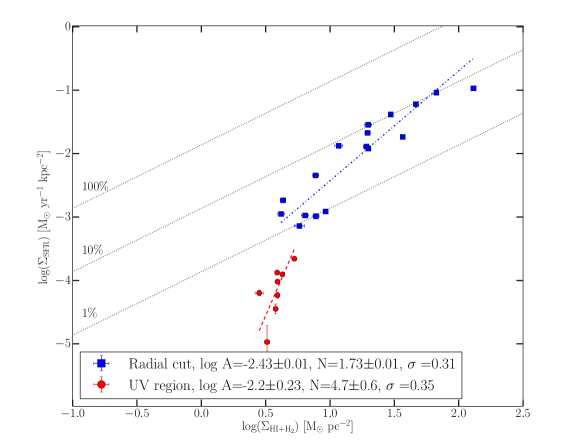
The best-fitting bisector linear relations, , obtained independently for the K-S relation over the full radial cut out to and the UV region in the outer disk of M63 are shown in Fig. 7. The errors we provide on and are quotes of the nearly Gaussian distributions of and obtained through Monte-Carlo simulations of 5000 data sets created from the original data, with random values generated within their error bars. The scatter in our fits typically are on the order of 0.3 dex. The corresponding K-S relation results are presented in Table 4 for both and , and are compared to the respective K-S relations found by Bigiel et al. (2008) over the radial cut of the M63 disk out to only. The K-S relations obtained over the radial cut have very comparable slopes (in log space) for and for , with our slopes systematically slightly steeper. They also have comparable coefficients for and for , with our coefficients systematically smaller by about , but still within the fit scatter. The one-to-one linearity of the K-S relation between the SFR surface density and the molecular gas surface density is really solid, meaning that the gas is being consumed at a nearly constant rate, as expected for .
When comparing these results to the K-S relations of the UV region in the outer disk of M63 at the galactocentric radius , we note that they are significantly different. The slope (in log space) of the K-S relation for is considerably steeper in the external UV region. A similar trend is observed for . It is true that this relies on two data points, but if we trust our upper limits on , we can hardly expect to reconcile these external UV region measurements with the K-S relations observed over the radial cut, more especially as the derived star formation rate surface densities are very reliable. It is very likely that the CO-to-H2 conversion factor adopted over the external UV region is underestimated, given the low metallicity expected in the outskirts of M63 as supported by the metallicity gradient inferred in M63 (see Sect. 2) and the observed trend for an increase in with decreasing metallicity (Sandstrom et al. 2013; Bolatto et al. 2013). While this may induce a shift in the external UV region data points toward higher gas surface densities, the slopes of the K-S relations for and will remain unchanged, unless there is a significant gradient over the external UV region. As a result, a broken K-S power law between the inner and outer regions of the M63 disk seems to robustly emerge. It suggests that the regime of star formation drastically changes beyond the isophotal radius, . Indeed, the exponents observed for the K-S relations in the external UV region show a nonlinear SFR regime, in clear contrast to the quasi-linear SFR regime in the inner regions of the disk. What triggers the “quenching” of star formation in the outer regions of the M63 disk and, consequently, the severe deviation from the commonly accepted star formation relation as traced by the K-S relations observed along the radial cut of M63? We can invoke the flaring of the outer gas layers or, more speculative, the possible presence of high turbulence providing support against gravitational collapse as suggested by Longmore et al. (2013).
To better appreciate the change in the star formation regime between the inner and outer regions of the M63 disk, in Fig. 7 we also plot “isochrones” of constant star formation efficiencies, indicating the levels of needed to consume 100%, 10%, and 1% of the total amount of gas (corrected by a factor of 1.36 to account for helium) within years. These isochrones can also be interpreted as constant gas depletion timescales (i.e., the time needed to consume the total amount of gas) of yr, yr, and yr from top to bottom. We can see that when the total gas is considered (H I + H2), the SFE settles the gas consumption within years to 1% to 10% for the radial cut of M63, whereas the external UV region has a much lower SFE with less than 1% of the gas converted into stars within years. The drop in the star formation efficiency beyond the isophotal radius, , can also be appreciated in Fig. 6 (upper panel). The SFE could even be lower in the external UV region, since the CO-to-H2 conversion factor may, in reality, be up to 100 times more (in the extreme case) than the “Galactic” value (Bolatto et al. 2013) and so are the computed values, depending on the metallicity of the external UV region, which may well be as low as 10% to 20% of the local Galactic ISM888When extrapolating the metallicity gradient determined for M63 (see Sect. 2), we get a metallicity of 20% of the local Galactic ISM at , the galactocentric radius of the bright UV region.. Consequently, the star formation still occurs in the outer regions of the M63 disk, but at very low efficiency, significantly lower than in the inner regions of the disk.
6 Summary and conclusions
Deep CO(1–0) and CO(2–1) observations obtained on the IRAM 30 m telescope of the M63 spiral galaxy characterized by an XUV disk extending out to 2.5 times the optical equivalent radius were presented. We performed both a CO mapping along the major axis of the M63 disk from the center out to the galactocentric radius and over a bright UV region in the outer disk of M63 at the galactocentric radius . Our objective was to search for CO emission and hence for molecular gas in the outer regions of the M63 disk beyond the optical radius, where evidence of star formation is brought by both the extended UV emission and high H I column densities observed in these regions. We highlighted the importance of a CO detection in regions far away from the center of the galaxy, where the metallicity, gas temperature, excitation, and gas density are supposed to be lower and where stars have more difficulty to form. To complement our CO observations, we used FUV, NUV, H, 24 m, and H I data from the literature. This allowed us to investigate the Kennicutt-Schmidt relations across the galaxy and beyond the isophotal radius, , in the bright UV region. Our main results are as follows.
-
1.
The CO(1–0) emission is clearly detected along the major axis of the M63 disk out to the isophotal radius, , but not beyond. However, the CO(1–0) is again detected in the bright UV region in the outer disk of M63 at . This is the fourth molecular gas detection in the outskirts of nearby spiral galaxies. The CO(2–1) emission is, on the other hand, confined to and thus suggests subthermal excitation in the outer regions of the M63 disk.
-
2.
The radial profiles of the CO emission and other star formation tracers (Fig. 5) show a severe drop with the galactocentric radius, in contrast to the atomic gas. Close to the limit, CO and the star formation tracers begin to vanish considerably, and beyond , they all are practically absent with the exception of the faint UV emission and H I. The UV region at , in which the CO emission is detected, is characterized by FUV and NUV emission fluxes similar to the fluxes observed at , but stronger than the fluxes observed at along the M63 major axis. This probably reflects a tight correlation between the CO and UV fluxes, namely between the intensity of star formation and the amount of molecular gas, so it strongly suggests that the absence of CO detection at , where the XUV is weaker, is simply the result of the CO detection threshold that is still too high.
-
3.
The external UV region is characterized by a very high H I flux with respect to the measured CO flux. This leads us to speculate that H I is more likely the precursor of H2 rather than the product of UV photodissociation, since it seems to dominate in quantity. This is, however, true as long as substantial H2 is not hidden in the outer disk regions of M63, which may be the case as we observe hints for an excitation temperature decrease at large galactocentric radii, which may lead to very weak CO lines.
-
4.
With the integrated CO line flux measurements and the complementary data from the literature, we derive SFR, H I, and H2 surface densities all along the major axis of the M63 disk and in the external UV region. We observe that the gas surface density along the radial cut is dominated by the molecular gas, whereas in the UV region it is dominated by the atomic gas. The best-fit Kennicutt-Schmidt relations, , show a broken power law from the inner to the outer regions of the M63 disk (Fig. 7). Indeed, the almost linear K-S relation (with a slope of nearly 1 in log space) observed over the radial cut, in the inner regions of the disk characterized by high gas densities, cannot be extrapolated to the outer disk regions. The latter are characterized by a nonlinear SFR regime (with a K-S slope much higher than 1 in log space), perhaps owing to the flaring of the outer gas layers. This is the first time that the K-S relation is quantified in the outskirts of a spiral galaxy, i.e., in low gas density environments. At a molecular gas surface density as low as , well below all the determined H2 surface densities referenced in spiral galaxies so far (Bigiel et al. 2008, 2011), star formation still occurs spontaneously.
-
5.
The change in the star formation regime between the inner and outer regions of the M63 disk can also be appreciated by the difference in their star formation efficiencies. Indeed, along the major axis of the disk out to the isophotal radius the SFE settles the gas consumption within years from 1% to 10%, whereas in the external UV region much less than 1% of the gas is converted into stars within years. Consequently, star formation still occurs in the outer regions of the disk, but at very low efficiency.
Acknowledgements.
C.V. wishes to acknowledge support from CNRS and CONICYT through an agreement signed on December 11, 2007. We warmly thank the IRAM 30 m telescope staff for their support during the observations. We thank the anonymous referee for her/his very careful and constructive report.References
- Alberts et al. (2011) Alberts, S., Calzetti, D., Dong, H., et al. 2011, ApJ, 731, 28
- Allen (1996) Allen, R. J. 1996, Cold dust and Galaxy Morphology (D. L. Block & J. M. Greenberg, Astrophysics and Space Science Library 209, p.50)
- Allen et al. (1986) Allen, R. J., Atherton, P. D., & Tilanus, R. P. J. 1986, Nature, 319, 296
- Allen et al. (2004) Allen, R. J., Heaton, H. I., & Kaufman, M. J. 2004, ApJ, 608, 314
- Battaglia et al. (2006) Battaglia, G., Fraternali, F., Oosterloo, T., & Sancisi, R. 2006, A&A, 447, 49
- Bigiel et al. (2010) Bigiel, F., Leroy, A., Walter, F., et al. 2010, AJ, 140, 1194
- Bigiel et al. (2008) Bigiel, F., Leroy, A., Walter, F., et al. 2008, AJ, 136, 2846
- Bigiel et al. (2011) Bigiel, F., Leroy, A. K., Walter, F., et al. 2011, ApJ, 730, L13
- Bolatto et al. (2013) Bolatto, A. D., Wolfire, M., & Leroy, A. K. 2013, ARA&A, 51, 207
- Braine et al. (2007) Braine, J., Ferguson, A. M. N., Bertoldi, F., & Wilson, C. D. 2007, ApJ, 669, L73
- Braine et al. (2010) Braine, J., Gratier, P., Kramer, C., et al. 2010, A&A, 520, A107
- Braine & Herpin (2004) Braine, J. & Herpin, F. 2004, Nature, 432, 369
- Combes & Pineau Des Forets (2000) Combes, F. & Pineau Des Forets, G., eds. 2000, Molecular Hydrogen in Space
- Crosthwaite et al. (2002) Crosthwaite, L. P., Turner, J. L., Buchholz, L., Ho, P. T. P., & Martin, R. N. 2002, AJ, 123, 1892
- Cuillandre et al. (2001) Cuillandre, J.-C., Lequeux, J., Allen, R. J., Mellier, Y., & Bertin, E. 2001, ApJ, 554, 190
- Dale et al. (2009) Dale, D. A., Cohen, S. A., Johnson, L. C., et al. 2009, ApJ, 703, 517
- de Blok & Walter (2003) de Blok, W. J. G. & Walter, F. 2003, MNRAS, 341, L39
- Dickman et al. (1986) Dickman, R. L., Snell, R. L., & Schloerb, F. P. 1986, ApJ, 309, 326
- Dong et al. (2008) Dong, H., Calzetti, D., Regan, M., et al. 2008, AJ, 136, 479
- Ferguson et al. (1998) Ferguson, A. M. N., Wyse, R. F. G., Gallagher, J. S., & Hunter, D. A. 1998, ApJ, 506, L19
- Gil de Paz et al. (2007) Gil de Paz, A., Boissier, S., Madore, B. F., et al. 2007, ApJS, 173, 185
- Gil de Paz et al. (2005) Gil de Paz, A., Madore, B. F., Boissier, S., et al. 2005, ApJ, 627, L29
- Helfer et al. (2003) Helfer, T. T., Thornley, M. D., Regan, M. W., et al. 2003, ApJS, 145, 259
- Henry & Worthey (1999) Henry, R. B. C. & Worthey, G. 1999, PASP, 111, 919
- Isobe et al. (1990) Isobe, T., Feigelson, E. D., Akritas, M. G., & Babu, G. J. 1990, ApJ, 364, 104
- Kennicutt (1989) Kennicutt, Jr., R. C. 1989, ApJ, 344, 685
- Kennicutt (1998) Kennicutt, Jr., R. C. 1998, ApJ, 498, 541
- Kennicutt et al. (2008) Kennicutt, Jr., R. C., Lee, J. C., Funes, José G., S. J., Sakai, S., & Akiyama, S. 2008, ApJS, 178, 247
- Leroy et al. (2009) Leroy, A. K., Walter, F., Bigiel, F., et al. 2009, AJ, 137, 4670
- Leroy et al. (2008) Leroy, A. K., Walter, F., Brinks, E., et al. 2008, AJ, 136, 2782
- Longmore et al. (2013) Longmore, S. N., Bally, J., Testi, L., et al. 2013, MNRAS, 429, 987
- Lupton et al. (2004) Lupton, R., Blanton, M. R., Fekete, G., et al. 2004, PASP, 116, 133
- Martin & Kennicutt (2001) Martin, C. L. & Kennicutt, Jr., R. C. 2001, ApJ, 555, 301
- Moustakas et al. (2010) Moustakas, J., Kennicutt, Jr., R. C., Tremonti, C. A., et al. 2010, ApJS, 190, 233
- Nieten et al. (2006) Nieten, C., Neininger, N., Guélin, M., et al. 2006, A&A, 453, 459
- Pilyugin & Thuan (2005) Pilyugin, L. S. & Thuan, T. X. 2005, ApJ, 631, 231
- Sancisi et al. (2008) Sancisi, R., Fraternali, F., Oosterloo, T., & van der Hulst, T. 2008, A&A Rev., 15, 189
- Sandstrom et al. (2013) Sandstrom, K. M., Leroy, A. K., Walter, F., et al. 2013, ApJ, 777, 5
- Schruba et al. (2011) Schruba, A., Leroy, A. K., Walter, F., et al. 2011, AJ, 142, 37
- Smith et al. (2000) Smith, D. A., Allen, R. J., Bohlin, R. C., Nicholson, N., & Stecher, T. P. 2000, ApJ, 538, 608
- Solomon et al. (1997) Solomon, P. M., Downes, D., Radford, S. J. E., & Barrett, J. W. 1997, ApJ, 478, 144
- Solomon et al. (1987) Solomon, P. M., Rivolo, A. R., Barrett, J., & Yahil, A. 1987, ApJ, 319, 730
- Thilker et al. (2005) Thilker, D. A., Bianchi, L., Boissier, S., et al. 2005, ApJ, 619, L79
- Walter et al. (2008) Walter, F., Brinks, E., de Blok, W. J. G., et al. 2008, AJ, 136, 2563
- Young & Scoville (1982) Young, J. S. & Scoville, N. 1982, ApJ, 258, 467
- Young & Scoville (1991) Young, J. S. & Scoville, N. Z. 1991, ARA&A, 29, 581
- Young et al. (1995) Young, J. S., Xie, S., Tacconi, L., et al. 1995, ApJS, 98, 219