Aqueous Amino Acids and Proteins Near the Surface of Gold in Hydrophilic and Hydrophobic Force Fields
Abstract
We calculate potentials of the mean force for twenty amino acids in the vicinity of the (111) surface of gold, for several dipeptides, and for some analogs of the side chains, using molecular dynamics simulations and the umbrella sampling method. We compare results obtained within three different force fields: one hydrophobic (for a contaminated surface) and two hydrophilic. All of these fields lead to good binding with very different specificities and different patterns in the density and polarization of water. The covalent bond with the sulfur atom on cysteine is modeled by the Morse potential. We demonstrate that binding energies of dipeptides are different than the combined binding energies of their amino-acidic components. For the hydrophobic gold, adsorption events of a small protein are driven by attraction to the strongest binding amino acids. This is not so in the hydrophilic cases – a result of smaller specificities combined with the difficulty for proteins, but not for single amino acids, to penetrate the first layer of water. The properties of water near the surface sensitively depend on the force field.
1 Introduction
Interactions between proteins and solid surfaces are at the heart of many potential applications in bionanotechnology [1, 2] and medicine [3, 4]. One example is a response of a body to implants. The interactions are also crucial for understanding of many phenomena that take place in nature such as bone formation, adhesion of mussels to rocks, and anti-freeze protection of animals [5]. The applications often involve nanoparticles [6], either functionalized by ligands or not. The nanoparticles may or may not be toxic, depending on the interactions with the relevant proteins. A broader issue is specificity: which amino acids (AA), peptides, or proteins bind to a given solid in aqueous solutions well and which do not.
Procedures for synthesis of colloidal gold have been known since the times of Faraday [7]. This may explain, together with gold’s biocompatibility, why nanoparticles of gold have been particularly well studied, also in the context of interactions with proteins [8, 9, 10]. One of the goals of these studies is to harness optical and plasmonic properties of such nanoparticles. Furthermore, flat gold surfaces are used in single molecule spectroscopy studies of biomolecules as specimen discs and gold-coated AFM tips because of cysteine’s ability to form covalent bonds with gold which facilitates stretching [11, 12, 13].
Naturally, the subject of protein-gold interactions in water has also been studied theoretically quite extensively through classical all atom simulations [14, 15, 16, 17, 18, 19, 20, 21, 22]. There are also density functional theory studies for small organic molecules without water or with a few frozen molecules of water [23, 24, 25, 26]. The first principle studies include quantum effects and give insights into the physics of the problem, but their practicality is limited in situations with water solutions which involves many possible configurations of the system. On the other hand, the classical simulational studies use distinct force fields and are carried out for different proteins (or selected AAs) so it is hard to make comparisons between them and even harder to reach understanding of theirs physics. The force fields used seem to have similar parameters. However, the crucial differences are contained in the Lennard-Jones parameters for interactions of gold with water. Our previous studies on ZnO [1] and ZnS [28] indicate that the nature of the density profiling of water near the solid is an important determinant of how single AAs couple to the solid. For instance, formation of an articulated first layer tends to screen proteins from the electric field of the solid and thus weaken the coupling and may also lead to a steric barrier. Thus proper accounting for the density profiling of water is of the essence in the theory of interactions of biomolecules with a solid.
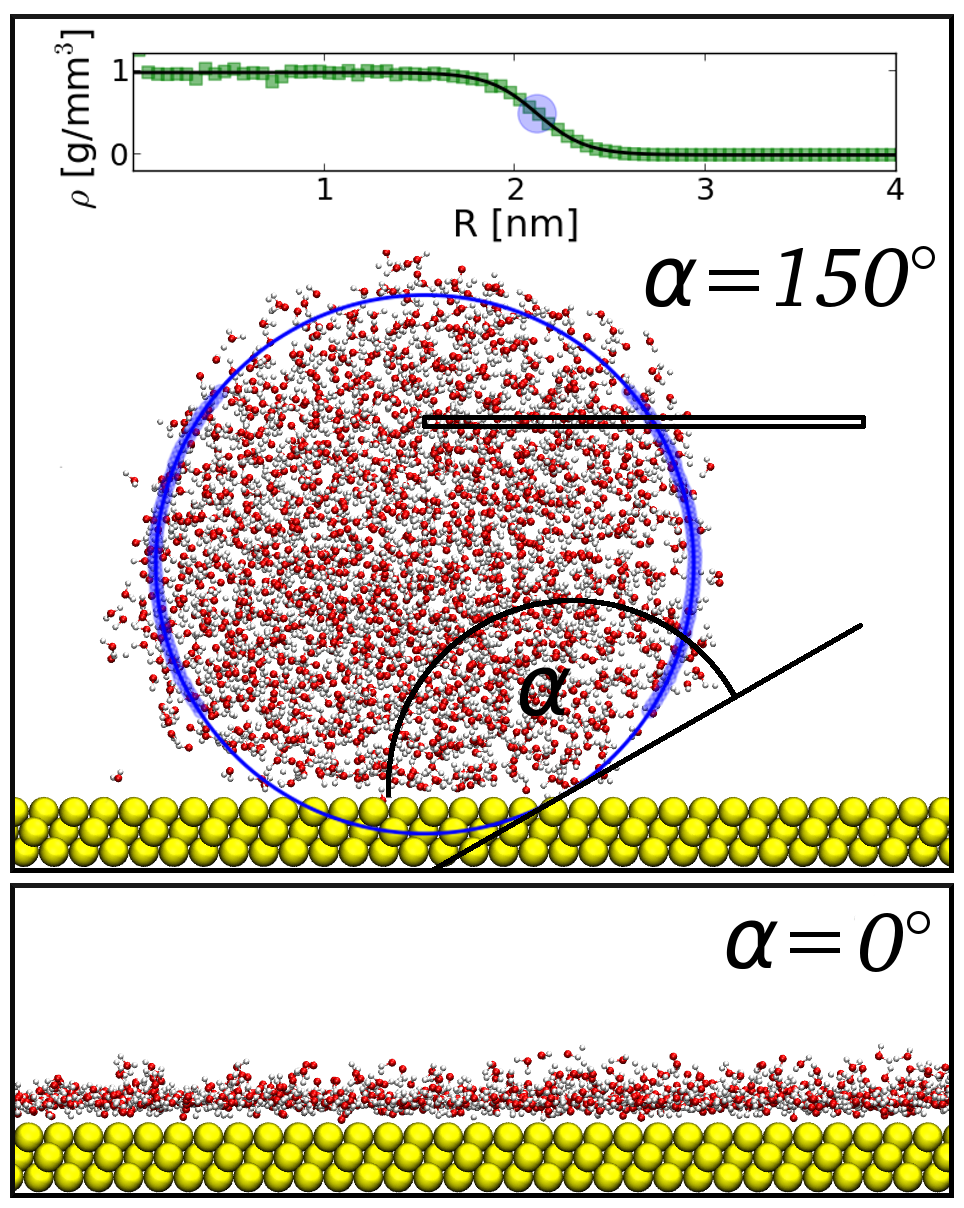
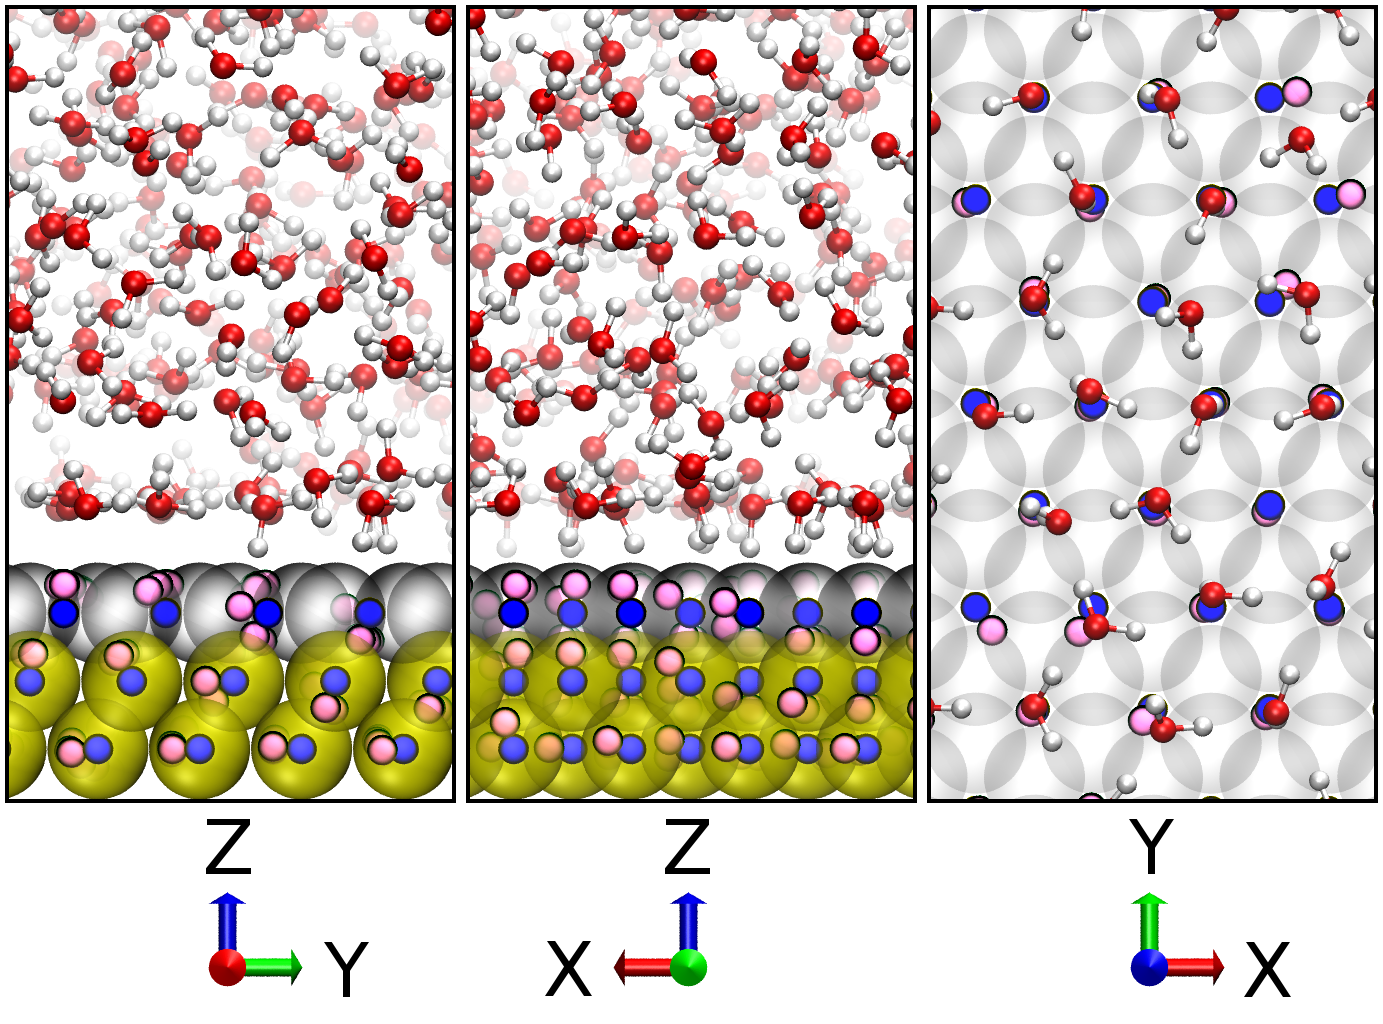
Here, we focus on three force fields: one hydrophobic of Bizzarri [20, 21], henceforth denoted as FFB, and two hydrophilic. The first of the latter has been proposed by Verde [18, 19] and will be denoted here as FFV. Both FFB and FFV are CHARMM-based [29] and all interactions with gold are described by the Lennard-Jones potentials. The difference between the two is captured by Figure 1 which shows what happens to a bulk-equilibrated spherical droplet of about 2000 water molecules when placed near the Au (111) and then evolved using the GROMACS 4.5.5 package [30]. For FFB, the sphere deforms into a droplet that makes the contact angle of about 150∘ (the procedures will be described later). On the other hand for FFV, there is perfect wetting: the molecular sphere spreads evenly across the gold surface. The Lennard-Jones parameters in FFV have been obtained by successive adjustments to make the initially finite contact angle of the droplet just approach zero. The second hydrophilic force field has been proposed by Iori et al. [22] and named GolP. Here, it will be referred to as FFI for uniformity of notation for the three force fields considered. The FFI field is hydrophilic, not because of the sufficiently strong van der Waals-based attraction but because it includes the dynamical effects of charge polarization in gold.
The profound differences in the behavior of water between the force fields must translate into distinct energies of interactions of biomolecules with gold. Here, we shall bring this out by determining the potentials of the mean force (PMF) for the twenty single AAs for FFB, FFV, and partially for FFI, and by demonstrating their fundamental disparity. In particular, the binding energies of AAs are, on average, about six times stronger in FFV compared to FFB and the identities of the best non-cysteinic binders are distinct: ARG and MET for FFV with TRP and LEU for FFB. CYS is special as it may form a covalent bond with Au. We model this bond by using the Morse potential which allows for attachment and detachment. This approach is qualitatively consistent with the experimental Raman spectra studies [31, 32] which yield the characteristic detachment time for cyteine to be of order 1 ms. We then study the behavior of a small protein, the tryptophan cage, near Au (111) and ask to what extent the knowledge of the single AA potentials helps in interpreting binding events of proteins. We also discuss interactions of gold with dipeptides and analogs of AAs side chains.
The pertinent question to ask is which force field is closer to reality. We think that actually both hydrophobic and hydrophilic fields may be useful. There are reports claiming that gold is hydrophobic [33] and there are also reports [34, 35] that it is hydrophilic. The laboratory practice shows [36] (see also ref. [37]) that clean gold is hydrophilic but it becomes hydrophobic over time as the surface acquires carbon or oxygen contaminants. Thus, fundamentally, the hydrophilic fields are more appropriate to use. However, FFB can be considered as a useful effective parametrization when the gold gets dirty. The rational design of sequences that bind well to gold should then include information about the state of the surface, but cysteine is found to bind strongly under whatever conditions.
It is a different matter to decide which of the two hydrophilic force fields is more correct. In principle, it seems wiser to include the effects of the polarization of gold. However, the FFI model adopts a particular way of doing it – by invoking rotating dipoles that are placed at non-obvious locations. It is not clear whether this empirical description is optimal. There are alternative ways to take the delocalized electronic charges in gold. One of them, for instance, employs the surface-integrated Lennard-Jones potentials in which the lateral corrugation part is reduced [38, 39] by an order of magnitude because of the delocalization effects. This approach yields good agreement with experimental results on atomic friction [40]. Other approaches may involve adjustments in the effective dielectric constant. It should also be noted that the two hydrophilic force fields employ different models of the molecules of water: in FFV, the atoms of H interact with Au through Lennard-Jones interactions and in FFI they do not.
In any event, we find that the binding strengths of single AAs to gold are larger in FFV than in FFI by a factor of and that FFV turns GLU and SER from relatively poor binders under FFI into excellent binders while converting a good binder ARG into the very top binder (other than CYS). Studying relationships between the binding strengths may offer an experimental way to decide which force field to favor. Another approach is to study the water density profiles as a function of the vertical distance away from the surface. We show that there are some shifts in the profiles between FFV and FFI. More clear-cut differences appear in the distribution of water polarization just near the surface: FFV favors flat orientations of the molecules of water in this region whereas FFI – staggered up and down.
After discussing properties of water near gold and the PMFs for single capped amino acids in the three force fields, we consider the analogs of the AAs side groups and dipeptides. Finally, we analyze adsorption events of a small protein – the tryptophan cage – and compare the results obtained with different force fields. We find that the mechanisms of adsorption are distinct.
In addition to the force fields discussed in this paper, there have been several other approaches proposed in the literature. For instance, Braun [41] propose a -dependent 10-4 potential with an amplitude determined through an order-of-magnitude argument and combined with an electrostatically motivated corrugational term. Heinz [14, 42] consider an FFV-like force field that does not include interactions with the hydrogen atoms in water molecules. Our selection of the force fields has been motivated by the desire to elucidate situations with the clearest and most distinct physical features. The hydrophilic properties of FFV are determined by the van der Waals interactions but in FFI by the polarization. FFV considers the polarization to be of no relevance whereas FFI assumes that Lennard-Jones interactions with the hydrogen atoms of water molecules to be not important. The selection of the hydrophobic FFB stems from the fact that FFB includes parameters describing the covalent Au-CYS interaction (it does not include the van der Waals interactions with hydrogen atoms in water molecules).
2 Methods
2.1 Interactions and Force Fields
Our all-atom MD simulations with explicit solvent are performed using the GROMACS 4.5.5 package [30]. The VMD package is used for visualization of structures [43]. The simulations involve both bonded and non-bonded interactions. The latter include Coulombic attraction and repulsion between charged particles, van der Waals forces, and overlapping of electronic orbitals. The latter two are described by the Lennard-Jones potentials. The bonded interactions include penalties for stretching of covalent bonds of length (the term is ), twisting of bond angles away from their preferred values (the potential is , bending of dihedral angles ()) in CHARMM and in OPLS/AA), and for not keeping aromatic rings planar (, where denotes the angle between planes set by atoms and , and potentials like for the dihedral terms in OPLS/AA).
The parametrization employed in FFB and FFV is basically CHARMM-based [29]. The distinction between the hydrophobic FFB and the hydrophilic FFV sits in the parameters associated with the non-bonded interactions with the surface as described by the Lennard-Jones potential. The length parameter, , is 0.19 nm and 0.29 nm in FFB and FFV respectively. This means that the atoms of Au in FFB act as smaller centers than in FFV. The energy parameter associated with gold, , is 0.33 kJ/mol for FFB and 4.39 kJ/mol for FFV. The FFB model [20, 21] takes and derived from the paper by Qian [44].
The FFV model [18, 19] draws on the Universal Force Field [45] and then adjusts the parameters to reduce the contact angle to zero when a droplet is placed on the surface.
When using the FFB and FFV models we take water molecules to be described by the TIP3P model [46]. However, in the case of FFV we use its modified version, proposed by Verde [18], in which not only the oxygen but also the hydrogen atoms interact with gold and all other components of the system through the Lennard-Jones potentials (in addition to the Coulombic terms). An alternative approach [14] is to eliminate the Lennard-Jones couplings with the hydrogen atoms and enhance to about 22 kJ/mol.
In the FFI force field [22], the relevant parameters are taken from the OPLS/AA force field [47] and water is described by the SPC model [48]. However, the Au surface is considered to be polarizable. The polarization is taken into account by placing permanent electric dipoles of length 0.07 nm and charges 0.3 on the atoms of Au. The dipoles are allowed to rotate three-dimensionally in response to the motion of all atoms in the solvent. Furthermore, the FFI doubles the number of the Lennard-Jones sites over the actual number of the Au atoms and locates them between positions of the real Au atoms in order to achieve a better agreement with the results obtained by the density functional theory. Parameters and are 0.32 nm and 0.65 kJ/mol for these interactions.
In all models, the covalent bond between the S atom of cysteine and the nearest Au atom on the gold surface needs a special procedure. Here, this bond is considered to be transient and is treated in analogy to the method proposed in ref. [28] in the context of ZnS. In the case of ZnS, the covalent coupling is through the disulfide bond which may form between S on the cysteine and S on the surface. Here, the S-Au bond is also represented by the Morse potential (see also Mahaffy [49])
| (1) |
where and label the atoms involved. They are in a distance of and denotes location of the minimum. Parameter denotes the depth of the potential well, or – equivalently – the dissociation energy. At small deviations from the minimum, , but at large distances disappears. Parameter is related to the effective spring constant through . The bond angle potential between the Au-S-Cβ triplet and the dihedral angle potential between the Au-S-Cβ-Cα quadruplet are multiplied by the normalized and sign-inverted Morse potential to guarantee their decays at large distances. We do not take into account dissociation of H from the thiol group (S–H) into the solvent due to the formation of the S–Au bond. The functions representing covalent bond between S and Au within the framework of FFB are parametrized according to Jung [50], but are derived from ref. [51]. To summarize, we take =82843.2 kJ/mol/nm2, =253.6 kJ/mol, and =0.2531 nm. For the other two force fields such parameters do not seem to be available in the literature and the covalent bonding to cysteine in FFV and FFI will not be discussed here. S in methionine is considered as not making any covalent bond with gold.
2.2 Geometry of the System
Crystalline gold forms the fcc lattice. The unit cell contains 8 atoms at the corners of a cube and 6 at the center of each face of the cube. The lattice constant, , i.e. the cube edge, is 0.408 nm long and the distance between the nearest atoms is equal to 0.288 nm. We build the solid by repeating the elementary unit in all Cartesian directions. The most common cleavage is one that forms the (111) planes [52]. Atoms on the surface are thus arranged into the hexagonal lattice.
We model the Au surface by a slab of three atom layers located at the bottom of the simulation box sized so that the top layer is at =0. Water molecules, ions, and AAs or peptides are placed within the box. Here, and are about 3.5 nm whereas is adjustable. In proper runs, is equal to 4.0 nm and a reflecting wall is placed at the top. Above this wall, there is an empty space extending to = 3 . Another reflecting wall, affecting only the AAs, is placed at = 3.5 nm – otherwise an AA might get trapped at the water-vacuum interface. The purpose of this construction with the empty space is to allow for the usage of the periodic boundary conditions (in the periodic image, above the empty space there are atoms of the solid) combined with the pseudo-2 particle mesh Ewald summation [53]. The solid is considered to be rigid and its geometry is taken to be bulk-like. It should be noted that the snapshots of molecules near gold shown in this paper for illustration pertain to only small fragments of the simulation box. The size of the fragments can be inferred by counting the closest distances between the gold atoms.
2.3 Simulation Settings
The standard procedure of making the simulations feasible in an acceptable time is to apply cutoff radii for all relevant interactions. We use the cutoff of 1.2 nm combined with the gradual switching the interactions off between 1.0 and 1.2 nm. The MD simulations were performed using the leap-frog algorithm with the time step of 1 fs. This value of the time step is short enough to make the computations stable. Doubling it may result in generation of prohibitively large forces at the water-solid interface. Temperature control was implemented every 0.1 ps by using the Berendsen thermostat [30] with the temperature of 300 K. At the beginning of each run, the energy of the system was minimized through the steepest descent algorithm and the initial velocities were Maxwellian. The first runs pertained to the situation without any biomolecules – the system was equilibrated for 4 ns with set at 5 nm. The duration of equilibration was decided based on the behavior of the total energy and appeared more than sufficient. At that stage, was reduced to 4 nm. The reason for making the reduction in is formation of a depletion layer in water at the top due to the attraction by the solid at the bottom. Further equilibration continued for 1 ns and, at that stage, the biomolecules and Na+ and Cl- ions were inserted randomly. The concentration of the ions corresponded to the physiological 150 mM: 4 ions of Na+ and 4 ions of Cl-. If a biomolecule had a net charge due to the side groups, extra ions were inserted to neutralize it.
The AAs and dipeptides considered in the simulations are capped by the acetyl group at the N-terminus and N-methylamide group at the C-terminus. These caps eliminate the terminal charges and mimic the presence of a peptide chain in which the AA exists in the unionized form (see, [54]). Histidine is considered in its three possible protonation states: HIE (H on the N atom), HID (H on the N atom) and positively charged HIP (H on both and N atoms). We assume pH of 7. At his value, all three forms are present with the same probability.
2.4 Determination of the Potential of Mean Force
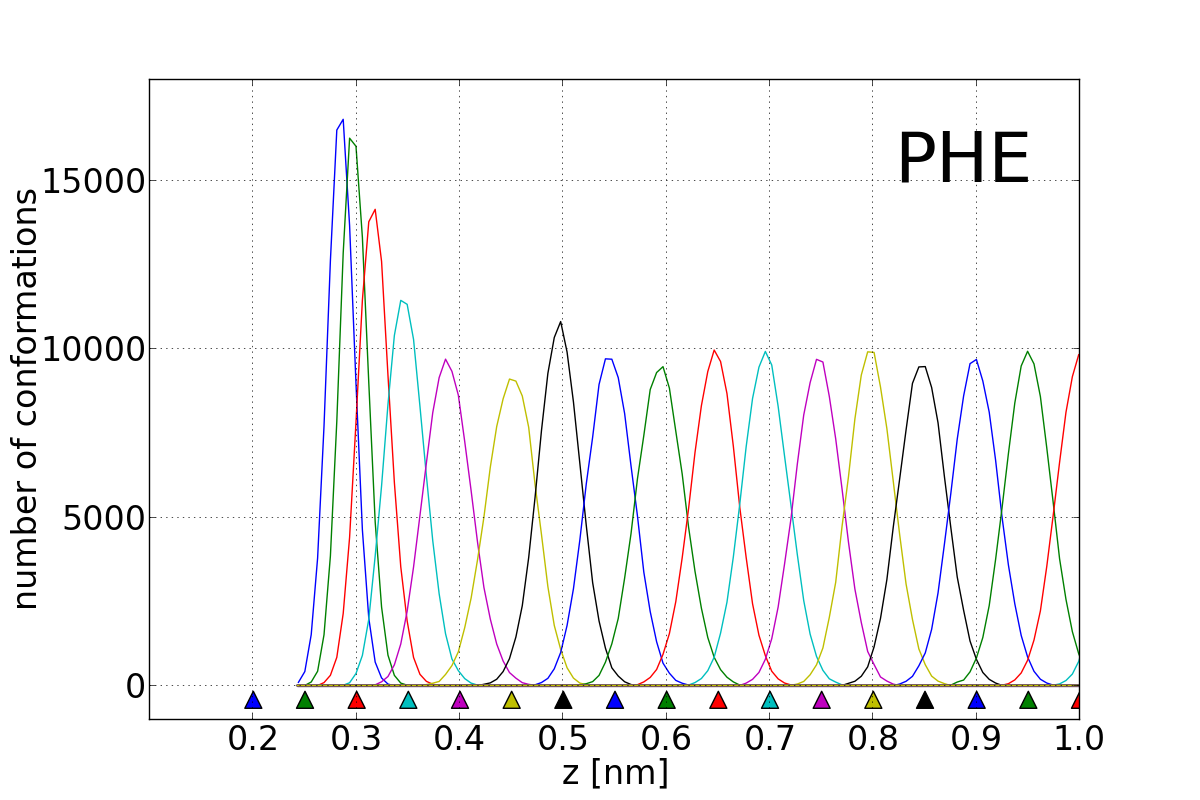
The main objective of the simulations is to determine the PMF for twenty AAs, their analogues and dipeptides. The PMF is defined as an effective potential that corresponds to the average force [55] and it is associated with the center of mass (CM) of the molecules (amino acid and dipeptides without the caps). We determine it by implementing the umbrella sampling method [56, 57]. It involves two stages. In the first stage, one generates a set of initial conformations for representative values of by pulling the CM of the object along the -axis – perpendicular to the surface of the solid. The origin of the -axis is at the center of the top atoms of gold. Pulling is implemented through a ”dummy particle” which moves towards the surface with a constant speed of 1 nm/ns from =2 nm to =0 and drags the CM by the harmonic force corresponding to the spring constant of 5000 kJ/(mol nm2). We consider 36–39 -placements of the harmonic centers and generate conformations that are saved every 0.1 ps. The histograms for each centering are found to be overlapping which signifies sufficient statistics. The lateral motion is not constrained so the PMF is averaged laterally. Overall, the average forces are calculated based on between 100 000 and 150 000 conformations for each z-placement.
In the second stage, these conformations are used for further separate runs where the -location of the pulling particle is fixed and the CM is observed to move within a sampling window of width . The elastic parameter is chosen so that ’s from neighboring bins overlap. The distribution of the resulting vertical locations of CM in the window has a maximum where the harmonic pulling force balances all forces acting along the direction. This force is averaged over time and locations within each window and is then integrated over to get the PMF. The errors in the values of the average forces are determined by the block averaging method [58] and are propagated during integration. Simulations last between 10 ns and 15 ns until the convergence of block averages is achieved. 1 ns corresponds to equilibration. The standard deviations of the average values within the umbrella sampling intervals are found to be negligible.
2.5 Contact Angle Calculations
The contact angle of water on the surface of gold in Figure 1 is determined by following a procedure developed by Ruijter et al. [59] and later adopted by Werder et al. [60] for water-carbon interaction. First, the Cartesian space coordinates of the droplet atoms are transformed to the planar coordinates (,), where is the distance from the CM of the droplet to a point on the surface. Second, the plane is covered by a fine rectangular grid and the time averaged density of atoms is evaluated. Third, the density profiles in each horizontal layer of grid points is fitted to a sigmoidal function and the center locations of the sigmoids are determined (see Fig. 1). The top and bottom portions of the droplet are discarded in these fits. Finally, a circle is fitted to these points and the contact angle between the surface and a tangent to the circle is measured.
3 Results and Discussion
3.1 Properties of Water Near the Gold Surface
From now on, we consider simulations in which water molecules in the starting state are spread out throughout the box, instead of forming a droplet.
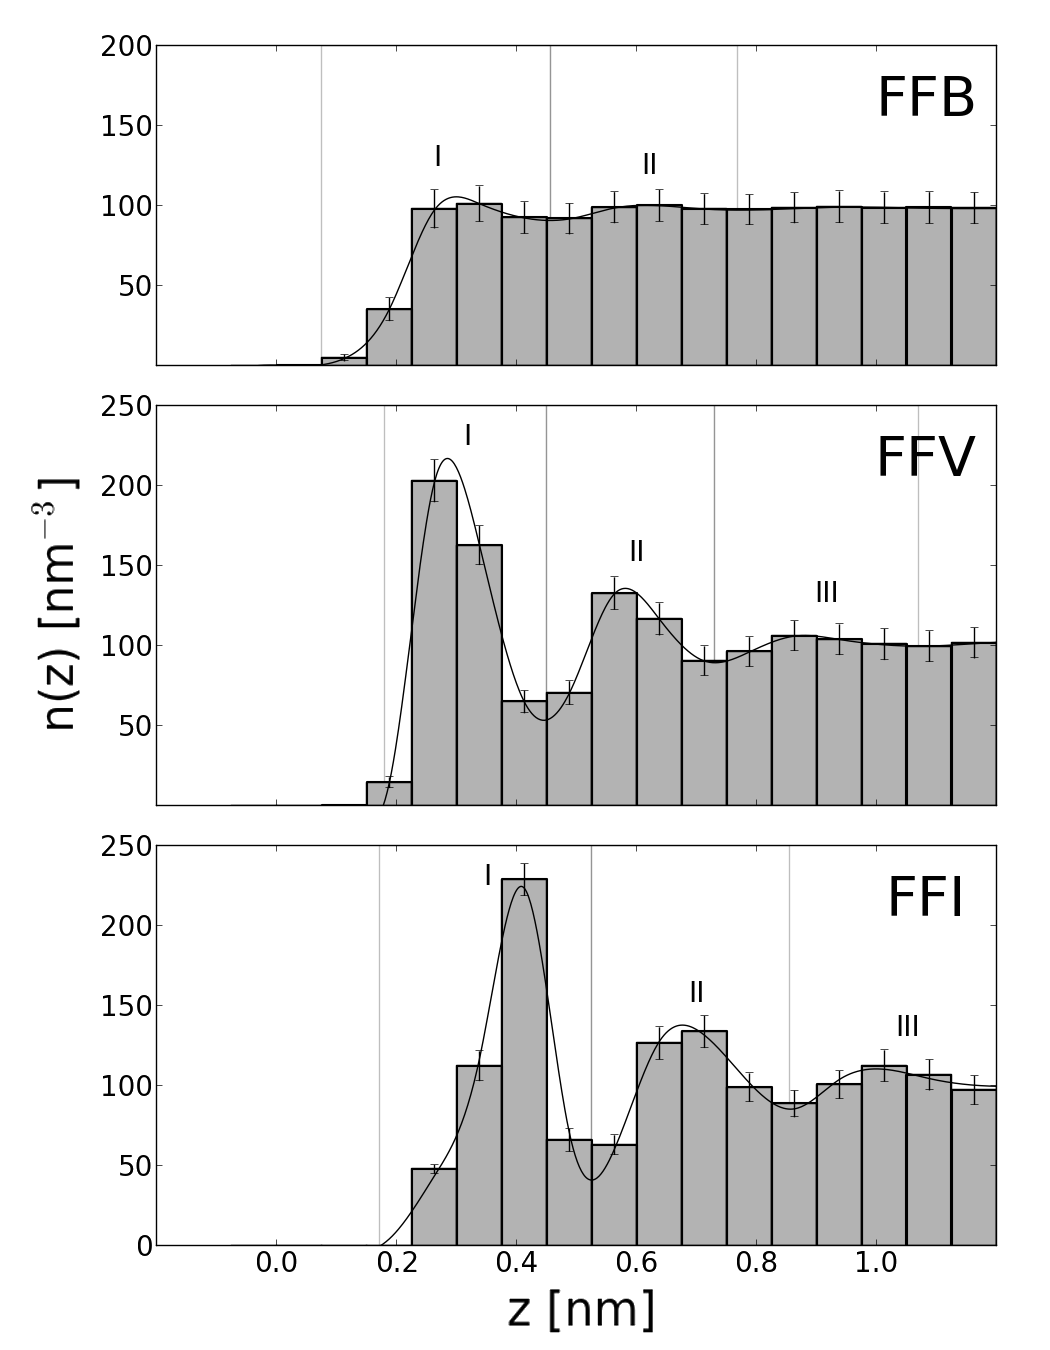
The time-averaged water density profiles for the FFV, FFB, and FFI force fields are shown in Fig. LABEL:density._The_bin_sizes_approximately_correspond_to_the_size_of_one_water_molecule_(0.142_nm). The profile above the hydrophilic FFV surface shows two well articulated layers with a minimum in the density between them. This behavior is consistent with refs. [18, 61] and the differences in the peak heights are due to different choices of the bin widths. It is also similar to what one observes in Lennard-Jones fluids [62, 63]. The region between the first value of corresponding to a non-zero density and the center of the gap is referred to as the first layer (layer I). The second layer (II) extends to the center of the second (and less articulated) gap. At still farther distances, we observe the nearly homogeneous bulk-like behavior. In the hydrophobic FFB case, on the other hand, there is a more gradual transition to the bulk value of the density, though regions I and II can still be identified as indicated in Fig. LABEL:bizzarri_den_pol. Finally, FFI clearly leads to the hydrophilic FFV-like features albeit with a more gradual buildup of the first layer on moving away from the solid in a qualitative agreement with ref. [16]. Note also that the first layer in FFI is broader than in FFV and subsequent layers are, therefore, further away from the surface by about 0.1 nm.
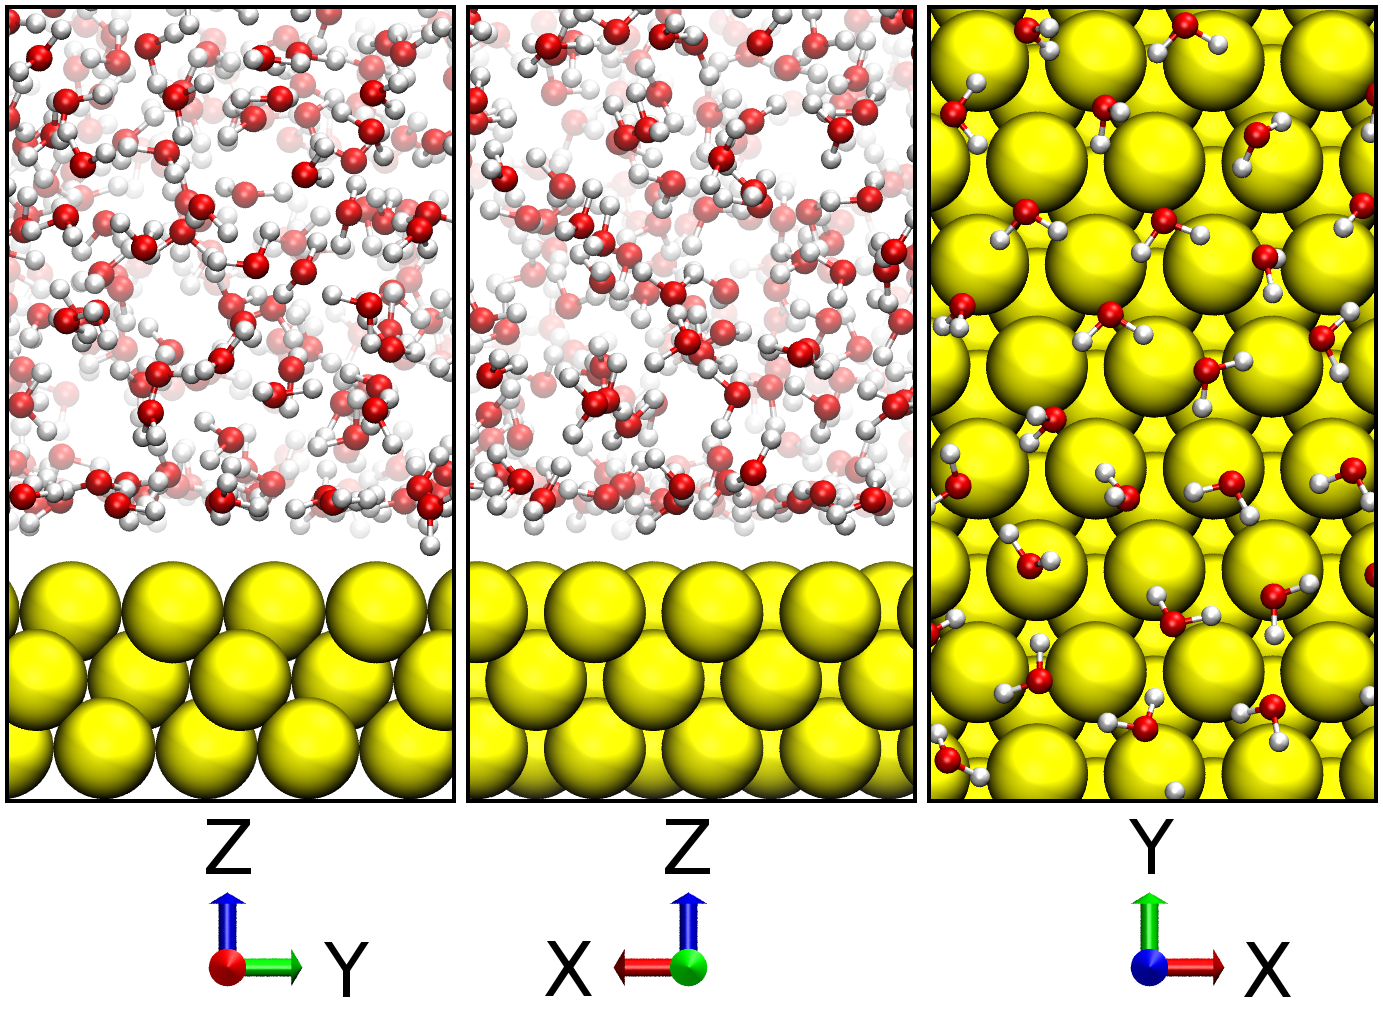
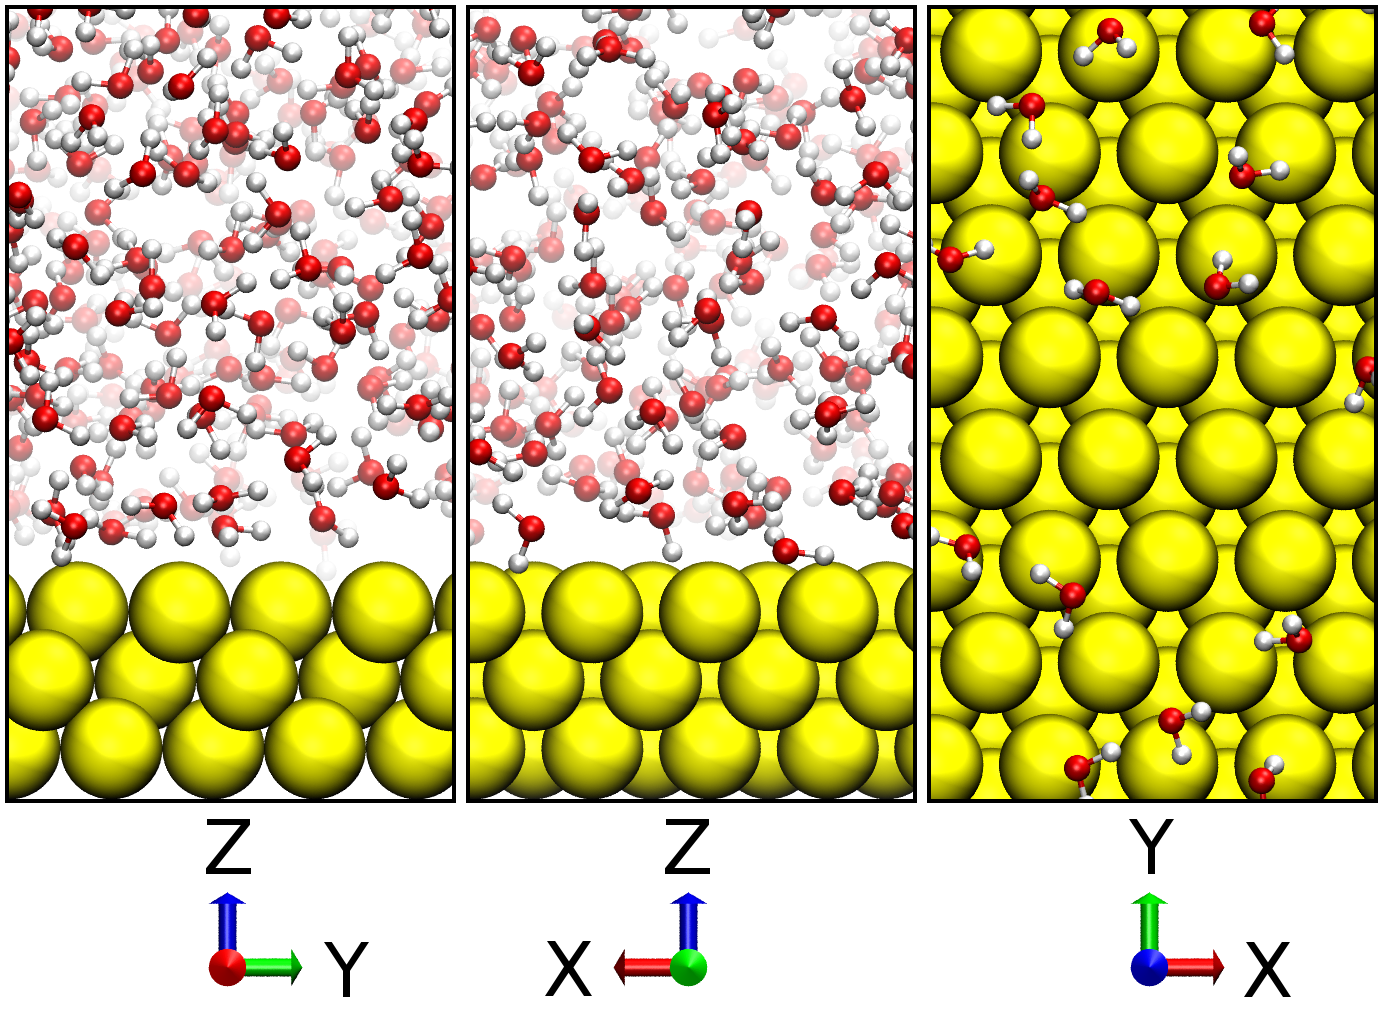
The behavior of water molecules in layer I can also be glimpsed from the snapshots in Figs. 3, 4, and 5 for FFV, FFB, and FFI respectively. For FFB, there are much fewer molecules near the surface than for FFV, but they come closer to the surface. For FFI, the situtation is between the two.
Fig. 6 shows the distributions of the component of the electric polarization of water in layers denoted as I and II in the corresponding panels at the top. These plots for FFV and FFB point to a substantial orientational disorder, even bigger than in the case of the ZnO [1] and ZnS – see Fig. 2 in ref.[28]. The case of ZnO is shown in the Supplementary Information (SI). Since for FFV and FFB the molecules of water are observed to prefer orientations that are parallel to the surface, the distributions of Pz/P are peaked close to Pz/P=0. There is some more electric order in the hydrophilic case and the molecules are seen to prefer alignments along the - and -directions (not shown). The case of FFI, however, is distinct: the molecules in layer I prefer nearly vertical local polarizations with a half of the molecules pointing up and the other half – down. This feature contributes to the broader width of layer I for FFI and distinguishes between the two hydrophilic models. In FFI, the molecules of water tend to be located just above the dipoles representing the polarization of gold.

3.2 Potentials of the Mean Force for Amino Acids
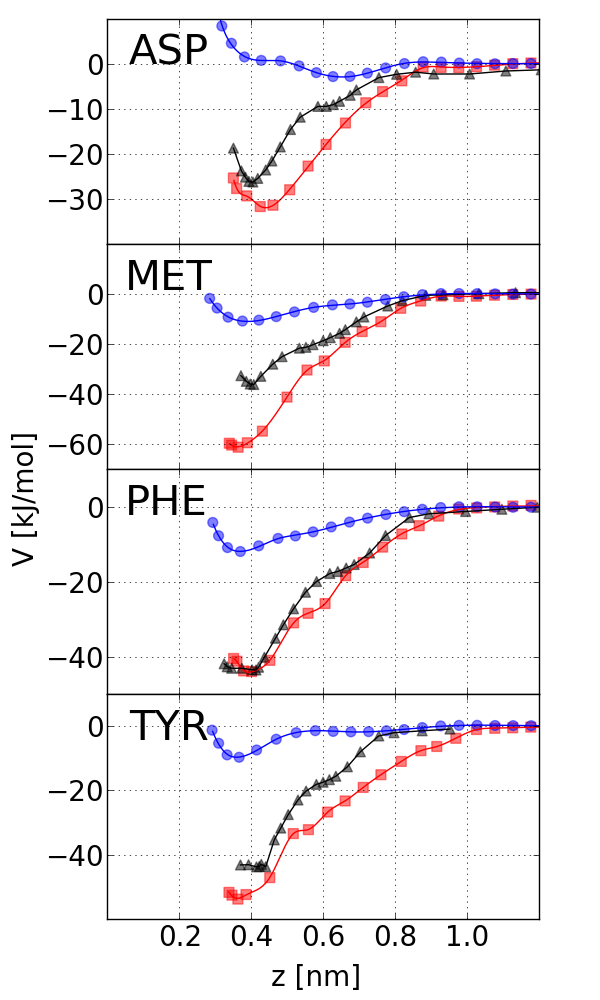
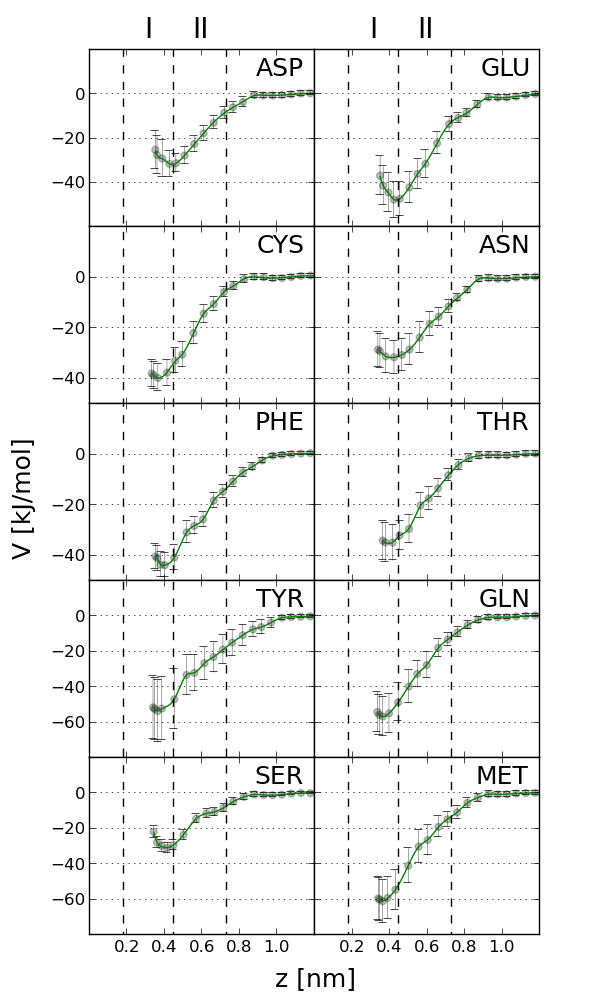
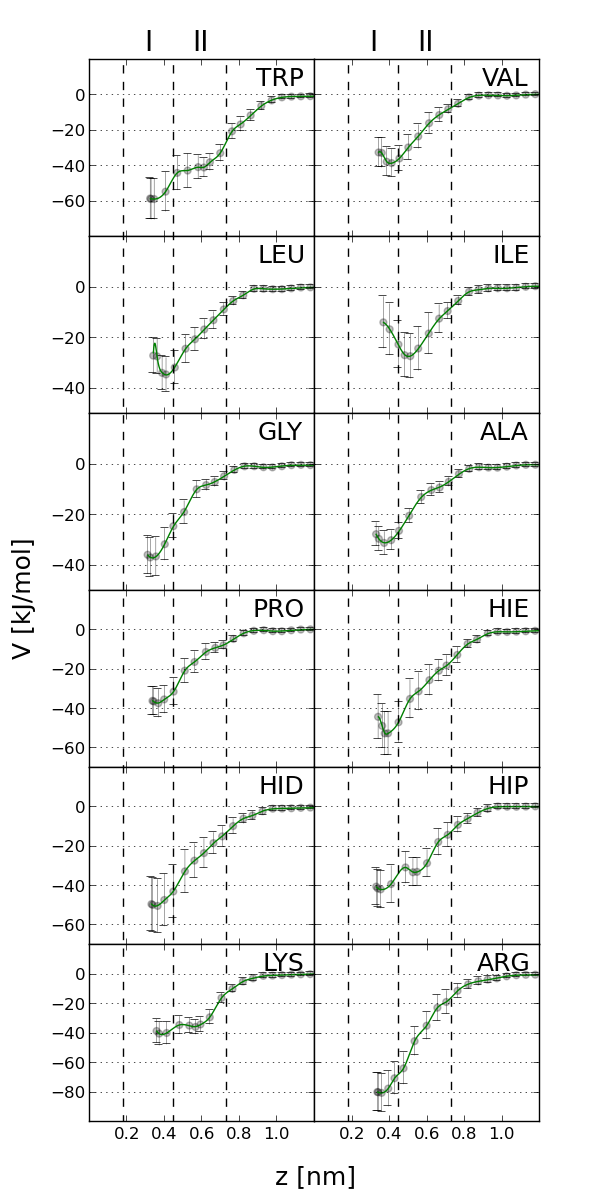
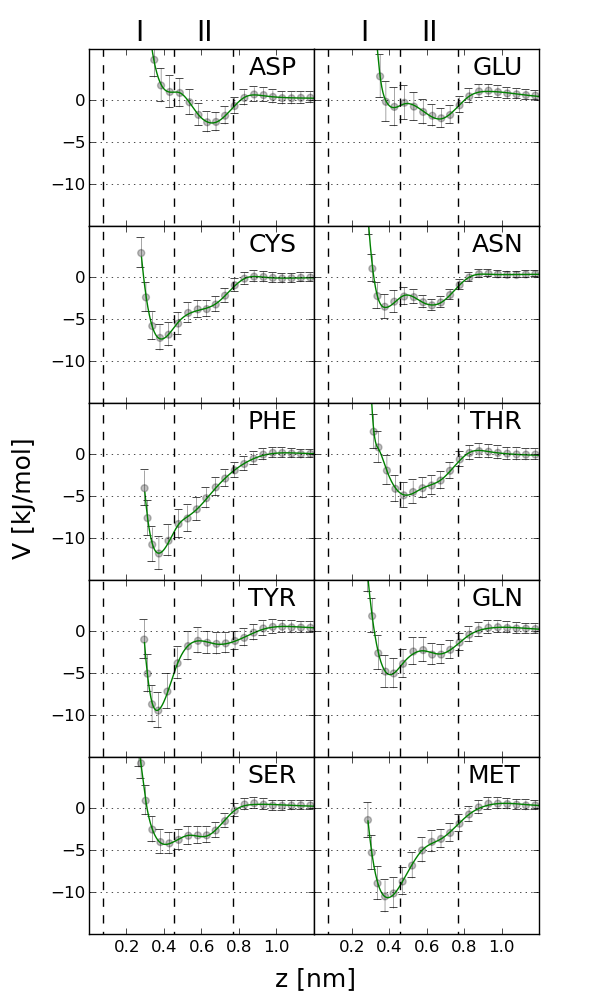
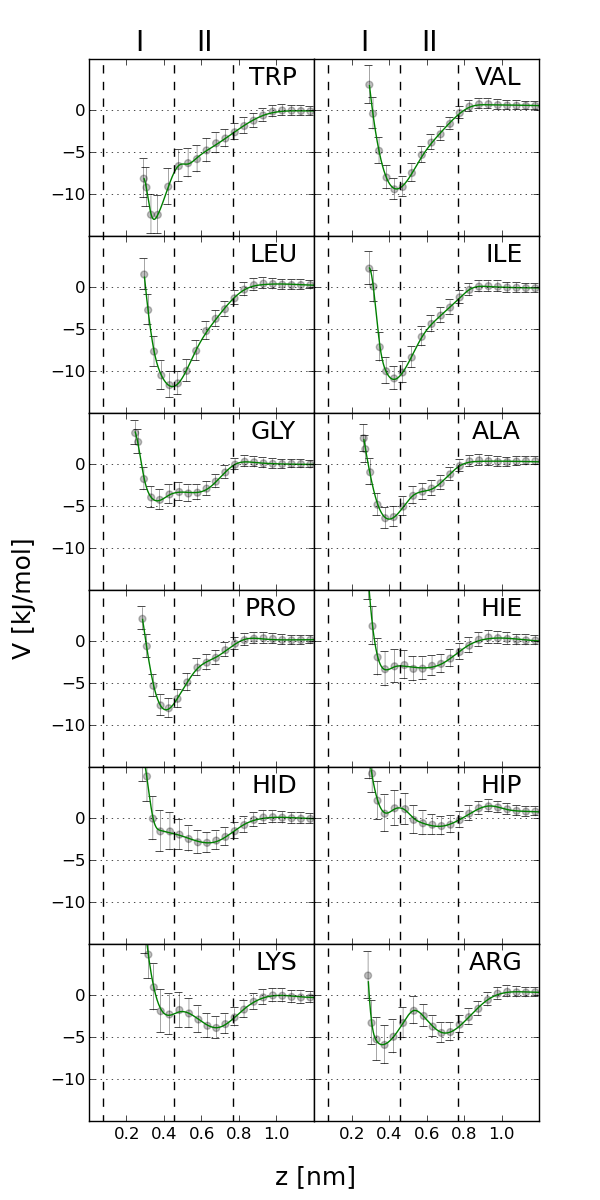
Fig. 7 shows PMFs for the capped ALA, MET, PHE, and TYR for the three force fields considered here. The hydrophobic FFB leads to the potential wells which are shallow and FFV to wells which are deep. FFI is in between, except that for PHE it almost coincides with the line for FFV. Figs. 5 and 6 in SI show plots of the PMFs for all twenty capped AAs near the FFV and FFB surfaces respectively. Most potentials have a single and well defined minimum, but there are also some, especially in the FFB case (see ASN, GLN, LYS, ARG), which come with two minima. The binding energies and bond lengths ( the locations of the minima in the PMF) corresponding to the lowest minimum are summarized in Tab. 1. For FFB, the error bars vary between 1.0 and 2.5 kJ/mol. For FFV, they are larger in absolute terms as they vary between 3.1 and 13.6 kJ/mol but smaller percentage wise. The error bars in the parameter sigma are always smaller than 0.0022 nm and are not listed. The table also shows results for FFI obtained by Hoefling et al. [15]. Our own recalculation for PHE confirms their value within the error bars. Unlike what happens for ZnO and ZnS, we find no AA that would be repelled by gold.
| AA | hydrophobic FFB | hydrophilic FFV | polarizable FFI | ||
| [kJ/mol] | [nm] | [kJ/mol] | [nm] | [kJ/mol] | |
| ASP | 2.7 1.2 | 0.65 | 31.7 4.9 | 0.44 | 25.5 |
| GLU | 2.2 1.2 | 0.66 | 47.9 7.9 | 0.43 | 17.5 |
| CYS | 7.3 1.4 | 0.38 | 39.7 5.2 | 0.37 | 37.7 |
| mCYS | 251.1 2.5 | 0.36 | – | – | – |
| ASN | 3.6 1.3 | 0.38 | 31.7 6.7 | 0.41 | 26.1 |
| PHE | 11.7 1.9 | 0.37 | 43.9 4.9 | 0.39 | 43.6 (35.99.8) |
| THR | 4.8 1.4 | 0.49 | 35.2 7.3 | 0.39 | 28.9 |
| TYR | 9.4 2.2 | 0.36 | 53.3 17.7 | 0.36 | 44.2 |
| GLN | 5.1 1.8 | 0.40 | 56.6 11.2 | 0.36 | 28.6 |
| SER | 4.3 1.3 | 0.40 | 30.7 3.1 | 0.41 | 23.1 |
| MET | 10.6 1.8 | 0.39 | 60.7 12.1 | 0.36 | 39.3 |
| TRP | 12.9 2.3 | 0.34 | 58.6 11.5 | 0.34 | 40.2 |
| VAL | 9.3 1.2 | 0.43 | 38.4 8.0 | 0.40 | 24.8 |
| LEU | 11.7 1.4 | 0.44 | 34.6 6.7 | 0.41 | 25.4 |
| ILE | 10.9 1.5 | 0.42 | 27.2 8.8 | 0.50 | 25.1 |
| GLY | 4.3 1.2 | 0.36 | 36.9 7.6 | 0.33 | 23.6 |
| ALA | 6.5 1.2 | 0.40 | 31.0 3.9 | 0.37 | 21.9 |
| PRO | 8.1 1.2 | 0.41 | 37.0 7.2 | 0.36 | 26.0 |
| HIE | 3.4 1.9 | 0.38 | 52.8 11.0 | 0.38 | 34.0 |
| HID | 2.9 1.1 | 0.63 | 50.2 13.6 | 0.35 | |
| HIP | 0.9 1.2 | 0.66 | 41.8 9.5 | 0.36 | 40.8 |
| LYS | 3.8 1.4 | 0.67 | 40.7 7.7 | 0.38 | 30.0 |
| ARG | 5.8 2.5 | 0.36 | 80.3 12.9 | 0.35 | 36.3 |
| AAsa | 6.93.4 | 0.440.10 | 43.212.9 | 0.390.04 | 30.17.5 |
| AAsb | 18.552.1 | 0.440.10 | – | – | – |
a Average and dispersion for all AAs with CYS and b with mCYS.
All AAs are observed to have optimal binding resulting from a direct interaction with gold (only spot-checked for FFI, but fully for FFV and FFB) as reflected in the values of in Table 1. This is distinct from the situation with ZnO and ZnS where water affects the couplings significantly. In the case of ZnO [1] adsorption of AAs occurs through the first layer of water (the CM of an AA is above it). For ZnS [28], this is the situation for most of the AAs.
On average, FFV yields that is about six times stronger than FFB, and FFI – about four times stronger. The specificity can be measured by the ratio of the standard deviation to the mean over the AAs. It is 49%, 30% and 25% for FFB, FFV, and FFI respectively. Thus the hydrophobic surface yields smaller couplings but distinguishes between AAs better. FFI is the least specific.
The strongest binders in FFB are the hydrophobic TRP, LEU and PHE because binding with the hydrophobic surface minimizes their contact with water. In FFV the strongest binders are the charged ARG, and hydrophobic MET and TRP, then polar GLN and the uncharged forms of HIS (HID and HIE). This is probably due to a good spatial adjustment of the atoms in large residues to the hexagonal network of the gold atoms. For FFI, the aromatic TYR, PHE, and TRP bind the best. The FFV results are consistent with the preferences established experimentally, as summarized by Corni et al. [64]. Also, the fact that the adsorption energy of ARG is twice as big as for LYS, despite the fact that both are positively charged, is consistent with the experimental results obtained for polyarginine and polylysine [65].
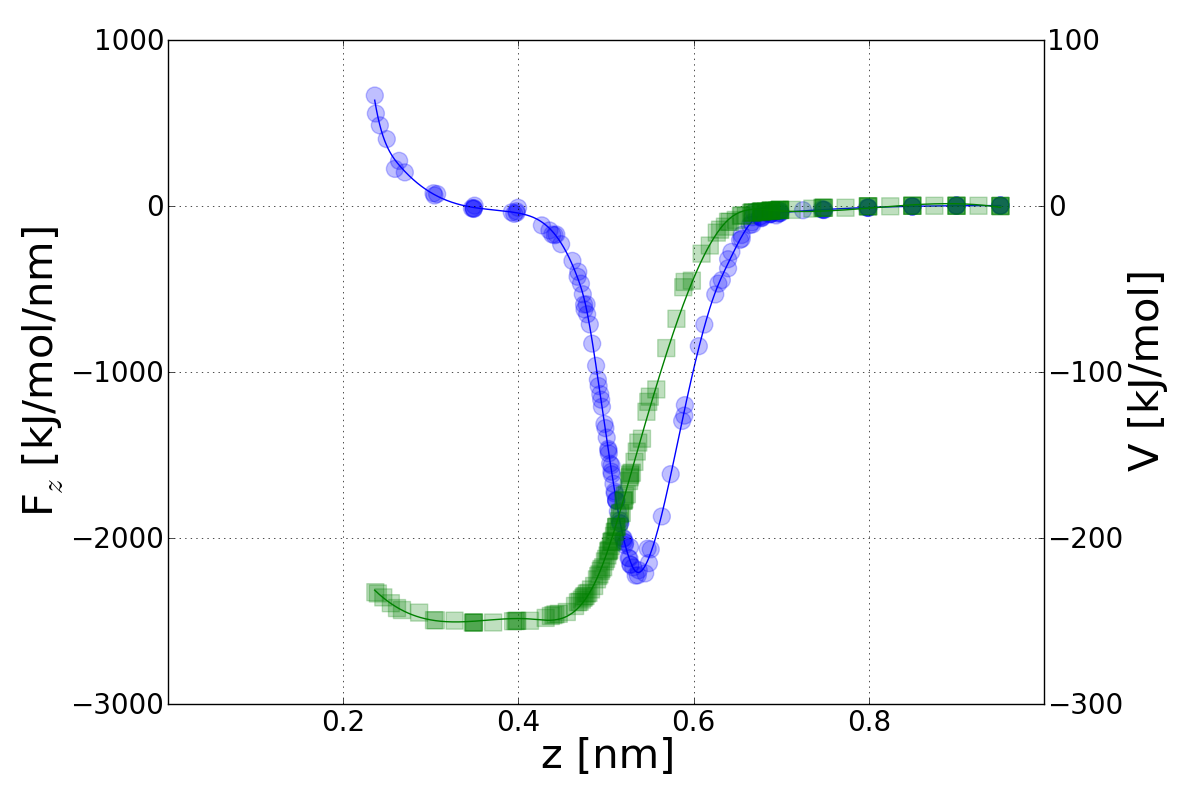
Table 1 has two lines that relate to cysteine. One is denoted as CYS and another by mCYS. The former does not include the covalent bond and the latter does. The notation is as in ref. [28] and ”m” stands for ”modified”. It is easier to include the covalent bond in the hydrophobic FFB case, since Bizzarri et al. [21] have provided parameters for its description by the permanent harmonic coupling. We replace the harmonic coupling by the Morse potential and make use of the corresponding harmonic parameters. Determination of the PMF in this case required more frequent distance sampling of the attractive region and application of a wide range of the pulling spring constants in the umbrella sampling. The resulting average force and PMF are shown in Fig. 8. The binding energy of 251.1 kJ/mol is 34 times larger that when the covalent effects are not included and is about the same as the dissociation energy of S-Au bond (253.6 kJ/mol) [51]. A similar enhancement is expected for the other two force fields. It is interesting to note that even though the potential well gets deeper, its width remains about the same. Thus the protein must get to the surface to form a bond. The migration at distances larger than 1 nm from the surface is through difussion and at distances that are shorter – through a combination of diffusion and the pull of the surface modified by the adsorbed water. We find that a free evolution of cysteins ( not constrained as in the calculation of the PMF) leads to a rapid adsorption to gold (within 10 ns) and to no desorption events during the time scale of the simulations – eight trajectories of 20 ns each.
3.3 Amino Acids Side Chains Analogues
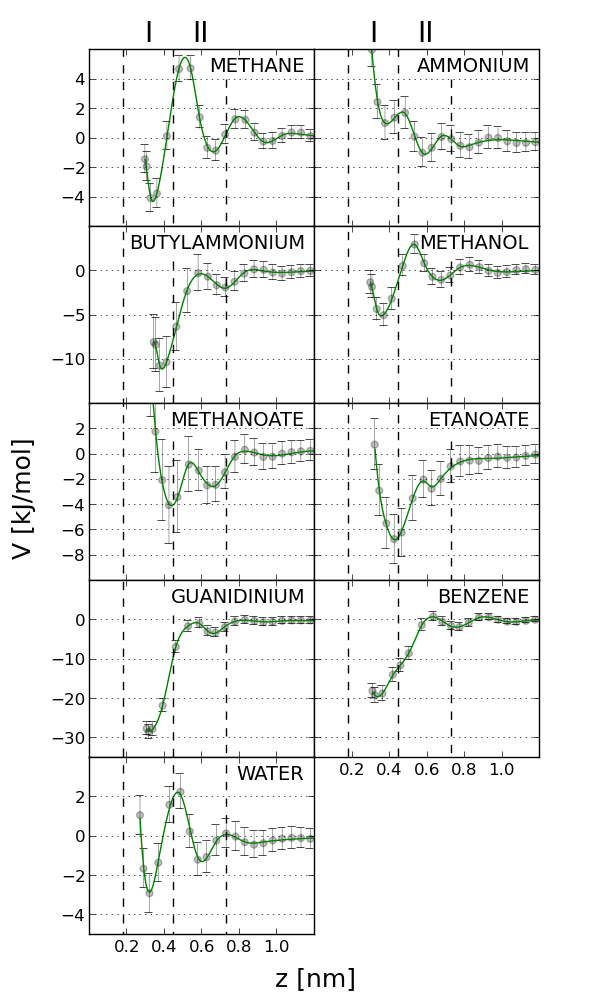
A capped AA may bind to the surface through various groups: Cα-H, -NH and -CO in the peptide bond, side groups or their fragments, as well as the caps CH3-HN- and -CO-CH3. In order to bring the role of the side groups out it is interesting to consider molecules which are analogues of the side chains. This approach has been suggested by the studies of the analogues near the surfaces of TiO2 [66] and quartz [67]. Table 2 summarizes the results obtained with FFV. The error bars vary between 1.0 and 2.9 kJ/mol. The plots of the PMFs are shown in Fig. 7 in the SI. The highest binding energy in the table is for guanidinium which is an analogue of a part of the side chain in ARG (the side chain consists of the 3-carbon aliphatic chain which is ended by guanidinium). This result is consistent with the highest found for ARG itself (see Table 1). The binding energy for guanidinium is seen to be 35% of that for ARG.
| AN | AA | ||||
|---|---|---|---|---|---|
| [kJ/mol] | [nm] | [kJ/mol] | [nm] | ||
| METHANE | 4.3 1.0 | 0.34 | ALA | 31.0 3.9 | 0.4 |
| AMMONIUM | 1.1 1.0 | 0.59 | LYS | 40.7 7.7 | 0.4 |
| BUTYLAMMONIUM | 11.1 2.9 | 0.39 | LYS | ||
| METHANOL | 5.1 1.3 | 0.35 | SER | 30.7 3.1 | 0.4 |
| METHANOATE | 4.0 2.9 | 0.43 | ASP | 31.7 4.9 | 0.4 |
| ETHANOATE | 6.7 1.9 | 0.43 | ASP | ||
| GUANIDINIUM | 28.2 1.7 | 0.32 | ARG | 80.3 12.9 | 0.4 |
| BENZENE | 19.4 1.9 | 0.33 | PHE | 43.9 4.9 | 0.4 |
| WATER | 2.8 1.0 | 0.32 |
The second biggest in Table 2 is for benzene which is an analogue of the ring in the main part of PHE side chain and it constitutes 44% of the binding strength for PHE. The third biggest is for butylammonium – an analogue of the complete side chain of LYS (27%). ARG binds about twice as strong than LYS and PHE in FFV whereas guanidinium 3 times as strong that butylammonium and 1.5 as strong than benzene. Generally, the relative -based ranking of the analogues (guanidinium, benzene, butylammonium, ethanoate, and methane) is mostly the same as their corresponding AAs (ARG, PHE, LYS, ASP, and ALA). Ammonium and metanoate are less complete analogues of their corresponding AAs and they do not follow the trend. Despite the exceptions, the existence of the trend suggests that all groups in capped amino acids, but the side chains, have the same contribution to the total binding energy and the differentiation comes solely from the side chains.
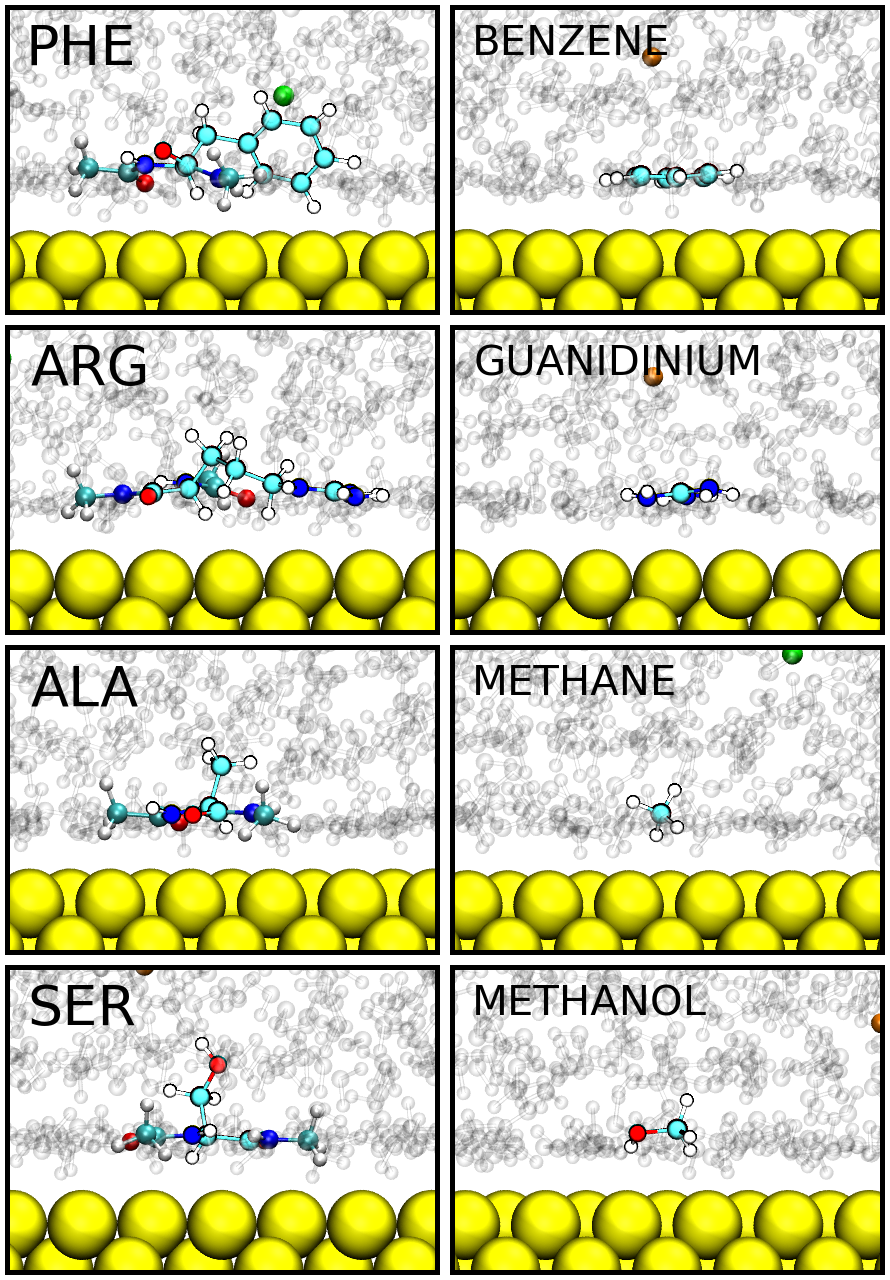
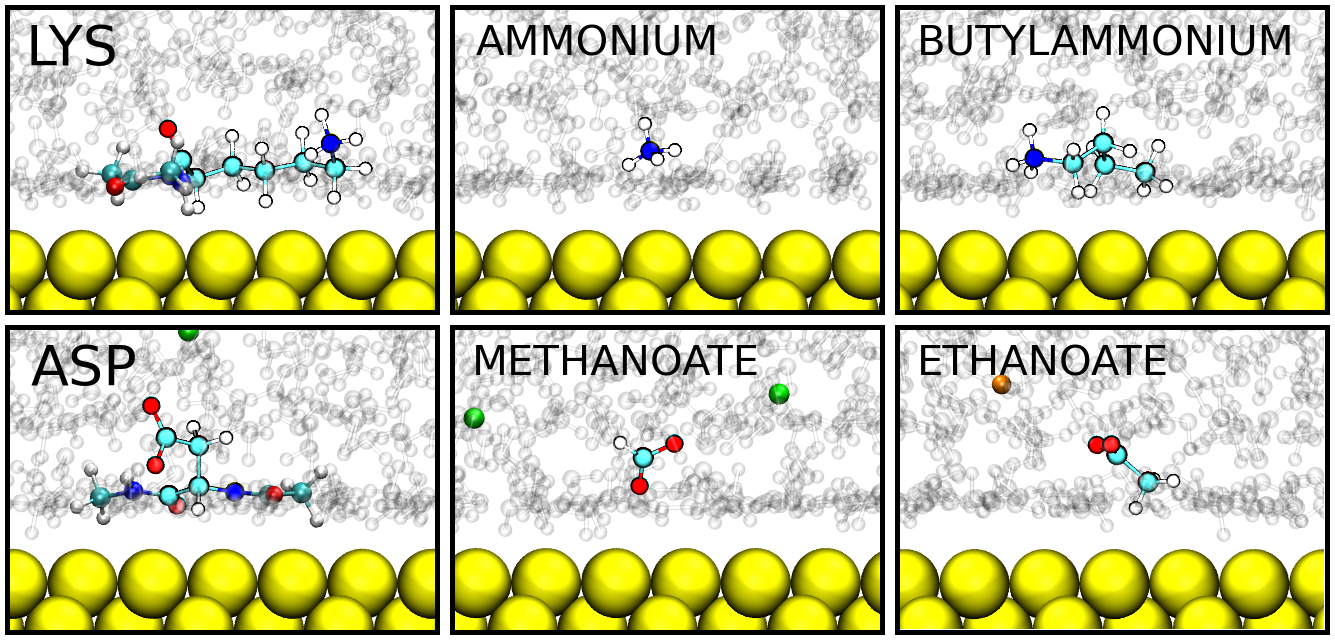
Examples of the optimal conformations ( those corresponding to the vicinity of the lowest minimum in PMF) of the analogues shown in Figs. 9 and 10 can be distinct from their corresponding side chains in the capped AAs. Three (ALA, SER, ASP) out of the six AAs shown there do not bind to the surface by the side chains but by all other groups, since the side chains seek water. This is consistent with the fact that the binding energies of the three AAs are just slightly smaller than that for GLY (36.92 KJ/mol) with H as its side group. At the same time, their analogues (methane, methanol, methanoate, and ethanoate) do bind to the surface. On the other hand, the remaining three AAs (PHE, ARG, LYS) connect by all groups including the side chains and behave like their analogs which explains the top values of for these molecules. PHE, ARG, and LYS have long side chains and can adjust to the surface better than the short chains of ALA, SER, ASP, and their analogues.
Notice that only ammonium (in LYS, ammonium and butylammonium) does not overcome the first water layer during adsorption. This seems to be in agreement with the simulation of single water molecule, since ammonium is the only analogue of lower binding energy.
3.4 Dipeptides on the Hydrophobic Surface
We now consider capped dipeptides. Due to the interactions between the two side groups and the expected relative decrease of the role of the capped groups, dipeptides should have PMFs which are not simply superpositions of the potentials derived for the constituent single AAs (see also ref. [54]). We shall illustrate this point here for the hydrophobic FFB model.
First, we select six characteristic AAs: the positively charged LYS, negatively charged ASP, polar SER, hydrophobic LEU, cyclic PHE, and the smallest GLY. We combine them into dipeptides in all possible ways. Additionally, for one combination, SER–GLY, we also consider its reverse, GLY–SER and observe the effect of the reversal to be minor (the sequence in a peptide chain is counted from the N to the C termini).
| [kJ/mol] | LYS | ASP | SER | LEU | PHE | GLY | |
|---|---|---|---|---|---|---|---|
| 3.8 | 2.7 | 4.3 | 11.7 | 11.7 | 4.3 | ||
| LYS | 3.8 | 2.1 1.2 | |||||
| ASP | 2.7 | 4.2 2.0 | – | ||||
| SER | 4.3 | 3.4 2.0 | 2.0 1.6 | 2.7 1.2 | 3.45 1.4 | ||
| LEU | 11.7 | 7.9 1.8 | 7.4 2.1 | 9.8 1.7 | 14.1 1.9 | ||
| PHE | 11.7 | 11.7 3.0 | 8.8 2.2 | 11.6 2.2 | 13.3 2.2 | 15.7 3.7 | |
| GLY | 4.3 | 3.1 1.6 | 1.3 1.3 | 3.6 1.8 | 10.6 1.6 | 7.9 2.1 | 3.7 1.4 |
Fig. 11 shows the PMF plots for 22 combinations and compares them with the plots for the constituent single AAs. The binding energies are summarized in Tab. 3. The bond lengths, , for the dipeptides are generally larger than for the single AAs and the potential wells are wider. Both of these features simply reflect the bigger size of the molecules. Figs. 12 and 13 show optimal conformations for selected homo- and hetero-dipeptides respectively. They demonstrate that the side chains of the two AAs interact with one another which prevents adoption of conformations that would be optimal individually.
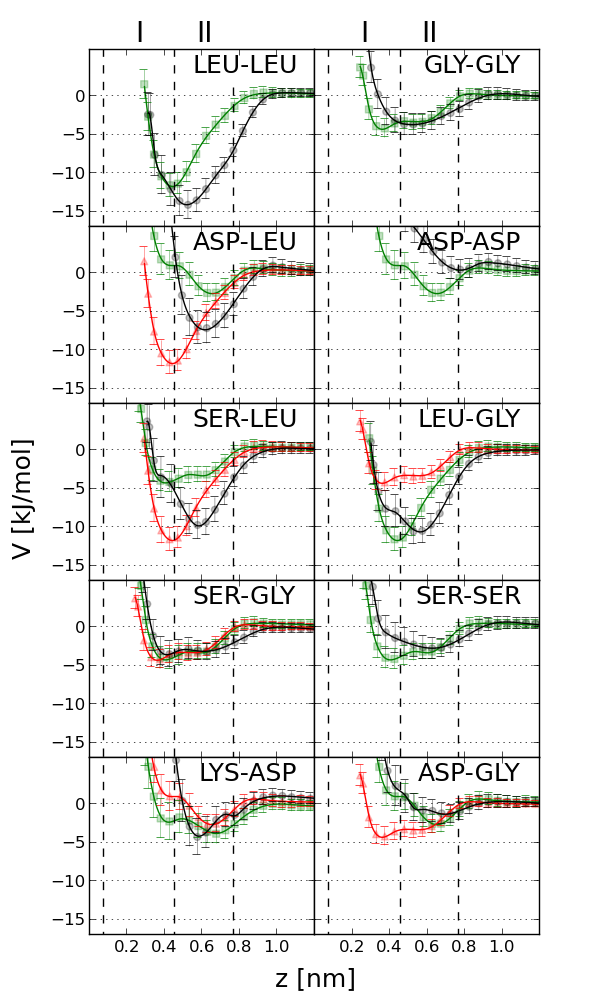
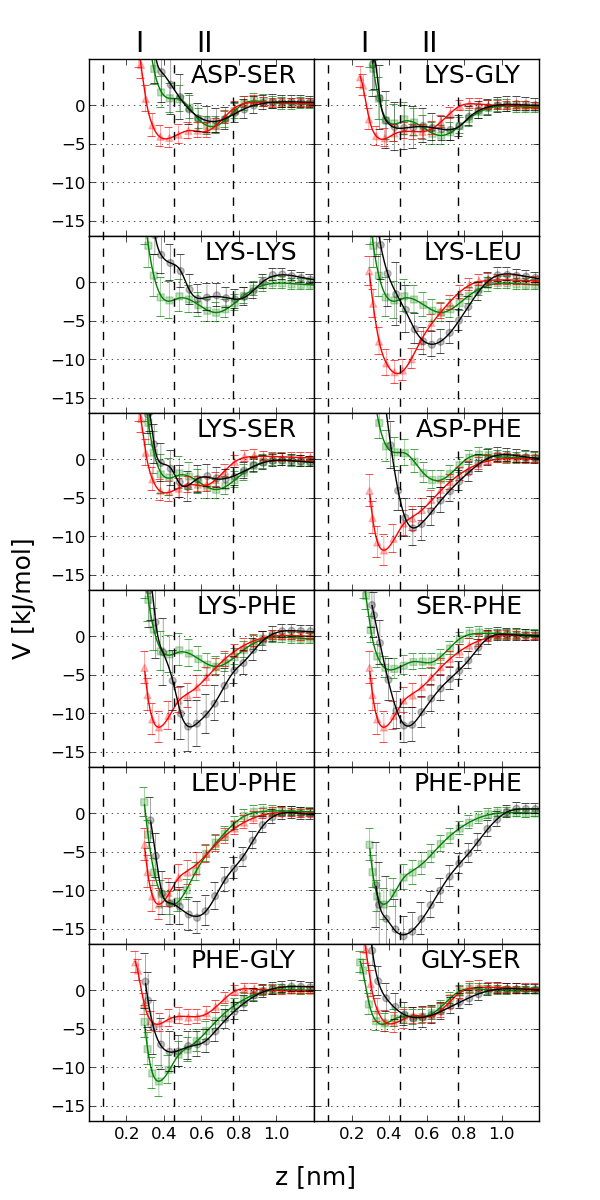
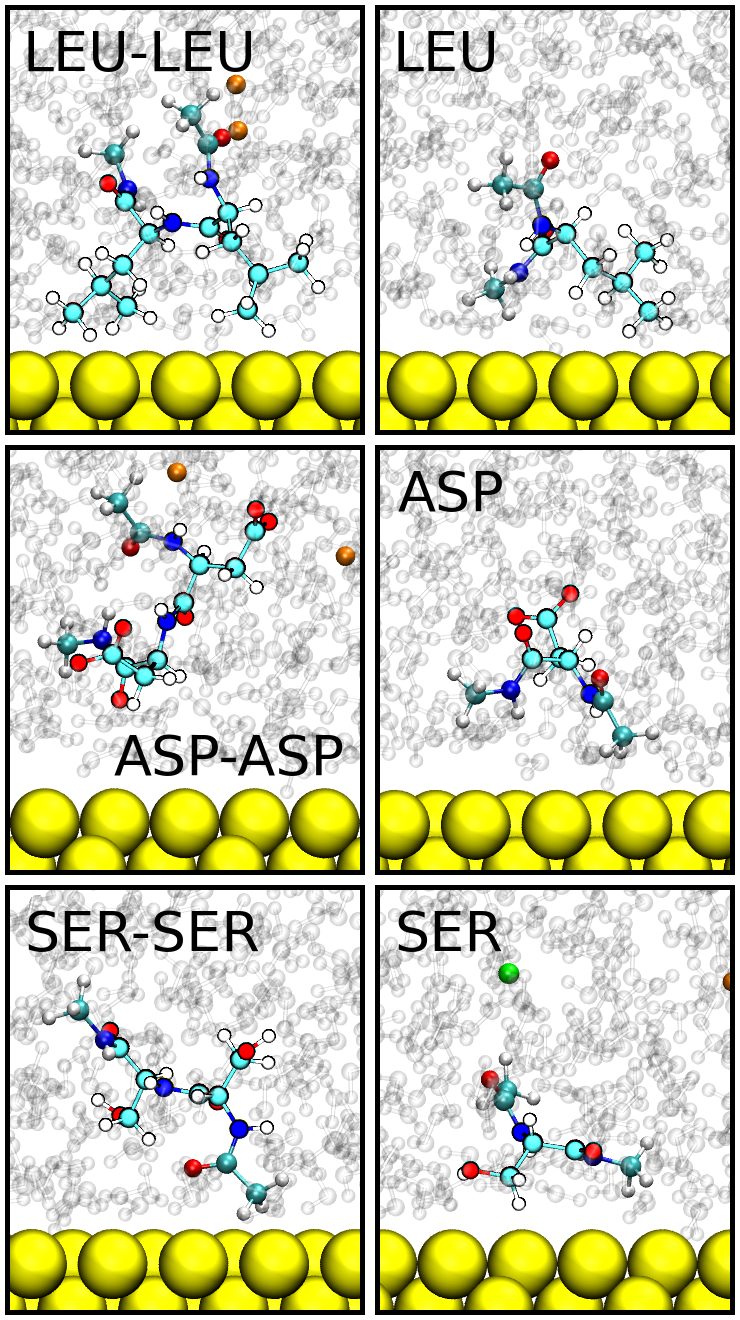
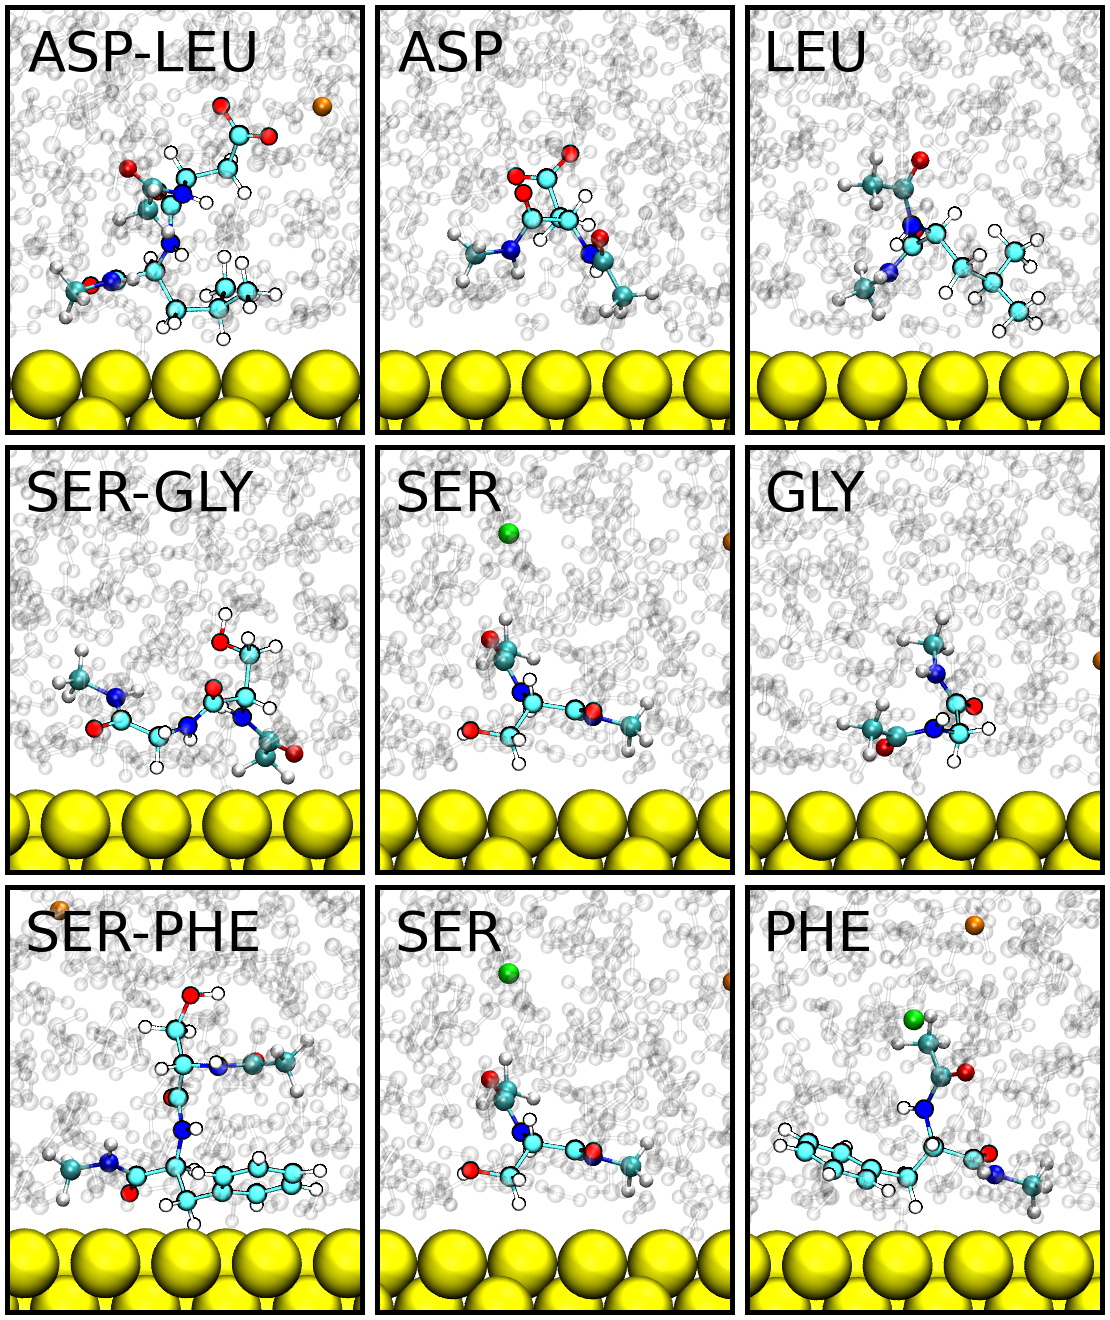
More interestingly, we observe that when two strongly binding AAs combine (PHE–LEU, LEU–LEU, and PHE–PHE) then the resulting is bigger than each of the individual contributions but smaller than the sum of them. For instance, LEU binds to gold through two hydrophobic alkyl (methyl) groups (one in the cap) and LEU–LEU through three such groups. If one of them adopts a favorable conformation then the other must point in the ways which are less favorable. This can be brought out by considering the radius of gyration, , of the entities without the caps. For the single LEU in the top right panel in Fig. 12, is 0.218 nm. On the other hand, the first LEU in the dipeptide ( counting form the left in the left top panel) has an of 0.208 nm and the second – 0.238 nm. The corresponding value of the radius of gyration around the axis, , are 0.191 nm, 0.167 nm, and 0.216 nm. Thus the the first LEU gets contracted and the second expanded on contact with the surface. As a result the binding energy for LEU–LEU is stronger than for LEU but is not twice as big. ASP binds with the surface weakly and the attraction is provided primarily by one of the caps since the charged group is seen to be repelled by the surface. For ASP-ASP the binding disappears completely which indicates that the caps lead to an overestimation of for single AAs. A similar situation takes place for SER and SER–SER, except that the dipeptide still binds. SER binds through the cap and the nonpolar group of the side group (CH2) whereas the polar group (OH) is attracted to water. The presence of the second SER disallows adoption of such a conformation and binding is implemented solely by the cap.
In heterodipeptides, the binding energy is often in between the individual values of . For instance, ASP–LEU binds through the stronger coupling LEU, the presence of ASP leads to a reduction in the strength of the coupling (the side group of ASP seeks water). Similarly, GLY and SER–GLY both connect to gold through Cα-H2 and the cap but for the dipeptide is smaller than for GLU. SER–PHE binds nearly as strongly as PHE because SER is exposed to water without affecting the conformation of PHE too much.
3.5 Adsorption of Tryptophan Cage to Gold
We finally consider adsorption of tryptophan cage. This is a small protein with the Protein Data Bank structure code of 1L2Y and it has no caps. It comprises 20 AAs and none of them is a cysteine. Its structure looks like a hairpin with one branch forming the -helix (sites 2 through 8). There is a turn at site 10 and the 3/10-helix at 11 through 14. If one uses the hydropathy scale of Kyte and Doolittle [68] then one infers that the protein is overall hydrophilic (with the net hydropathy index of -19).
Instead of determining the PMF for 1L2Y, which is difficult to do adequately, we simulate a free evolution of 20 ns and monitor events that result in adsorption. In the initial state, the CM of the protein is placed at 2 nm above the gold surface and in the eight trajectories studied, for each force field, the initial orientations are distinct. Unlike the situation with ZnO and ZnS [1, 28], where the values of are weaker, adsorption is driven by the AAs which we find to have the deepest single-AA PMFs and the adsorption events are long lasting.
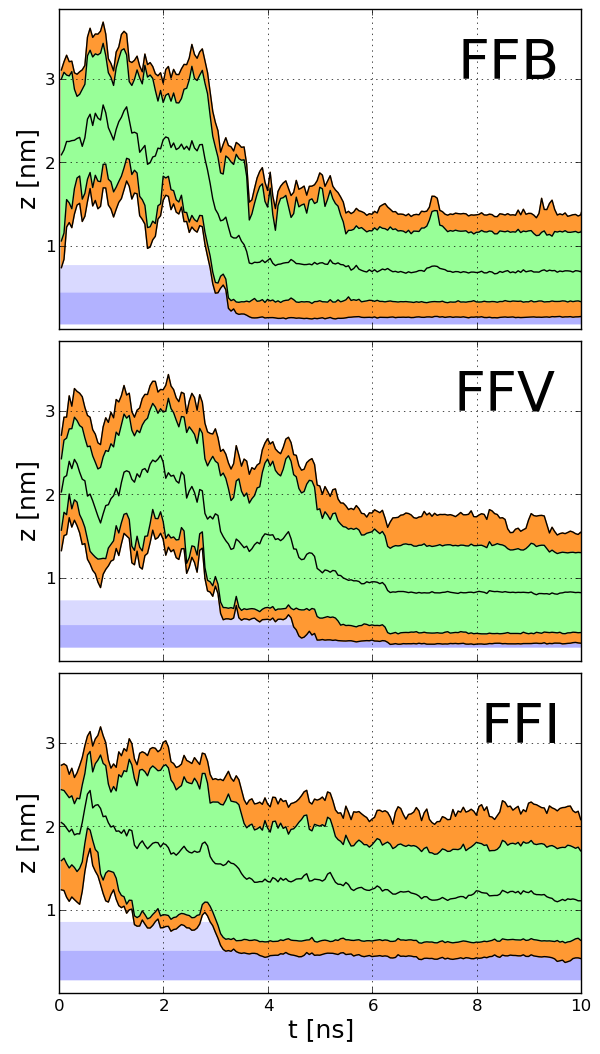
Examples of the adsorption events are given in Fig. 14 which shows vertical distances of characteristic locations in the protein as a function of time. The central lines show the behavior of the CM of the protein. Even though FFB provides couplings which are the smallest in strength, the CM with this field comes closest to the surface: it enters the second layer of water. For FFV, the CM comes just above the second layer and for FFI it is substantially further away which is consistent with the overall weaker couplings in FFI compared to FFV. Adsorption results in deformation and, judging by the differences in vertical heights between the highest and lowest atoms, the top panel corresponds to the biggest vertical flattening of the protein and the bottom panel to the smallest, to the largest vertical extension (the initial extension depends on the orientation). This is consistent with the values of of 0.573 nm, 0.545 nm, and 0.516 nm for the top-to-bottom panels respectively. On averaging over eight trajectories, we get nm, nm, and nm for FFB, FFV, and FFI respectively, with the standard radii of gyration of nm, , and nm whereas the native value (in the absence of gold) is about 0.78 nm. The average and components are correspondingly: 0.74 and 0.55; 0.73 and 0.58; 0.73 and 0.60 nm.) We conclude that, within the error bars, the three force fields yield comparable distortions.
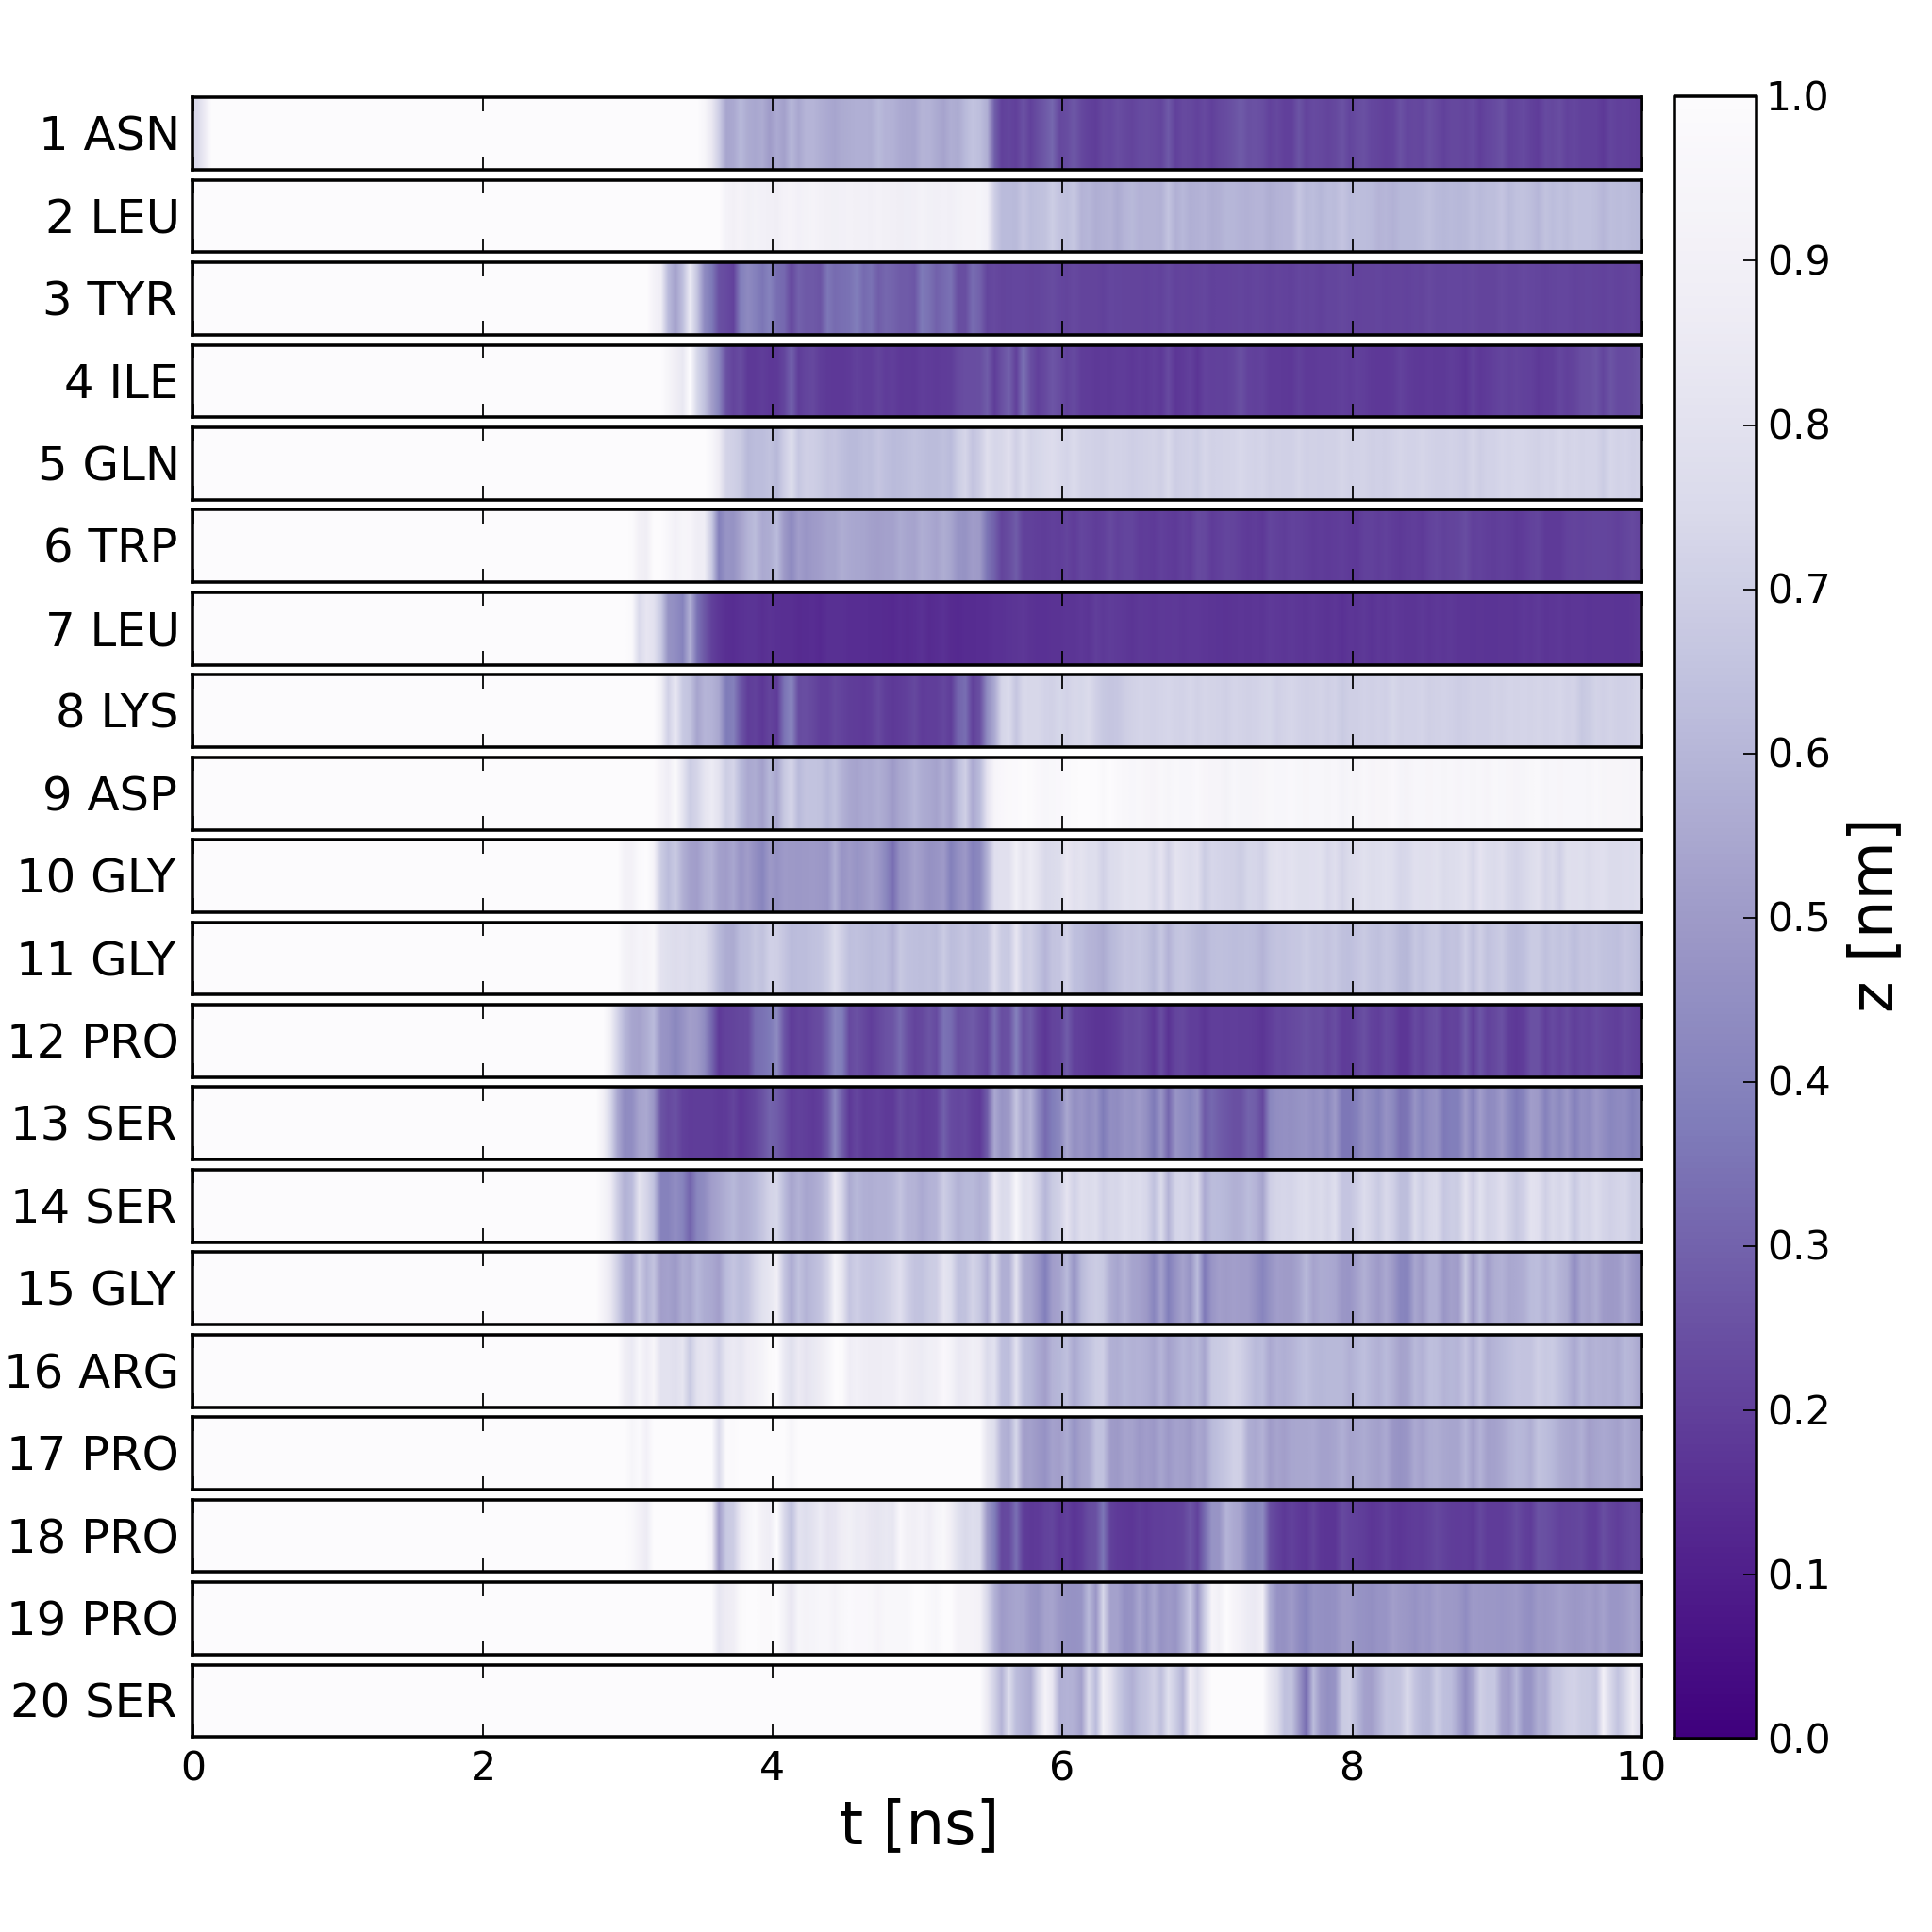
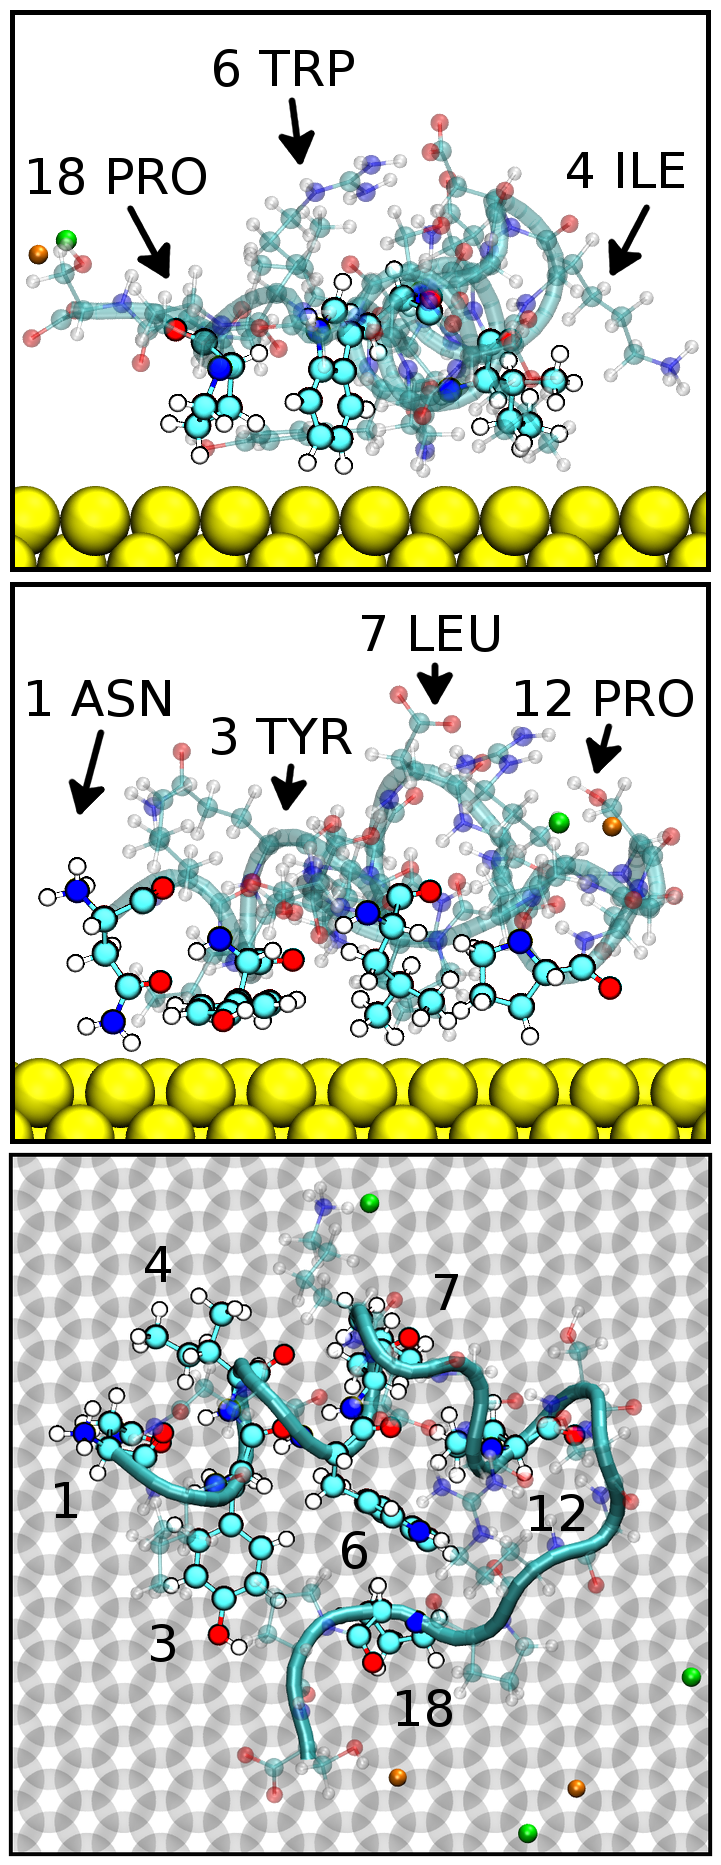
We now discuss the identity of the adsorbed AAs. Fig. 15, for FFB, shows the vertical positions for each site in the sequence (the darker the tint, the deeper the lowest atom. It is seen that the AAs that participate in the adsorption are 1 ASN, 3 TYR, 4 ILE, 6 TRP, 7 LEU, 12 PRO, and 18 PRO. All of them but 1 ASN are the strongest binders listed in Tab. 1 for FFB, considering that the protein has no GLU, CYS, PHE, and MET in its sequence. Five of these binding AAs belong either to the - or 3/10-helix, which correspond to regions of a lower configurational entropy confirming the relevance of this notion for adsorption [64]. Figs. 16 show the adsorbed conformation from the top and two side-view panels. It is seen that binding takes place through 1 ASN and six hydrophobic AAs. Most of them, but ASN and TRP, adopt conformations that are similar to the optimal ones obtained in the single-AA case. With the exception of 18 PRO, the binding AAs belong to the helical part of the protein.
The statistics of the binding events for the three force fields are shown in Fig. 17. The heights of the columns indicate the percentage, , of the total adsorption time of the protein during which the ’th AA is either in layer I (darker shade) or below the upper boundary of layer II (lighter shade). There are two kinds of columns for each AA: on the left the location of an AA is defined through its lowest atom and on the right – through its CM. The adsorption starts to count when the lowest atom or the CM of the lowest AA crosses the upper boundary of layer II.
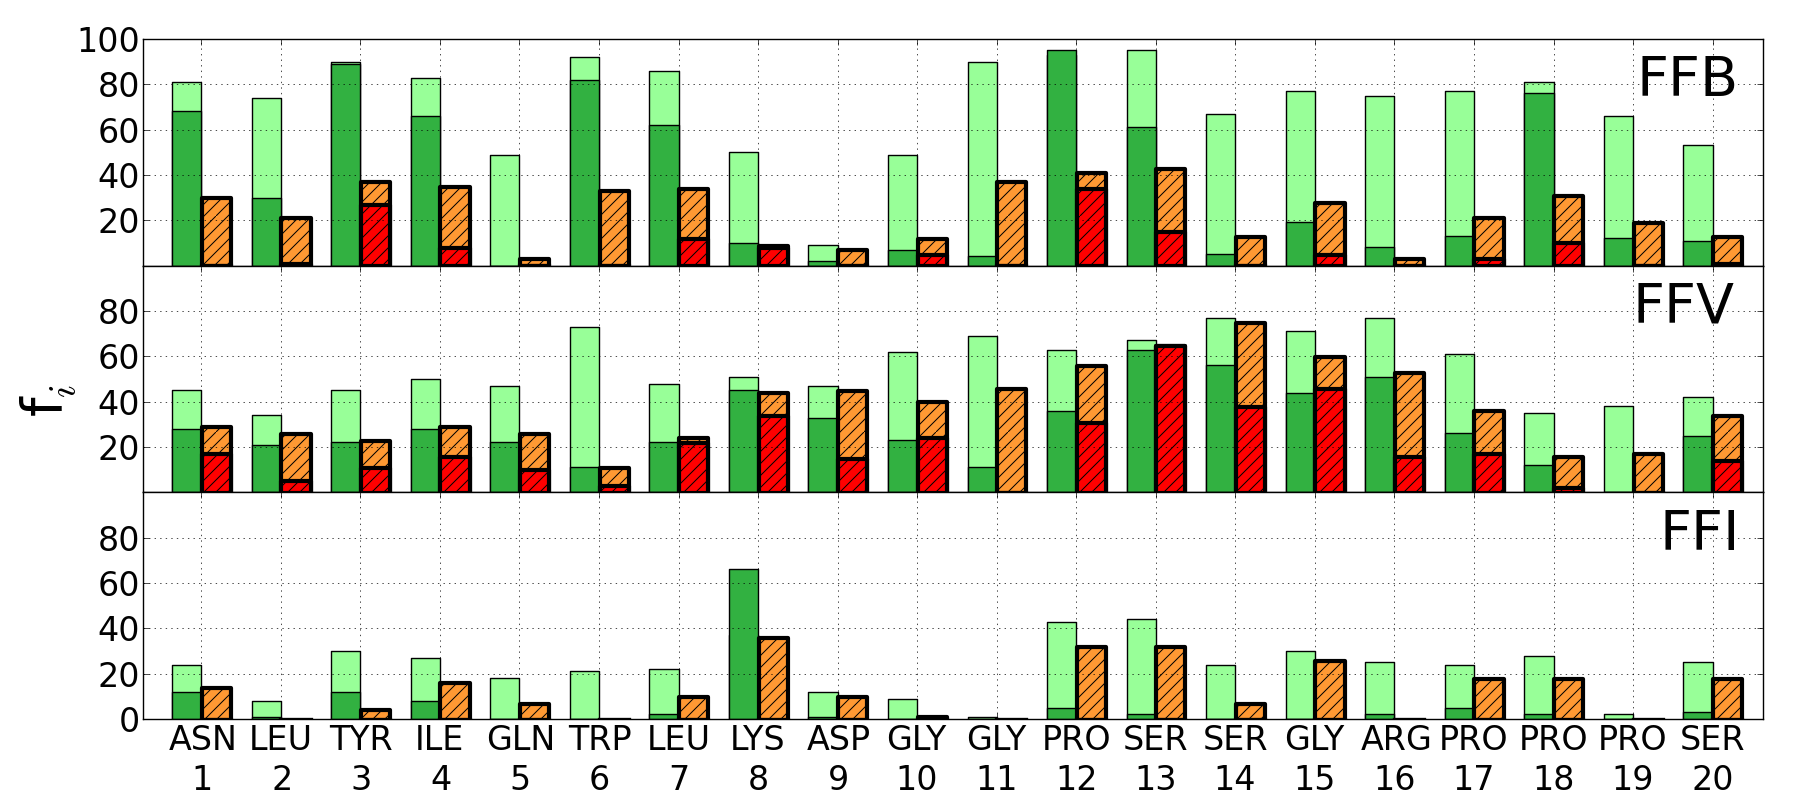
In the case of FFB, there are eight AAs which stay adsorbed for about 80% of the whole adsorption event (when using the description based on the location of the lowest atom). These are the seven identified in Fig. 16 and 13 SER which gets adsorbed in other trajectories. Except for 1 ASN, these AAs have the largest (available) values of in Table 1. Note that the parameters in the table refer to the CM of the AAs and not to the lowest atoms, but the fractions defined in terms of the CMs lead to similar conclusions. The low value of for 9 ASP is consistent with the low for ASP and, especially, the large . ASN has that is comparable to that of ASP and a small would be expected to be found. However, the enhanced value of is due to structural reasons: 1 ASN belongs to the helix and five AAs of the helix bind to the surface strongly and force 1 ASN to follow suit.
The set of the well adsorbing AAs in the case of FFV is quite distinct from that of FFB and the are generally smaller despite the generally stronger PMF-derived couplings. The adsorption is mostly due to the two serins (13 and 14) then 15 GLY, 16 ARG, 8 LYS and 6 TRP. We observe no obvious correlations with the ranking of of Table 1
For FFI, the fractions become still smaller. Only 8 LYS gets exceeding 60%. Most of the other AAs have of 20% or less. This behavior appears to reflect the low level of specificity within FFI and thus an effective interchangeability – from a trajectory to a trajectory – of the binding AAs. There are no correlations with the ’s in the table. For instance, TYR and TRP should bind the best but they do not. Furthermore, 17 PRO has comparable to 18 PRO, but 19 PRO does not bind. Similarly, for 15 GLY is about three times as big as for 10 GLY with for 11 GLY being negligible. This may reflect an insufficient statistics to some extent, but is more likely due to the role of the whole structure in determining which segments bind and which do not. With high specificity, like in FFB, the role of the structure gets diminished.
Simulations by Hoefling et al. [15] for single capped AAs described within FFI, indicate that the AAs can come quite close to the surface during a free evolution. We have confirmed this finding for ASP, MET, PHE, and TYR (for which the PMFs in ref. [15] have been shown explicitely). However, when these AAs are parts of the protein then they do not penetrate the first water layer at all, as illustrated in the bottom panel of Fig. 14. It is statistically improbable for several connected AAs to go through layer I which can also be stated as an existence of correlations between the AAs. The contributing circumstances are that conformations of AAs in the protein are not the same as when in isolation and that the calculations of the PMFs involve making averages over the lateral positions and thus do not refer to a particular coordinates.
4 Conclusions
Generally, it is not surprising that results of molecular dynamics simulations depend on the details of the force field. Such dependence has been documented for proteins even without any interactions with solids [71, 72, 73]. However, in the case of aqueous biomolecules interacting with gold the differences between the three force fields considered are profound and qualitative in nature. The differences are related to the behavior of the molecules of water just near the surface that show in the density profiles and orientation of the molecules. In terms of the average coupling strengths, the hydrophobic FFB is the weakest and the non-polarizable hydrophilic FFV is the strongest. We have checked that the ranking of the FFV-based couplings mostly agrees with that obtained for the analogues of the side chains (or their fragments). The FFB couplings, with the exception of the covalently binding CYS, are, on average, an order stronger than those obtained for the semiconducting ZnO. However, the strongest couplings are larger only by a factor between 1.84 and 4.78, depending on the choice of the exposed surface of ZnO.
In terms of the specificities, FFB leads to the largest sensitivity (49%) to the identity of amino acids and the polarizable FFI to the smallest (25%). On the other hand, specificities for ZnO are much larger – they range between 68% and 154%, depending on the surface. Despite the weaker FFB-based AA-Au couplings than for the hydrophilic force fields, the hydrophobic surface actually binds proteins better statistically (if no CYS is involved) because of the stronger specificity and a possibility of a closer approach to the surface through water. At the same time, the levels of distortion of the protein are similar for the three force fields.
If one asks whether one can predict which protein or peptide may bind to gold based on the single AA binding strengths, then the answer is that this may work fairly well in the hydrophobic case even though our results for the dipeptides do not support a simple additivity of the single-AA contributions. In the hydrophilic cases, it seems better to gather statistics of the frequency with which, say, the lowest atoms come to the first two layers of water and derive effective couplings via the Boltzmann factors. An alternative is to use the PMF-based single AA-potentials but with an extra softly repulsive potential that prevents a too close approach to the surface. The couplings determined in this paper can be employed in coarse simulations, for instance of the kind proposed in refs. [69, 70].
Acknowledgement
Discussions with D. Elbaum, J. Grzyb and B. Różycki are warmly appreciated. This work has been supported by the Polish National Science Centre Grants No. 2011/01/B/ST3/02190 as well as by the European Union within European Regional Development Fund, through Innovative Economy grant (POIG.01.01.02-00-008/08). The local computer resources were financed by the European Regional Development Fund under the Operational Programme Innovative Economy NanoFun POIG.02.02.00-00-025/09. We appreciate help of A. Koliński and A. Liwo in providing additional computer resources such as at the Academic Computer Center in Gdańsk.
References
- [1] Hlady, V.; Buijs, J. Protein Adsorption on Solid Surfaces. Curr. Opin. Biotechnol. 1994, 7, 72–77.
- [2] Gray, J. J. The Interaction of Proteins with Solid Surfaces. Curr. Opin. Struc. Biol. 2004, 14, 110–115.
- [3] Ballou, B.; Lagerholm, B. C.; Ernst, L. A.; Bruchez, M. P.; Waggoner, A. S. Noninvasive Imaging of Quantum Dots in Mice. Bioconjugate Chem. 2004, 15, 79–86
- [4] Rabias, I.; Tsitrouli, D.; Karakosta, E.; Kehagias, T.; Diamantopoulos, G.; Fardis, M.; Stamopoulos, D.; Maris, T. G.; Falaras, P.; Zouridakis, N. Rapid Magnetic Heating Treatment by Highly Charged Maghemite Nanoparticles on Wistar Rats Exocranial Glioma Tumors at Microliter Volume. Biomicrofluidics, 2010, 4, 024111–024119.
- [5] Cohavi, O.; Corni, S.; De Rienzo, F.; Di Felice, R.; Gottschalk, K. E.; Hoefling, M.; Kokh, D.; Molinari, E.; Schreiber, G.; Vaskevich, A. ; Wade, R. C. Protein-Surface Interactions: Challenging Experiments and Computations. J Mol Recognit. 2010, 23, 259–262.
- [6] Lynch, I., Dawson, K. A. Protein-Nanoparticle Interactions. Nanotoday 2008, 3, 40–47.
- [7] Faraday, M. Experimental Relations of Gold (and Other Metals) to Light. Philos. Trans. 1857, 147, 145–181.
- [8] Brown, S. Metal-Recognition by Repeating Polypeptides. Nature Biotechnology 1997, 15, 269–272.
- [9] Daniel, M. C.; Astruc, D. Gold Nanoparticles: Assembly, Supramolecular Chemistry, Quantum-Size-Related Properties, and Applications Toward Biology, Catalysis, and Nanotechnology. Chem. Rev. 2004, 104, 293–346.
- [10] Boisselier, E.; Astruc D. Gold Nanoparticles in Nanomedicine: Preparations, Imaging, Diagnostics, Therapies and Toxicity. Chem. Soc. Rev. 2009, 38, 1759–1782.
- [11] Moy, V.; FLorin, E.; Gaub, H. Intermolecular Forces and Energies Between Ligands and Receptors. Science 1994, 266, 257–259.
- [12] Naumn, K. C.; Nagy, A. Single-Molecule Force Spectroscopy: Optical Tweezers, Magnetic Tweezers and Atomic Force Microscopy. Nat. Meth. 2008, 5, 491–505.
- [13] Carrion-Vazquez, M.; Oberhauser, A. F.; Fisher, T. E.; Marszalek, P. E., Li, H.; Fernandez, J. M. Mechanical Design of Proteins Studied by Single-Molecule Force Spectroscopy and Protein Engineering. Prog. Biophys. Mol. Biol. 2000, 74, 63–91.
- [14] Heinz, H.; Vaia, R. A.; Farmer, B. L.; Naik, R. R. Accurate Simulation of Surfaces and Interfaces of Face-Centered Cubic Metals Using 12-6 and 9-6 Lennard-Jones Potentials. J. Phys. Chem. C 2008, 112, 17281–17290.
- [15] Hoefling, M.; Iori, F.; Corni S.; Gottschalk, K. E. Interaction of Amino Acids with the Au(111) Surface: Adsorption Free Energies from Molecular Dynamics Simulations. Langmuir 2010, 26, 8347–8351.
- [16] Hoefling, M.; Iori, F.; Corni S.; Gottschalk, K. E. The Conformations of Amino Acids on a Gold(111) Surface. ChemPhysChem 2010, 11, 1763–1767.
- [17] Hoefling, M.; Monti, S.; Corni, S.; Gottschalk, K. E. Interaction of -Sheet Folds with a Gold Surface. PLoS ONE 2011, 6, 20925–20938.
- [18] Verde, A. V.; Acres, J. M.; Maranas, J. K. Investigating the Specificity of Peptide Adsorption on Gold Using Molecular Dynamics Simulations. Biomacromolecules 2009, 10, 2118–2128.
- [19] Verde, A. V.; Beltramo, P. J.; Maranas, J. K. Adsorption of Homopolypeptides on Gold Investigated Using Atomistic Molecular Dynamics. Langmuir 2011, 27, 5918–5926.
- [20] Bizzarri, A. R.; Costantini G.; Cannistraro S. MD Simulation of a Plastocyanin Mutant Adsorbed onto a Gold Surface. Biophys Chem. 2003, 106, 111–123.
- [21] Bizzarri, A. R.; Bonanni, B.; Costantini, G.; Cannistraro, S. A Combined Atomic Force Microscopy and Molecular Dynamics Simulation Study on a Plastocyanin Mutant Chemisorbed on a Gold Surface. Chemphyschem. 2003, 4, 1189–1195.
- [22] Iori, F.; Di Felice, R.; Molinari, E.; Corni, S. GolP: An Atomistic Force-Field to Describe the Interaction of Proteins with Au(111) Surfaces in Water. J Comput Chem. 2009, 30, 1465–1476.
- [23] Calzolari, A.; Cicero, G.; Cavazzoni, C.; Di Felice, R.; Catellani, A.; Corni, S. Hydroxyl-Rich -Sheet Adhesion to the Gold Surface in Water by First-Principle Simulations. J. Am. Chem. Soc. 2010, 132, 4790–4795.
- [24] Iori, F.; Corni, S. Including Image Charge Effects in the Molecular Dynamics Simulations of Molecules on Metal Surfaces. J. Comp. Chem. 2008, 29, 1656–1666.
- [25] Di Felice, R.; Selloni, R. Adsorption Modes of Cysteine on Au(111): Thiolate, Amino-Thiolate, Disulfide. J. Chem. Phys. 2004, 120, 4906–4914.
- [26] Nazmutdinov, R. R.; Zhang, J.; Zinkicheva, T. T.; Manyurov, I. R.; Ulstrup, J. Adsorption and In Situ Scanning Tunneling Microscopy of Cysteine on Au(111): Structure, Energy, and Tunneling Contrasts. Langmuir 2006, 22, 7556–7567.
- [27] Nawrocki, G.; Cieplak, M. Amino Acids and Proteins at ZnO–Water Interfaces in Molecular Dynamics Simulations. Phys. Chem. Chem. Phys. 2013, 15, 13628–13636.
- [28] Nawrocki, G.; Cieplak, M. Interactions of Aqueous Amino Acids and Proteins with the (110) Surface of ZnS in Molecular Dynamics Simulations. J. Chem. Phys. 2013, 140, 095101–095111
- [29] MacKerell, Jr., A. D.; Bashford, D.; Bellott, M.; Dunbrack, Jr., R. L.; Evanseck, J. D.; Field, M. J.; Fischer, S.; Gao, J.; Guo, H.; Ha, S. All-Atom Empirical Potential for Molecular Modeling and Dynamics Studies of Proteins. J. Phys. Chem. B 1998, 102, 3586–3616.
- [30] Van der Spoel, D.; Lindahl, E.; Hess, B.; Groenhof, G.; Mark, A. E.; Berendsen, H. J. C. GROMACS: Fast, Flexible, and Free. J. Comp. Chem. 2005, 26, 1701–1718.
- [31] Margueritat, J.; Bouhelier, A.; Markey, L.; des Francs, G. C.; Dereux, A.; Lau-Truong, S.; Grand, J.; Levi, G.; Felidj, N.; Aubard, J. Discerning the Origins of the Amplitude Fluctuations in Dynamic Raman Nanospectroscopy, J. Phys. Chem. C 2012, 116, 26919–26923.
- [32] Finot, E. private communication.
- [33] Apicella, A.; Soncini, M.; Deriu, M. A.; Natallelo, A.; Bonanomi, M.; Dellasega, D.; Tortora, P.; Regonesi, M. E.; Casari, C. S. A Hydrophobic Gold Surface Triggers Misfolding and Aggregation of the Amyloidogenic Josephin Domain in Monomeric Form, While Leaving Oligomers Unaffected. PLOS ONE 2013, 8, 58794–58802.
- [34] Bewig, K. W.; Zisman, W. A. The Wetting of Gold and Platinum by Water. J. Phys. Chem., 1965, 69, 4238–4242.
- [35] Abdelsalam, M. E.; Bertlett, P. N.; Kelf, T.; Baumberg, J. Wetting of Regularly Structured Gold Surfaces. Langmuir textbf2005, 21, 1753–1757.
- [36] Smith, T. The Hydrophilic Nature of a Clean Gold Surface. J. Colloid. Interf. Sci. 1980, 75, 51–55.
- [37] M. E. Schrader, Wettability of Clean Metal Surfaces. J Colloid Interface Sci. 1984, 100, 372–380.
- [38] Cieplak, M.; Smith, E. D.; Robbins, M. O. Molecular Origins of Friction: The Force on Adsorbed Layers. Science 1994, 265, 1209–1212.
- [39] Bruch, L. W.; Phillips, J. M. Xe Monolayer Adsorption on Ag(111) – Statistical Mechanics. Surf. Sci. 1980, 91, 1-23
- [40] J. Krim, D. H. Solina, and R. Chiarello Nanotribology of a Kr Monolayer: A Quartz-Crystal Microbalance Study of Atomic-Scale Friction. Phys. Rev. Lett. 1991, 66, 181–185.
- [41] Braun, R.; Sarikaya, M.; Schulten, K. Genetically Engineered Gold-Binding Polypeptides: Structure Prediction and Molecular Dynamics. J. Biomaterials Science-Polymer Edition 2002, 13, 747-757.
- [42] Heinz, H.; Farmer, B. L.; Pandey, R. B.; Slocik, J. M.; Patnaik, S. S.; Pachter, R.; Naik, R. R. Nature of Molecular Interactions of Peptides with Gold, Palladium, and Pd−Au Bimetal Surfaces in Aqueous Solution. J. Am. Chem. Soc. 2009, 131, 9704–9714.
- [43] Humphry, W.; Dalke, A.; Schulten, K. VMD: Visual Molecular Dynamics. J. Mol. Graph. 1996, 14, 33–38.
- [44] Qian, J.; Hentschke, R.; Knoll, W. Superstructures of Cyclodextrin Derivatives on Au(111): A Combined Random Planting - Molecular Dynamics Approach. Langmuir 1997, 13, 7092–7098.
- [45] Rappe, A. K.; Casewit, C. J.; Colwell, K. S.; Goddard III, W. A.; Skiff, W. M. UFF, a Full Periodic Table Force Field for Molecular Mechanics and Molecular Dynamics Simulations. J. Am. Chem. Soc. 1992, 114, 10024–10035.
- [46] Jorgensen, W. L.; Chandrasekhar, J.; Madura, J. D.; Impey, R. W.; Klein, M. L. Comparison of Simple Potential Functions for Simulating Liquid Water. J. Chem. Phys. 1983, 79, 926–935.
- [47] Jorgensen, W. L.; Maxwell, D. S.; Tirado-Rives, J. Development and Testing of the OPLS All-Atom Force Field on Conformational Energetics and Properties of Organic Liquids. J. Am. Chem. Soc. 1996, 118, 11225–11236.
- [48] Berendsen, H. J. C.; Postma, J. P. M.; van Gunsteren, W. F.; Hermans, J. Interaction Models for Water in Relation to Protein Hydration. Intermolecular Forces, edited by B. Pullman, D. Reidel Publishing Company, Dordrecht 1981, 331-342.
- [49] Mahaffy, R.; Bhatia, R.; Garrison, B. J. Diffusion of a Butanethiolate Molecule on a Au{111} Surface. J. Phys. Chem. B 1997, 101, 771–773.
- [50] Jung, H. H.; Won, Y. D.; Shin, S.; Kim, K. Molecular Dynamics Simulation of Benzenethiolate and Benzyl Mercaptide on Au(111). Langmuir 1999, 15, 1147–1154.
- [51] Luo, Y.R. Comprehensive Handbook of Chemical Bond Energies, CRC Press, Boca Raton, FL 2007, 9, 66.
- [52] Bruce, R. W. CRC Handbook of Lubrication: Theory and Practice of Tribology 1988, 2, 18-20.
- [53] Essmann, U.; Perera, L.; Berkowitz, M. L.; Darden, T.; Lee, H.; Pedersen, L. G. A Smooth Particle Mesh Ewald Potential. J. Chem. Phys. 1995, 103, 8577–8593.
- [54] Dragneva, N.; Floriano, W. B.; Stauffer, D.; Mawhinney, R. C.; Fanchini, G.; Rubel, O. Favorable Adsorption of Capped Amino Acids on Graphene Substrate Driven by Desolvation Effect. J. Chem. Phys. 2013, 139, 174711–174717.
- [55] Kirkwood, J. G. Statistical Mechanics of Fluid Mixtures. J. Chem. Phys. 1935, 3, 300–313.
- [56] Kumar, S.; Bouzida, D.; Swendsen, R. H.; Kollman, P. A., Rosenberg, J. M. The Weighted Histogram Analysis Method for Free-Energy Calculations of Biomolecules. I. The method. J. Comp. Chem. 1992, 13, 1011–1021.
- [57] Lemkul, J. A.; Bevan, D. R. Assessing the Stability of Alzheimer’s Amyloid Protofibrils Using Molecular Dynamics. J. Phys. Chem. B 2010, 114, 1652–1660.
- [58] Hess, B. J. Determining the Shear Viscosity of Model Liquids from Molecular Dynamics Simulations. J. Chem. Phys. 2002, 116, 209–217.
- [59] de Ruijter, M. J.; Blake, T. D.; De Coninck, J. Dynamic Wetting Studied by Molecular Modeling Simulations of Droplet Spreading. Langmuir 1999, 15, 7836–7847.
- [60] Werder, T.; Walther, J. H.; Jaffe, R. L.; Halicioglu, T.; Koumoutsakos, P. On the Water−Carbon Interaction for Use in Molecular Dynamics Simulations of Graphite and Carbon Nanotubes. J. Phys. Chem. B 2003, 107, 1345–1352.
- [61] Chang, C. I; Lee, W. J.; Young, T. F.; Ju, S. P.; Chang, C. W.; Chen, H. L.; Chang, J. G. Adsorption Mechanism of Water Molecules Surrounding Au Nanoparticles of Different Sizes. J. Chem. Phys. 2008, 128, 154703–154712.
- [62] Cieplak, M.; Koplik, J.; Banavar, J. R. Applications of Statistical Mechanics in Subcontinuum Fluid Dynamics. Physica A 1999, 274, 281–293.
- [63] Cieplak, M.; Koplik, J.; Banavar, J. R. Boundary Conditions at a Fluid - Solid Interface, Phys. Rev. Lett. 2001, 86, 803-806.
- [64] Corni, S.; Hnilova, M.; Tamerler, C.; Sarikaya, M. Conformational Behavior of Genetically-Engineered Dodecapeptides as a Determinant of Binding Affinity for Gold. J. Phys. Chem. C 2013, 117, 16990–17003.
- [65] Willett, R. L.; Baldwin, K. W.; West, K. W.; Pfeiffer, L. N. Differential Adhesion of Amino Acids to Inorganic Surfaces. Proc Natl Acad Sci U S A. 2005, 102, 7817–7822.
- [66] Monti, S.; Walsh, T. R. Free Energy Calculations of the Adsorption of Amino-Acid Analogues at the Aqueous Titania Interface. J. Phys. Chem. C 2010, 114, 22197–22206.
- [67] Wright, L. B.; Walsh, T. R. Facet Selectivity of Binding on Quartz Surfaces: Free Energy Calculations of Amino-Acid Analogue Adsorption. J. Phys. Chem. C 2012, 116, 2933–2945.
- [68] Kyte, J.; Doolittle, R. F. A Simple Method for Displaying the Hydroptahic Character of a Protein. J. Mol. Biol. 1982, 157, 105–132.
- [69] Pandey, R. B.; Heinz, H.; Feng, J.; Farmer, B. L.; Slocik, J. M.; Drummyc, L. F.; Naikc, R. R. Adsorption of Peptides (A3, Flg, Pd2, Pd4) on Gold and Palladium Surfaces by a Coarse-Grained Monte Carlo Simulation. Phys. Chem. Chem. Phys. 2009, 11, 1989–2001.
- [70] Feng, J.; Pandey, R. B.; Berry, R. J.; Farmer, B. L.; Naikc, R. R.; Heinz, H. Adsorption Mechanism of Single Amino Acid and Surfactant Molecules to Au 111 Surfaces in Aqueous Solution: Design Rules for Metal-Binding Molecules. Soft Matter 2011, 7, 2113–2120.
- [71] Matthes, D.; de Groot, B. L. Secondary Structure Propensities in Peptide Folding Simulations: A Systematic Comparison of Molecular Mechanics Interaction Schemes. Biophys. J. 2009, 97, 599608.
- [72] Piana, S.; Lindorff-Larsen, K.; Shaw, D. E. How Robust are Protein Folding Simulations with Respect to Force Field Parametrization? Biophys. J. 2011, 100, L47-L49.
- [73] Cino, E. A.; Choy, W.-Y.; Karttunen, M. Comparison of Secondary Structure Formation Using 10 Different Force Fields in Microsecond Molecular Dynamics Simulations. JCTC, 2012, 2725-2740.
Supplementary Information
Aqueous Amino Acids and Proteins Near the Surface of Gold
in Hydrophilic and Hydrophobic Force Fields
Grzegorz Nawrocki and Marek Cieplak
Institute of Physics, Polish Academy of Sciences, Al. Lotników 32/46, 02-668 Warsaw, Poland
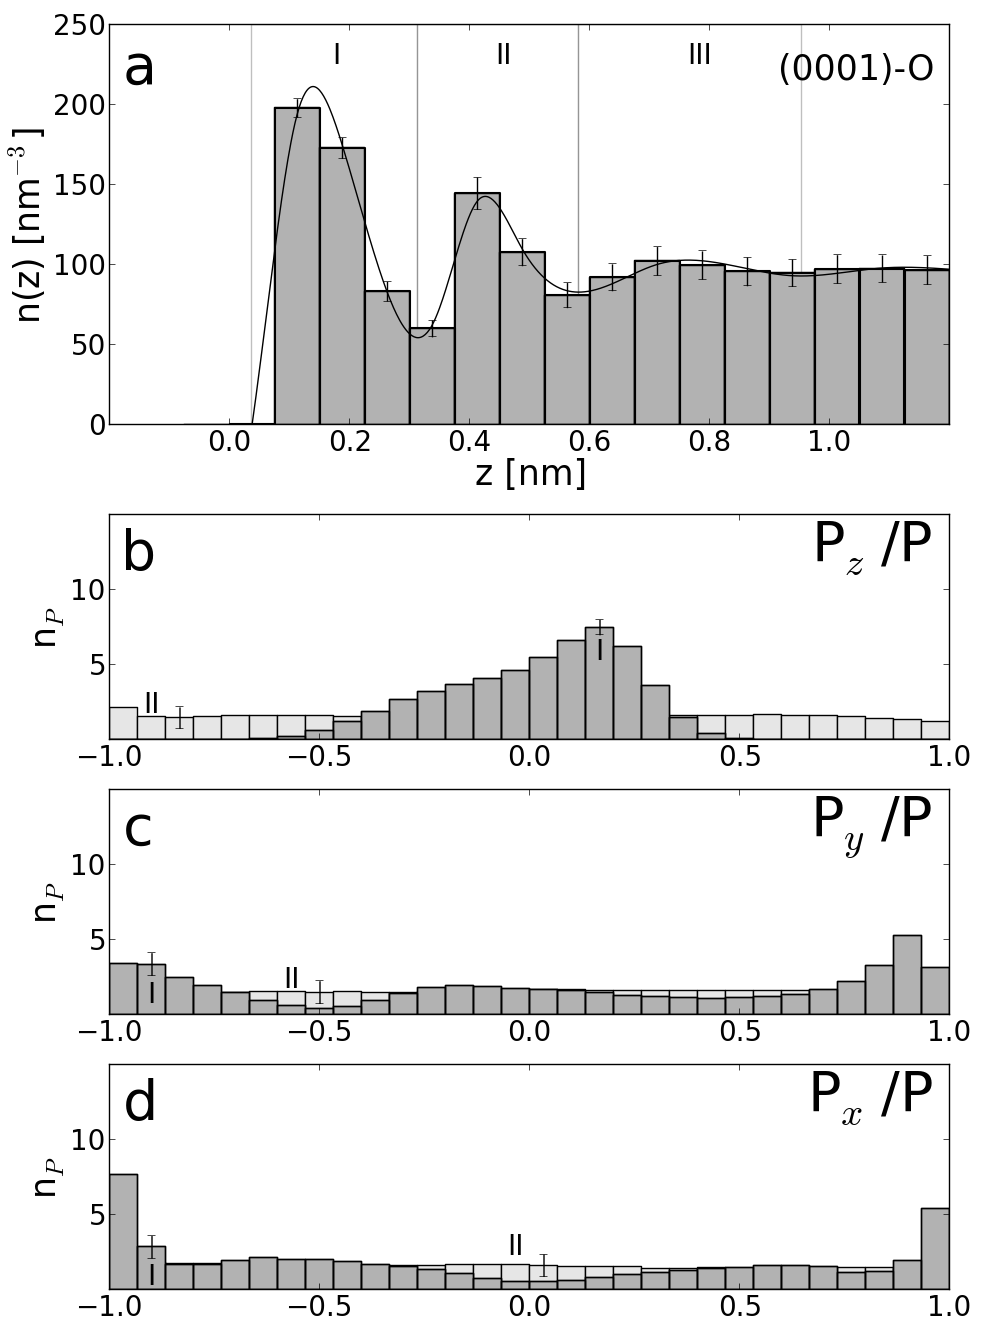
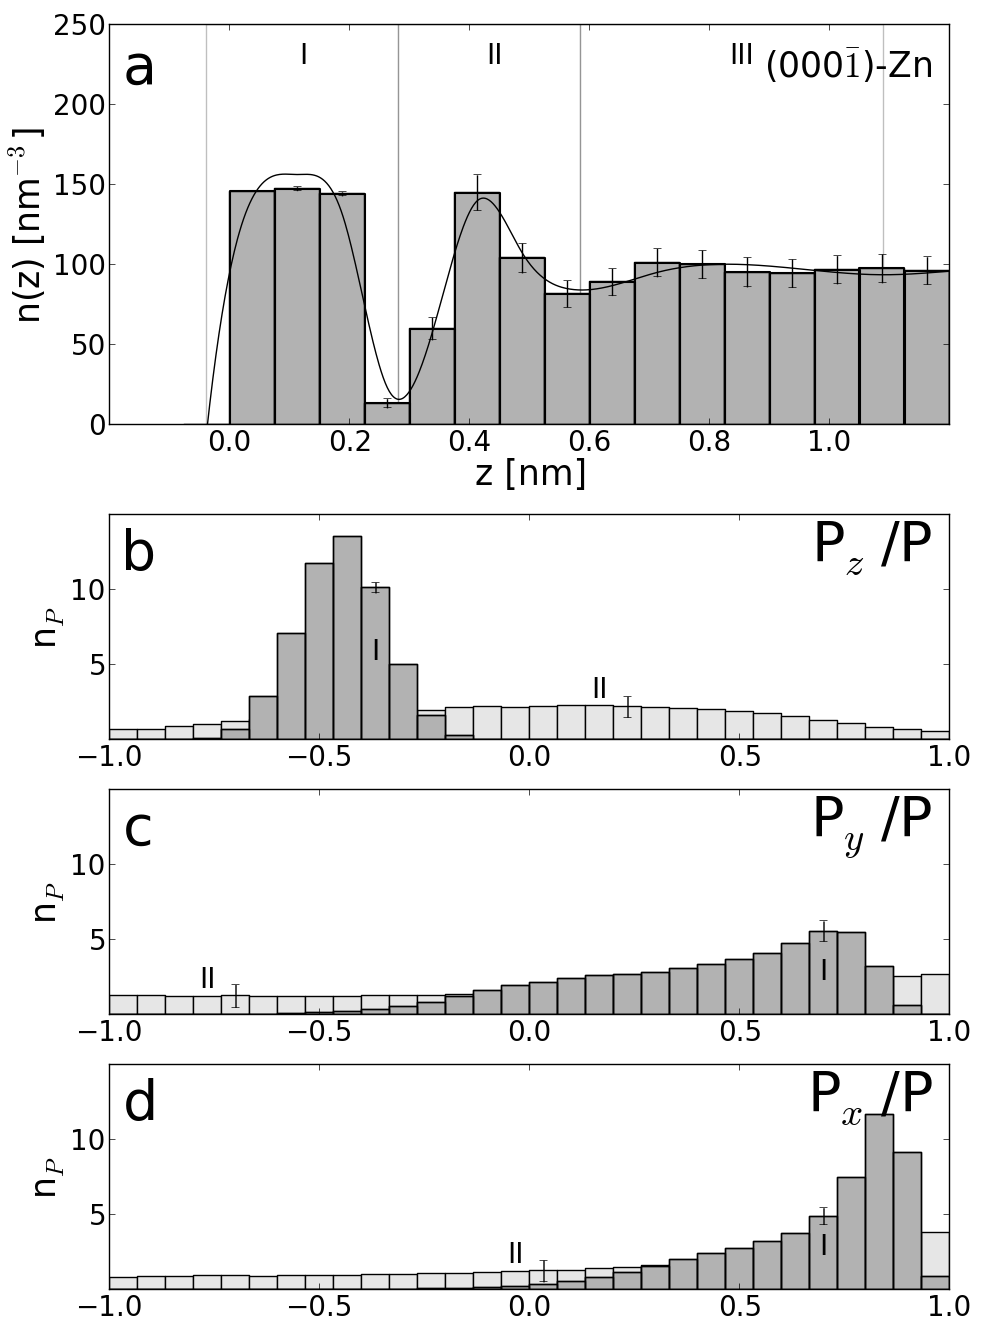
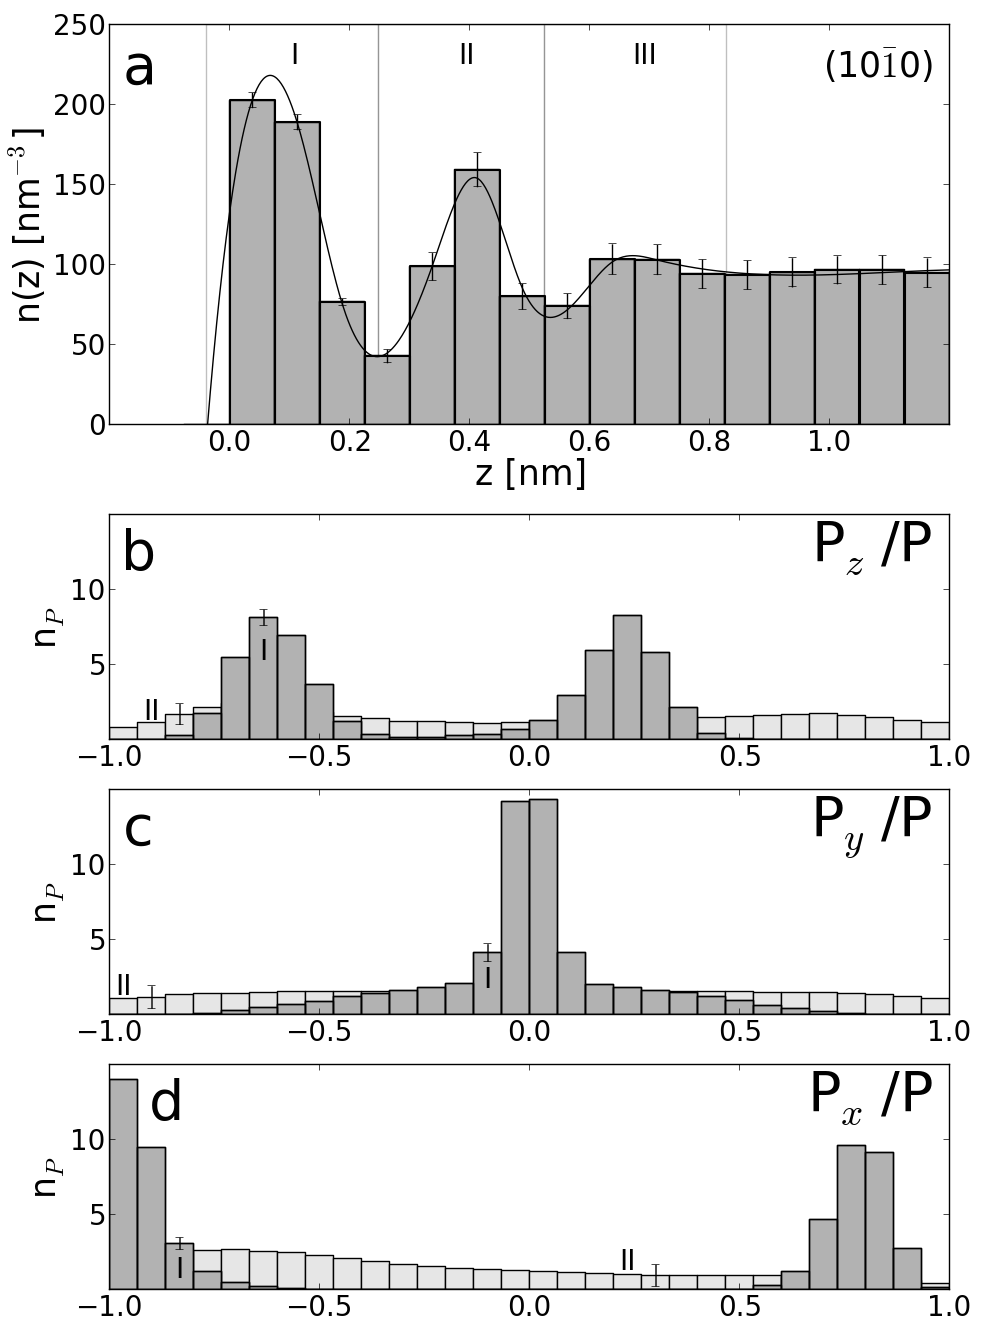
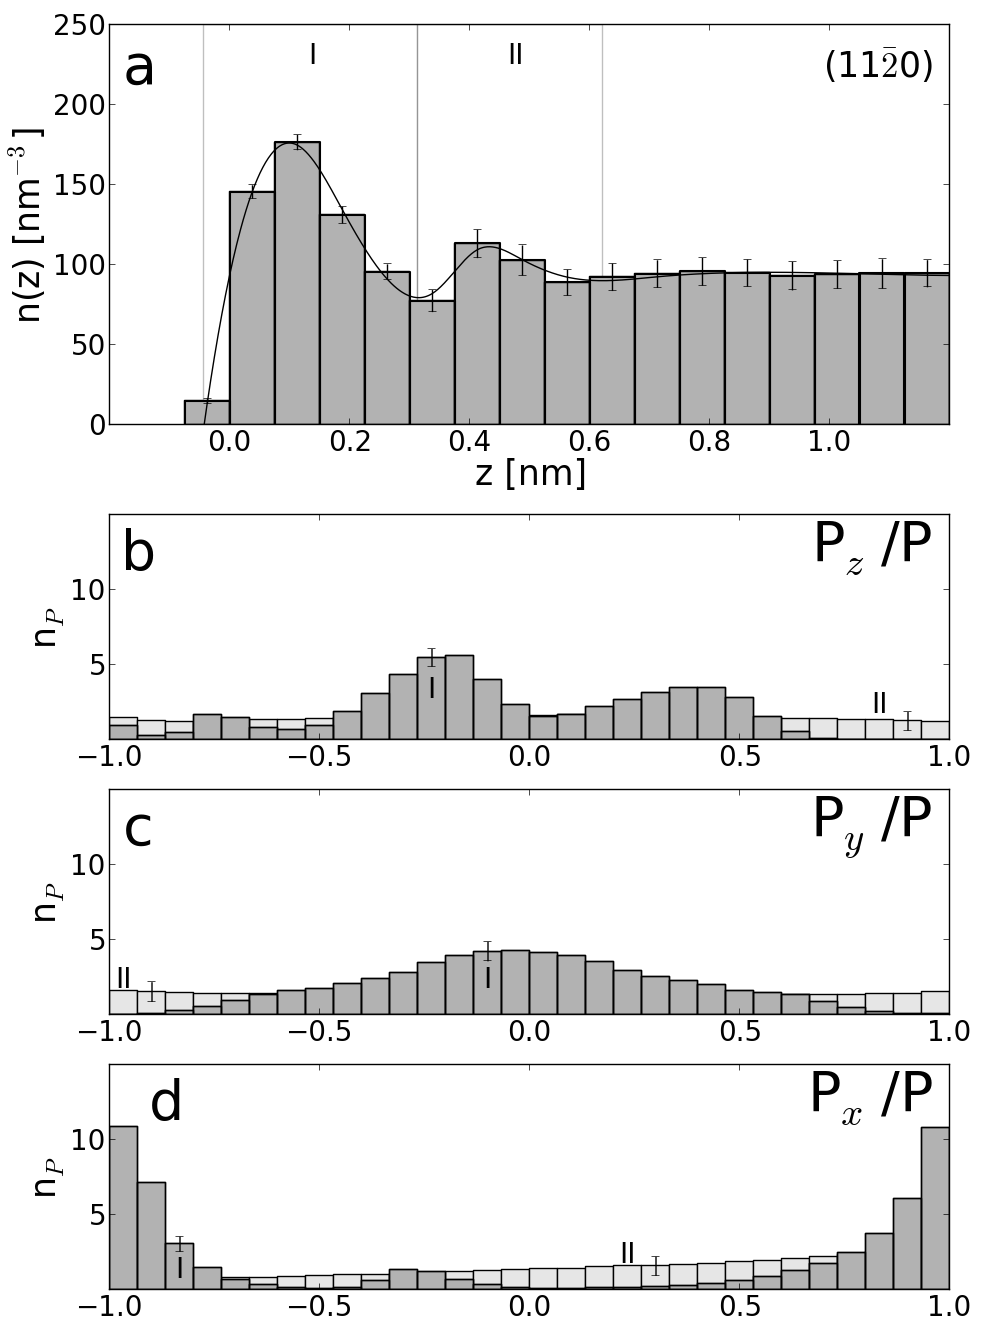
In order to discuss the properties of water near gold, it is useful to provide a background of other possible behaviors, such as near ZnO. This system has been studied in ref. [1] but the distributions of the polarization vector have not been shown there. We have considered four cuts of the bulk crystal, two polar ((0001)-O, (000)-Zn) and two nonpolar ((100), (110). The corresponding density and polarization profiles are shown in Figs. 18, 19, 20, and 21 respectively.
Fig. 22 illustrates the umbrella sampling method. It shows the distributions of the numbers of conformations at various sampling locations for PHE considered within the FFB approach.
Figs. 23 and 24 show the PMFs for the twenty amino acids as determined within the FFV and FFB force fields respectively.
Fig. 25 shows the PMF for the analogues of the AAs side chains discussed in the main text and for the hydrophilic FFV model.
References
- [1] Nawrocki, G.; Cieplak, M. Amino acids and proteins at ZnO–water interfaces in molecular dynamics simulations. Phys. Chem. Chem. Phys. 2013, 15, 13628–13636.