Amino Acids and Proteins at ZnO-water Interfaces in Molecular Dynamics Simulations
Grzegorz Nawrocki and Marek Cieplak
Institute of Physics, Polish Academy of Sciences,
Al. Lotników 32/46, 02-668 Warsaw, Poland.
E-mail: mc@ifpan.edu.pl
We determine potentials of the mean force for interactions of amino acids with four common surfaces of ZnO in aqueous solutions. The method involves all-atom molecular dynamics simulations combined with the umbrella sampling technique. The profiled nature of the density of water with the strongly adsorbed first layer affects the approach of an amino acids to the surface and generates either repulsion or weak binding. The largest binding energy is found for tyrosine interacting with the surface for which the Zn ions are at the top. It is equal to 7 kJ mol-1 which is comparable to that of the hydrogen bonds in a protein. This makes the adsorption of amino acids to ZnO surface to be much weaker than to the well studies surface of gold. In vacuum, binding energies are more that 40 times stronger (for one of the surfaces). The precise manner in which water molecules interact with a given surface influences the binding energies in a way that depends on the surface. Among the four considered surfaces the one with Zn at the top is recognized as binding almost all amino acids with the average binding energy of 2.60 kJ mol-1. Another (O at the top) is non-binding for most amino acids. For binding situations the average energy is 0.66 kJ mol-1. The remaining two surfaces bind nearly as many amino acids as they do not and the average binding energies are 1.46 and 1.22 kJ mol-1. For all of the surfaces the binding energies vary between amino acids significantly: the dispersion in the range of 68 - 154% of the mean. A small protein is shown to adsorb to ZnO only intermittently and with only a small deformation. Various adsorption events lead to different patterns in mobilities of amino acids within the protein.
1 Introduction
Understanding the nature of protein adsorption on solid surfaces is a fundamental problem in biophysics 1, 2, 3, 4 which has important implications in biological materials and engineering. They relate to many applications that include biosensing 5, biomaterials 1, drug delivery 6 and industrial chemistry 7. Some of these applications rely on recognition of the surfaces by specific proteins or peptides. It is thus important to investigate the role of the sequential makeup in binding to the surface.
Elucidation of interactions of a protein with a surface should start at the single amino acid (AA) level. Examples of questions that need to be answered are: what is the characteristic energy of interactions, what is the level of specificity in the binding affinities, and what are the effects of the surrounding water molecules. There are experimental studies of GaAs, InP, and Si suggesting that one should be able to design sequences of high binding specificity 8, 9 to these surfaces.
In particular, liquid chromatography studies of adsorption of AAs to silicon 10 suggest that the AA-averaged lowering of the free energy due to adsorption is 1.151.05 kJ mol-1 (it varies between -0.40 and 3.64 kJ mol-1). The ratio of the dispersion to the mean value can be taken as a measure of specificity – for silicon it is 91%. For gold, on the other hand, the calculated 3 binding energies vary between 17.5 and 44.2 kJ mol-1 with the mean of 30.17.5 kJ mol-1 which corresponds to the 25% specificity.
Here, we consider the case of ZnO – it is a well studied semiconductor 12 with potential applications in biosensing 13, 14. ZnO-based quantum dots can act as inorganic fluorescent probes 15, 16, 17, though problems with biocompatibility, toxicity, sufficient brightness of fluorescence, and water-solubility 18 remain to be worked out. For instance the issue of a relatively easy solubility can be dealt with either by coating the dots or by envisioning single-use devices for detection of, say, enzymatic reactions in blood. Another application involves self-assembly of biomaterials with peptide-linked ZnO nanoparticles 19, 20.
We consider the case of four surface cuts of ZnO immersed in water. We find that AAs split into binding and not-binding in a way that depends on the surface cut. If they can adsorb, the corresponding binding energy, , reach up to 7 kJ mol-1 which corresponds to 562 K and there is a considerable specificity. The highest of these energies are then comparable to the strength of the hydrogen bonds in proteins. Variations among AAs for a given surface are found to exceed even 150%. The specificity in the absence of water is only of order 19%, but the is much stronger – of order 147 kJ mol-1.
Our results are obtained through numerical modeling. When choosing a modeling scheme one may take a solid-state perspective which suggests using the quantum molecular dynamics (MD) method, as in the studies of alanine near ZnO 21 or various amino acids (AAs) near gold 22. However, this approach is restrictive about the time scales and the size of the system, making it hard to include water molecules and conformational changes of even small biomolecules. Here, we adopt the approach of the protein science and use the established all-atom classical MD protocols. This approach has been taken recently in studies of interaction energies and conformational changes of proteins anchored to the polar mica surface 23, 24. The usage of the classical MD in systems involving ZnO seems justified since the solid is not metallic and the electron delocalization effects are weak.
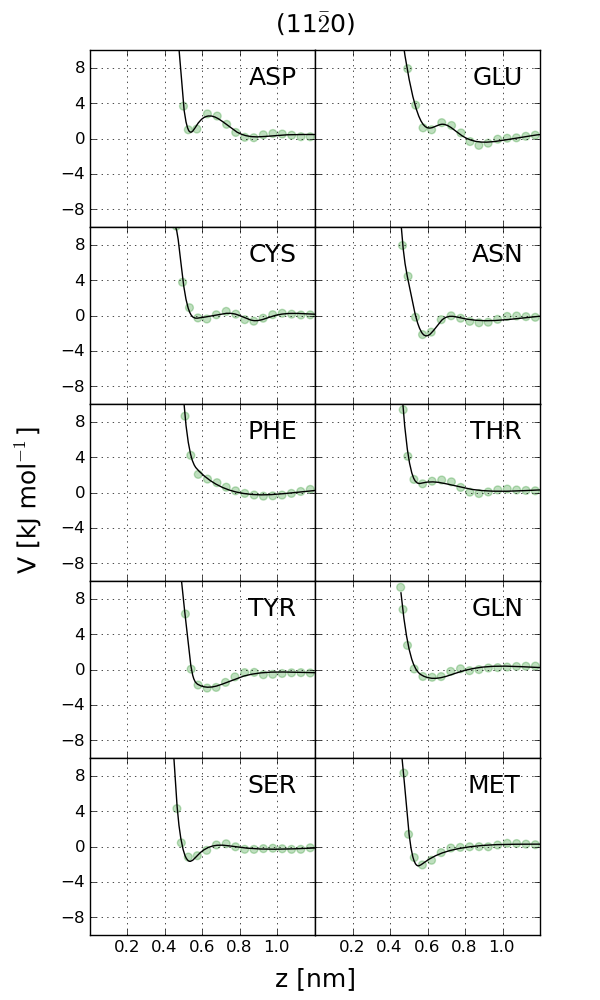
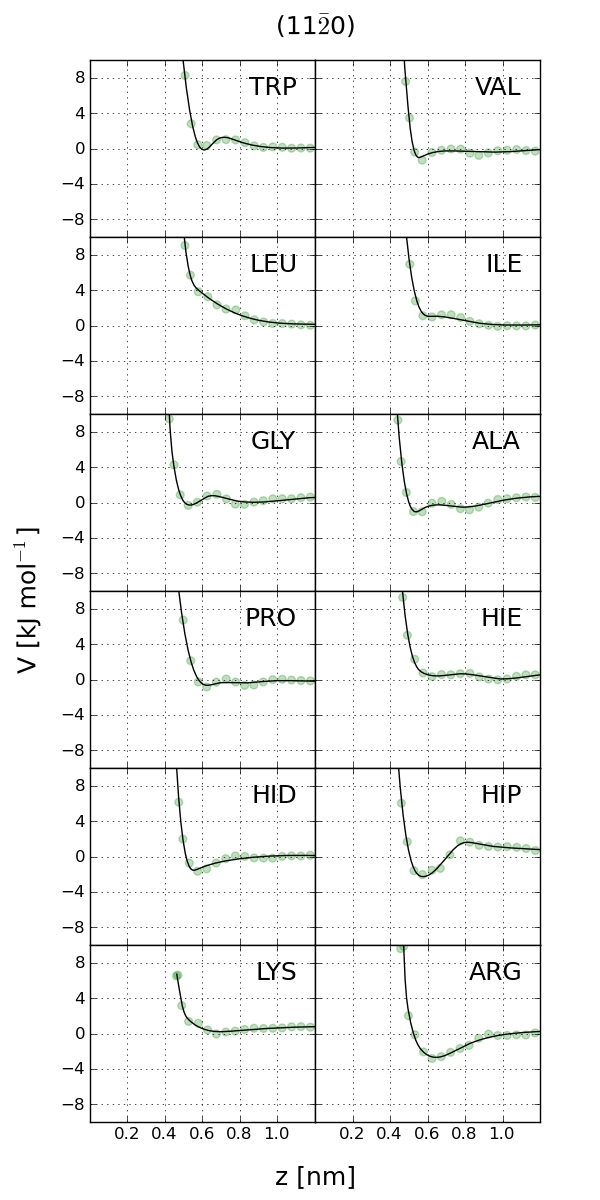
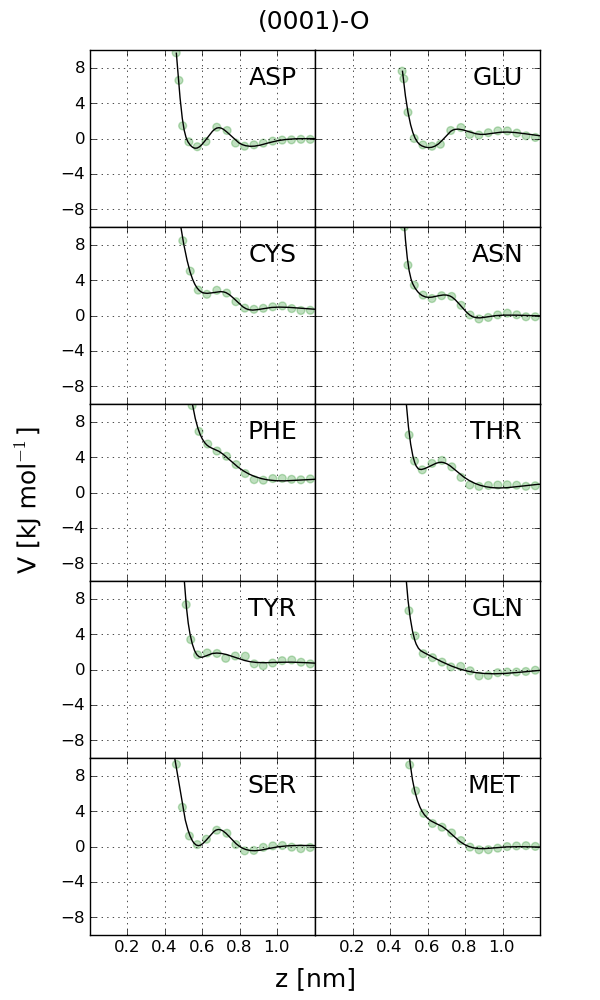
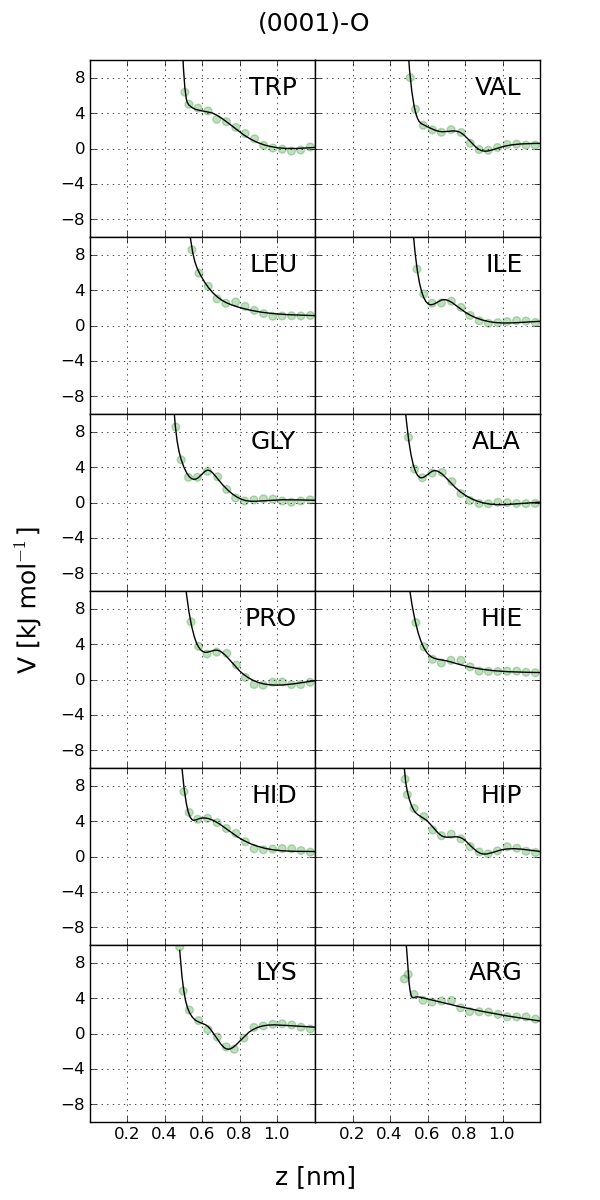
We use the umbrella sampling method 25, 26 to derive the potential, , of the mean force (PMF) for single AAs in water solutions as a function of the distance above a surface of ZnO. The depth of the lowest negative minimum in , defines the parameter . There could also be positive local energy minima that provide trapping but would be higher than at large separations from the surface. is optimized over the lateral directions and and is averaged statistically.
We then consider MD of a small protein, the tryptophan cage, and characterize its binding-unbinding behavior near the ZnO surface. The weak ’s associated with ZnO means that binding is expected to be temporary and implementable in many ways. In addition, the distortion of an adsorbed protein is likely to be weak and thus occuring without any loss of biological functionality. This feature should make ZnO-based devices to be good platforms for bio-functionalization.
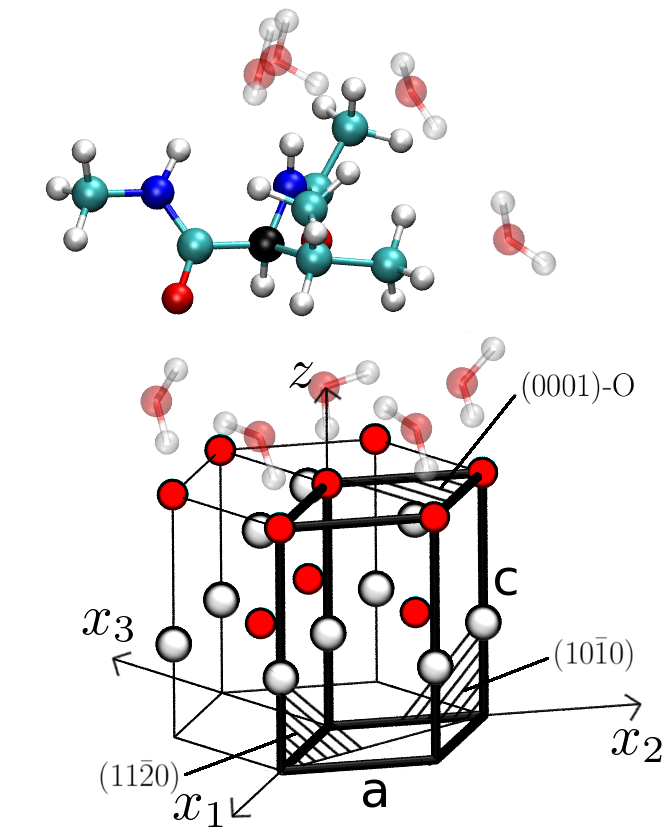
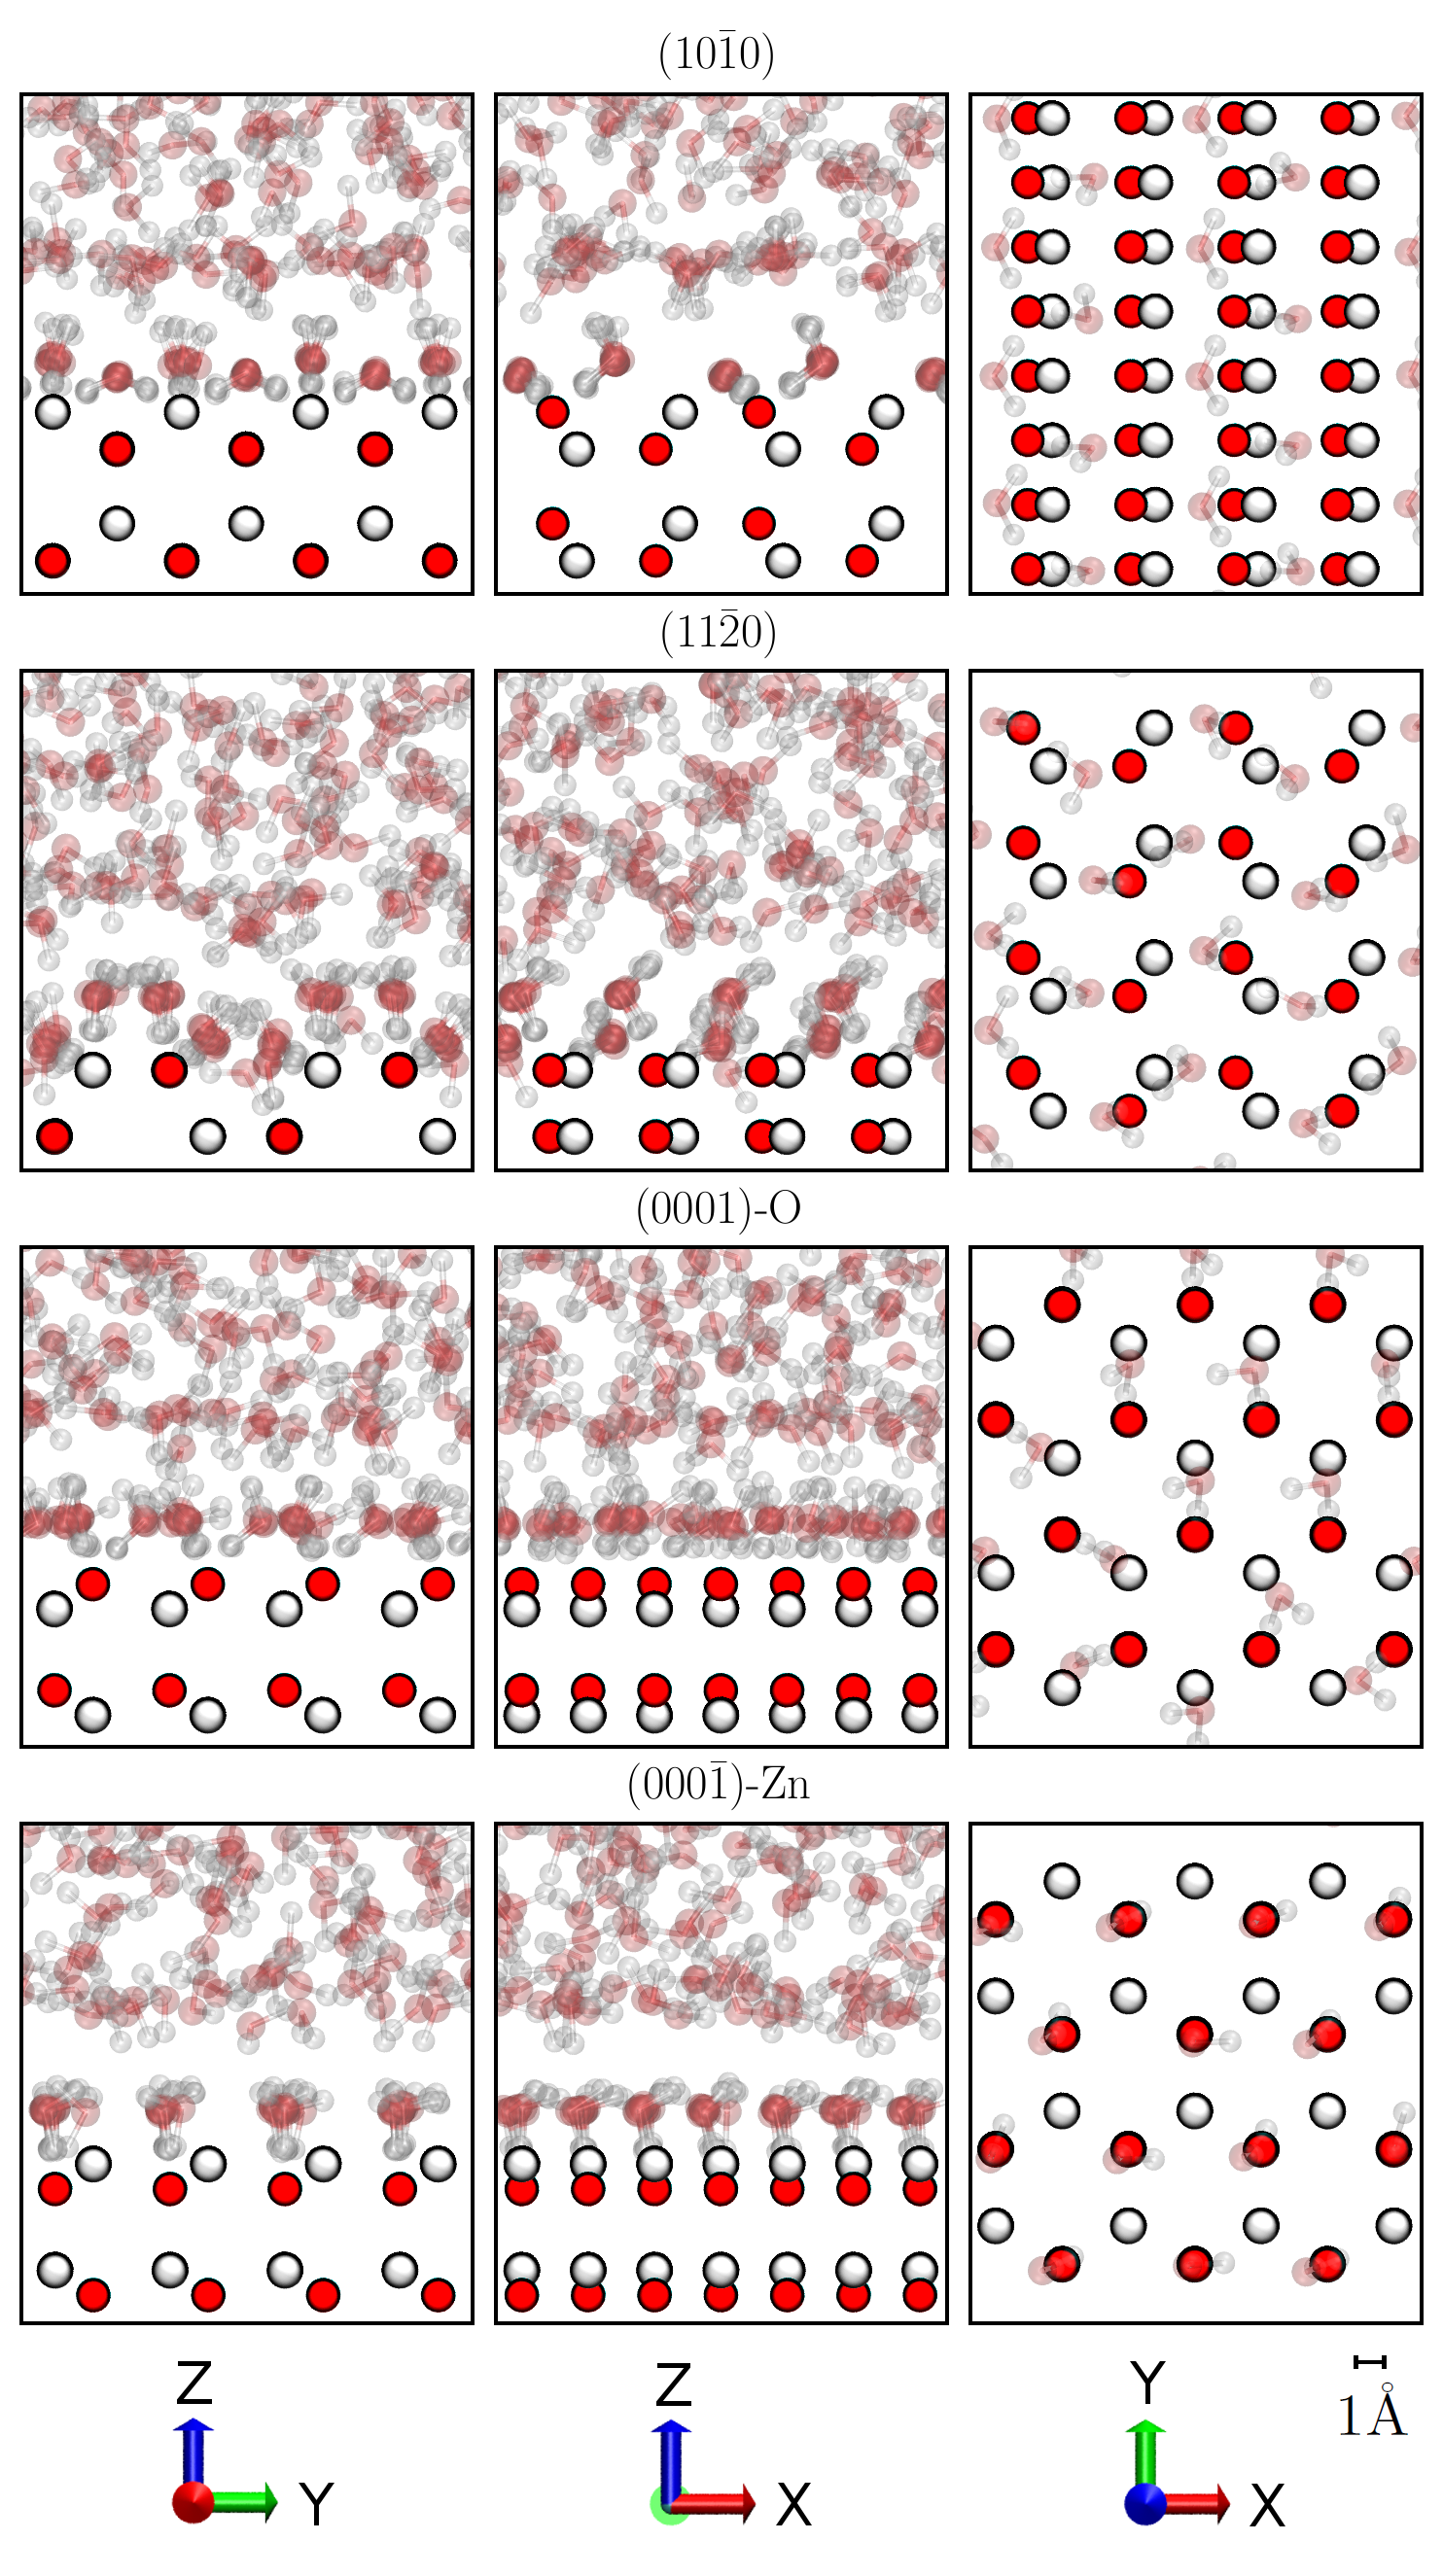
ZnO in its crystalline form under normal conditions has a hexagonal wurtzite-type structure (see Fig. 1) with the lattice constants =3.25 Å and =5.2 Å 27. Its surface morphology is defined by four commonly found faces: (0001)-O, (000)-Zn, (100) and (110) 28. Here the symbol O (Zn) indicates that the top layer is made of the oxygen (zinc) atoms. The first two are called polar since the first layer of atom has a net charge. The last two are called non-polar (but this does not imply that they are hydrophobic). For ZnO powders, the non-polar faces represent about 80% of the exposed surfaces and the remaining 20% are mainly polar 29. Our simulations pertain to all of these faces.
2 Method
Our all-atom MD simulation employ the GROMACS 4.0.7 package 43 with the AMBER-99 force field 44. The package has been designed to study proteins in bulk water and the introduction of the solid surface requires making modifications. The first approximation is that the solid is rigid and bulk-like, i.e. not distorted at the surface. We envision the space above the surface being filled with water molecules – as described by the TIP3P model 45 – and with either an AA or a protein. The biomolecules and water molecules have partial charges on their atoms. They interact with one another electrostatically but also through the Lennard-Jones like interactions which account for repulsive cores and dispersive features of the atoms. Similar sets of interactions involve couplings with the atoms of the solid. The Lennard Jones length, , and energy, , parameters for atoms, , in ZnO have been determined 2 through the density-functional theory (DFT). Following this reference we take 2.128 Å for , and 0.418 kJ mol-1 for for the O atom. For the Zn atom we take 1.711 Å for , and 1.254 kJ mol-1 for . Generally, for atoms interacting with atoms , we determine the corresponding parameters through and .
The standard procedure of making the simulations feasible is to apply cutoffs for all relevant interactions. We use the cutoff, , of 1.0 nm combined with the gradual switching off of the interactions between and 1.2 nm. Water molecules together with the AA are placed in a space of size nm, where and depend on the surface and are about 3.5 nm each. In proper runs, is equal to 4 nm. A reflecting wall for water molecules is placed at =4 nm. Above this wall, there is an empty space extending to =12 nm. Another reflecting wall, just for the amino acids, is placed at =3.5 nm – otherwise a protein may get trapped at the water-vacuum interface. The purpose of this construction with the vacuum is to allow for the usage of the periodic boundary conditions (in the periodic image, above the empty space there are the surface atoms) with the pseudo two-dimensional particle mesh Ewald summation 1.
The MD simulations are performed using the leap-frog algorithm with a time step set of 1 fs. Temperature coupling with a Berendsen thermostat is implemented with a time constant of 0.1 ps at a temperature of 300 K. Initial velocities are generated according to the Maxwell distribution and then the system is energy-minimized by using the steepest descent algorithm. Next, the system is equilibrated through 4 ns of MD with set to 5 nm. This results in water at the top being depleted due to attraction at the bottom and then gets reduced to 4 nm. Further equilibration continues for 1 ns and only then the biomolecules and Na+ and Cl- ions are inserted adiabatically. The concentration of the ions corresponds to the physiological 150 mM: 4 ions of Na+ and 4 ions of Cl-. If a biomolecule has a net charge due to the side groups, extra ions are inserted to neutralize the net charge.
An AA in a protein is in the unionized and not zwitterionic form. Thus in studies of a single but unionized-like AA we attach caps to both sides of the molecule (the acetyl and N-methylamide groups to the N- and C-terminus respectively) that eliminate the terminal charges and mimic the presence of a peptide chain (see, e.g. 3). Histidine is considered in its three possible protonation states: HIE (H on the N atom), HID (H on the N atom) and positively charged HIP (H on both and N atoms). At the assumed value of pH of 7, all three forms are present in equilibrium. The VMD software is used for viewing and analyzing the MD results.
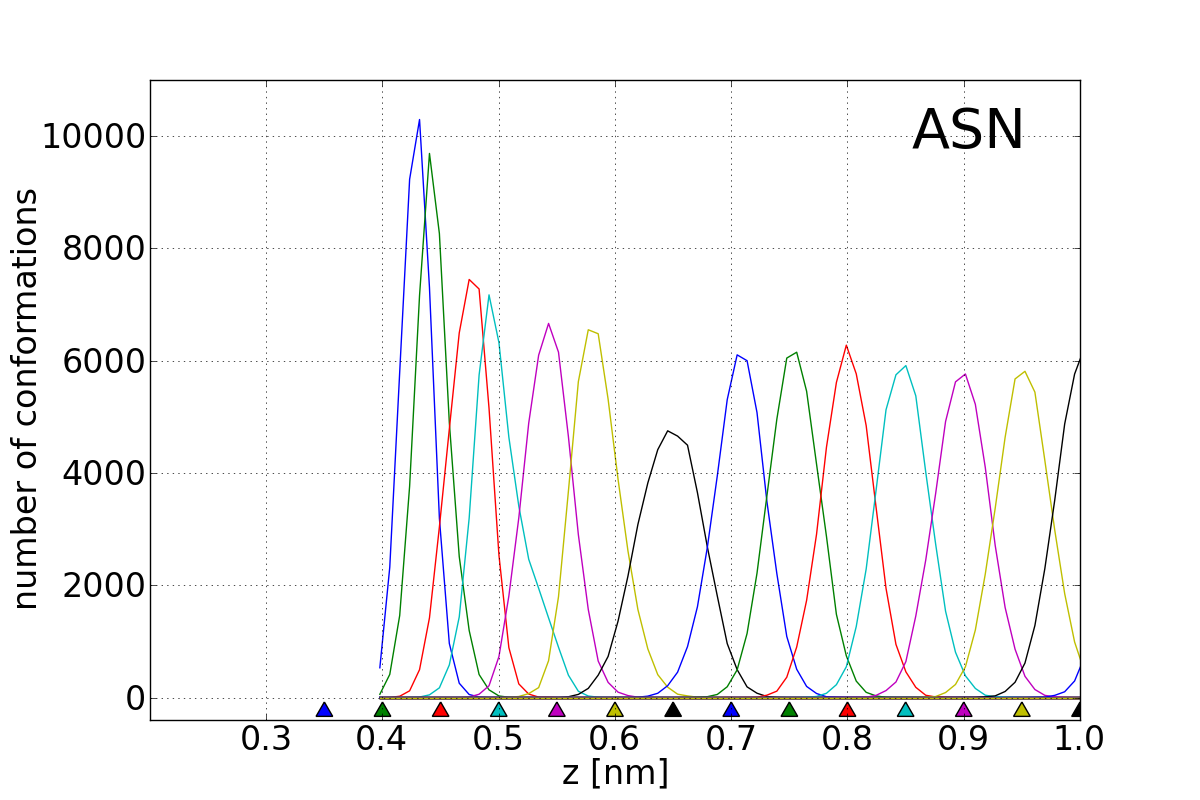
The PMF is an effective potential that yields the average force 48. We use the umbrella sampling 25, 49 to determine it for the center of mass (CM) of the capped AAs. In the first stage of the method, a set of initial conformations for representative values of is generated by pulling the CM of the AA along the -axis. Pulling is implemented through a ”dummy particle” which moves towards the surface with a constant speed of 1 nm ns-1 from =2 nm to =0 and drags the CM by a harmonic force (the spring constant, , is 5000 kJ mol-1 nm-2). The lateral motion is not constrained. The conformations are scanned every 0.1 ps in order to save at least 30 of them with the CM within each of the interval of 0.05 nm (0.02 nm in vacuum, combined with a larger ). In this way, about 35 conformations (135 in vacuum) are collected for each AA. They are used in the second stage for 5 ns of further runs each (3 ns correspond to equilibration) in which the -location of the pulling particle is fixed and the CM moves within a sampling window of width . The distribution of the resulting vertical locations of CM (see Fig. 16 in Electronic Supplementary Information – ESI) in the window has a maximum where the harmonic pull balances all forces acting on AA (without the caps) in the direction. This force is averaged over time and distance within each window and integrated over to get the PMF.
3 Results
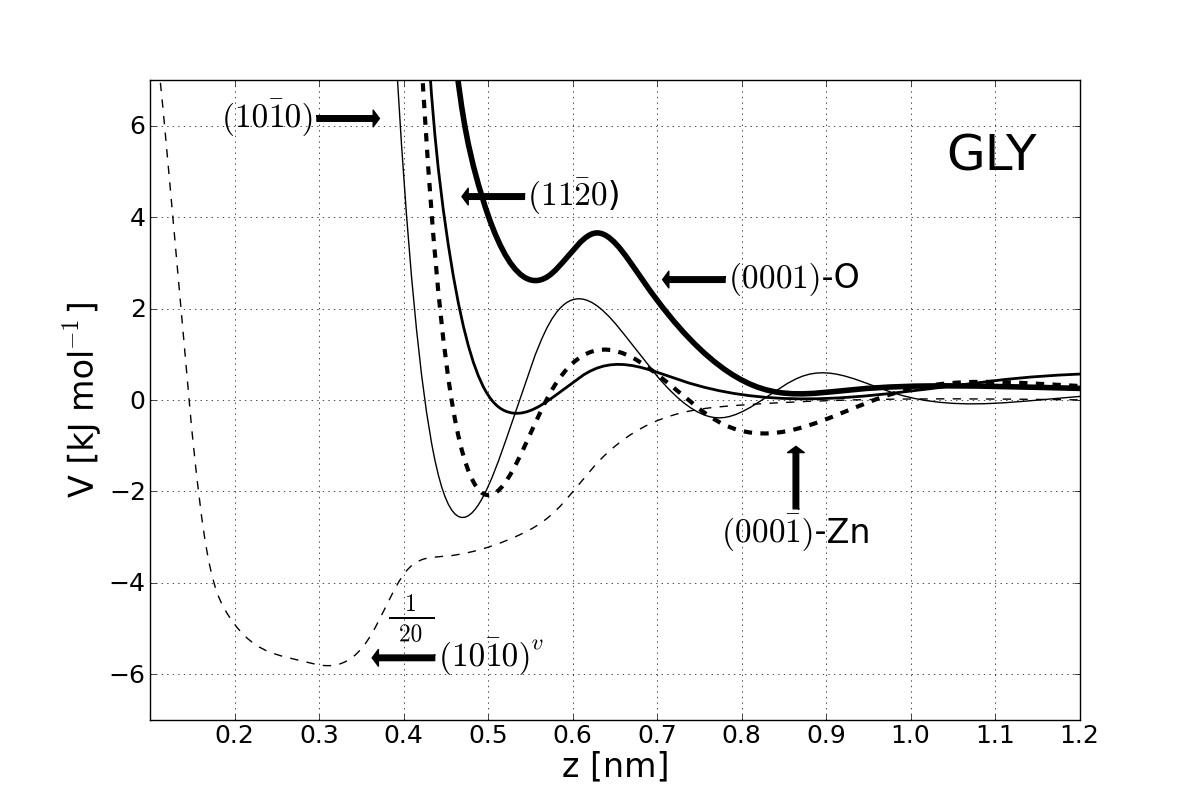
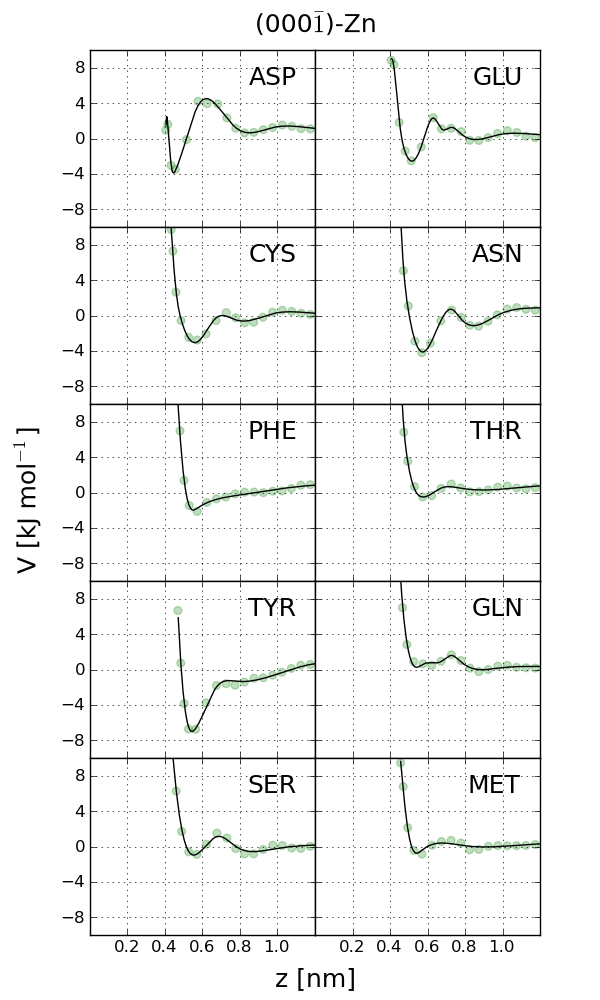
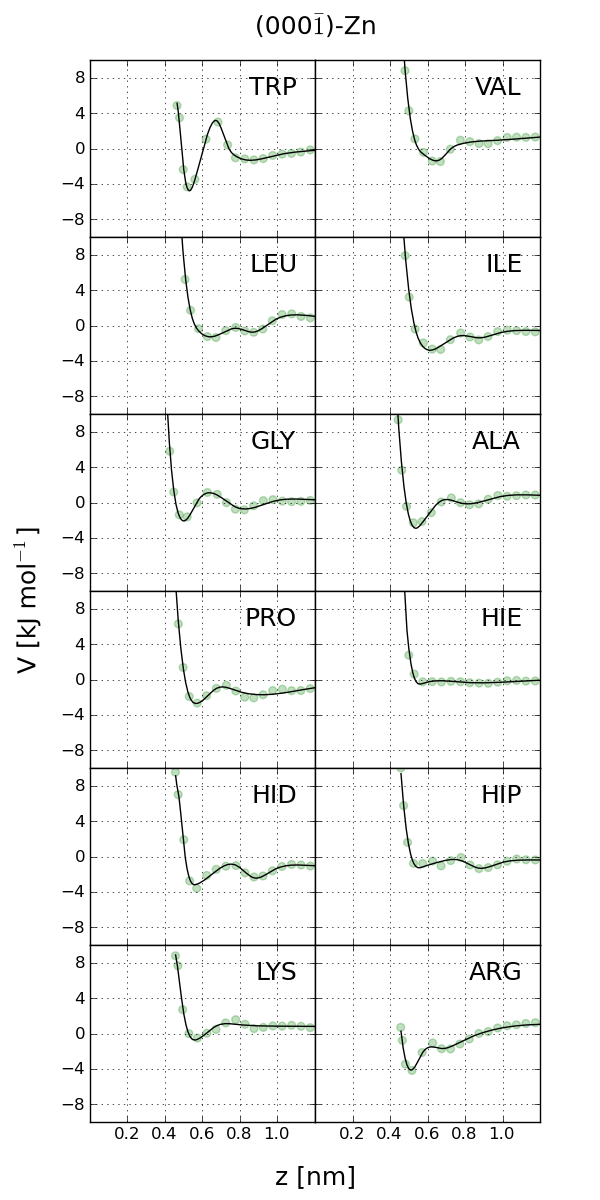
The plots of for the CM of all AAs at the four interfaces can be found in ESI. Here, as an illustration, we consider the case of glycine. Figure 2 shows that the PMF has the form of a potential well with a strong repulsion at small values of combined with ondulations in the attraction part which are observed when moving away from the surface. We describe the potential well through its depth, , and the vertical distance, , of the deepest minimum. For the glycine on the (100) surface, is 0.31 nm in vacuum, and 0.47 nm in water. The corresponding values of are 116.24 kJ mol-1 and 2.57 kJ mol-1. Note a profound role of the solvent: its introduction reduces the binding energy by a factor of 45.2 and shifts the optimal binding distance by 0.16 nm away from the surface. Tables 1 and 2 indicate that similar effects of water are observed for other AAs. The noted significance of the solvent for interactions with ZnO is in contrast to a recent finding by Pandey et al. 30 pertaining to interactions with graphene. In their model, no electric charges are associated with the carbon atom of graphene and hence the density profile of water gets patterned only in a minor way through the van der Waals interactions. Thus there is no buildup of solvent density in the first layer. Thus AAs are able to interact with graphene directly, i.e. nearly as in vacuum.
When looking at the results obtained for (100) in vacuum, we note the exceptionally high binding energy of histidine, including its unprotonated form (HID). The corresponding is the highest obtained among the uncharged AAs (see Table 1). This finding is consistent with the stability of proteinic structures, such as the zinc finger proteins 31, in which the Zn+ ion is coordinated by two (unprotonated) histidines and two cysteins. The reason for the proteinic and surface situations being comparable is that an interior of a protein is typically devoid of water molecules. Another comparison can be made with the data on layers of non-capped alanine placed on the (100) surface of ZnO in the ultra high vacuum apparatus and studied by the X-ray photoelectron spectroscopy 21. It has been determined that alanine binds in vacuum and the coverage is about 0.4 nm thick. Alanine in its monodentate and bidentate forms has been found to bind with the energies of 1.03 and 1.75 eV respectively, compared to our 110.98 kJ mol-1, i.e. 1.15 eV. Our system is more similar to the monodentate form so the agreement is close. The zwitterionic form has been found not to be stable on ZnO. However, in the DFT calculation in which it is constrained to stay at the surface, the binding energy is predicted to be 1.39 eV 21. These results suggest that our PMF for the capped alanine in vacuum has the right order of magnitude.
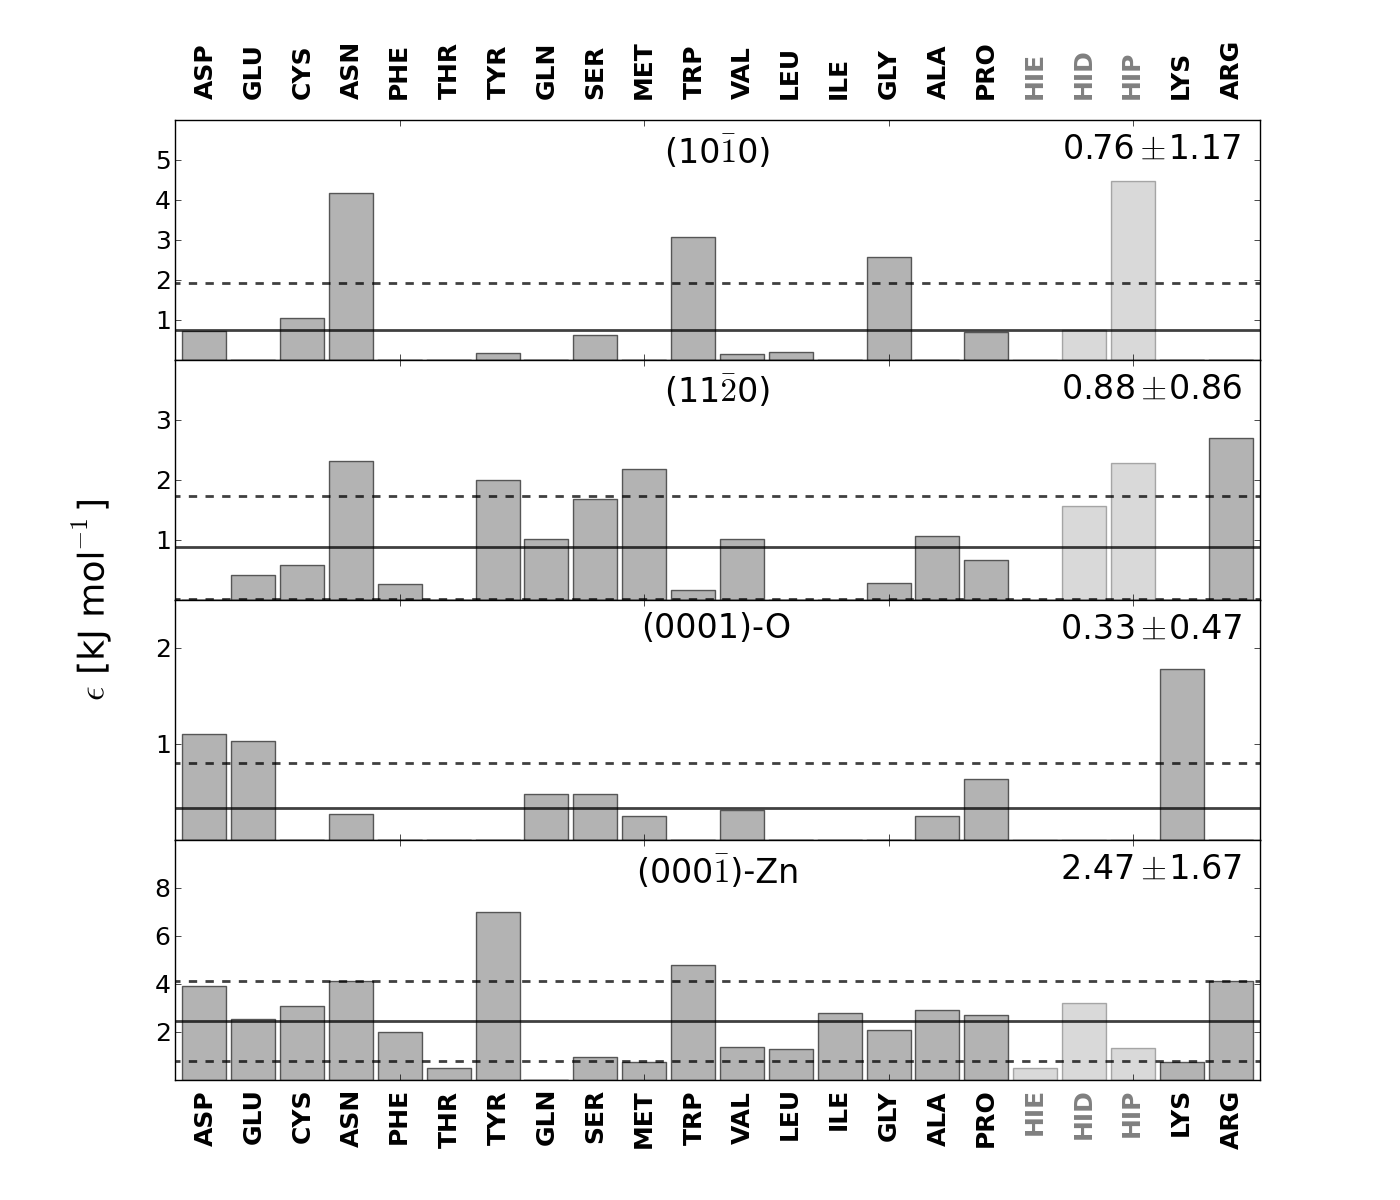
Table 1 and Figure 4 show that the highest binding energies are comparable to that in a hydrogen bond (6.9 kJ mol-1 for O-H binding N and 5.0 kJ mol-1 for O-H binding O). Among the four faces, glycine exhibits the strongest attraction to (000)-Zn – 3.36 kJ mol-1 but experiences repulsion from (0001)-O. If one considers all AAs and all four faces, the strongest attraction is found for tyrosine at the (000)-Zn surface.
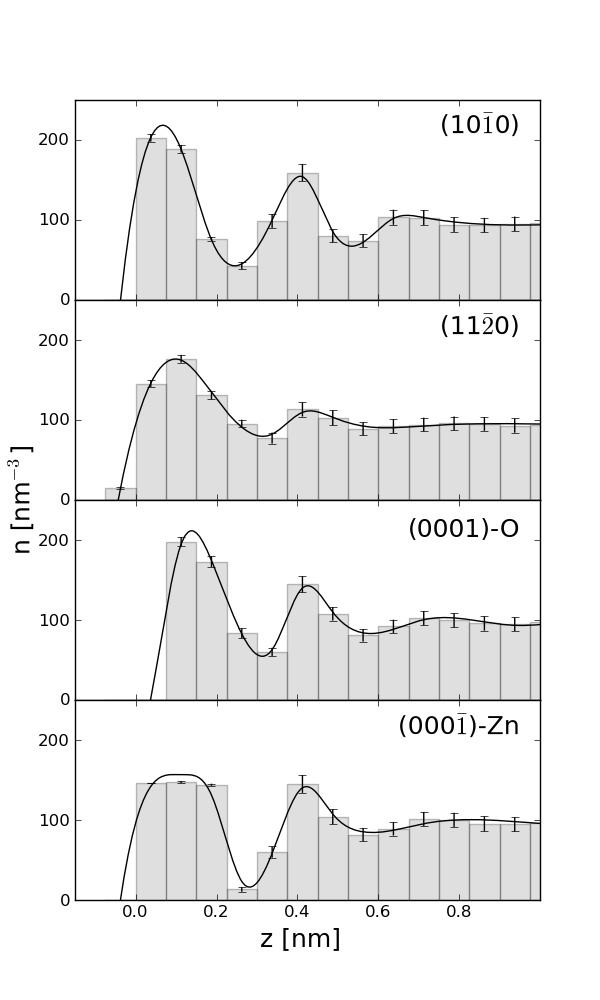
The reason for the all-changing role of water is that it gets adsorbed to the surface in a profiled manner in an analogy to what has been observed in the Lennard-Jones fluids near attractive walls 32, 33. The water number density profiles shown in Figure 3 display at least two well defined maxima. The presence of the maxima is consistent with the DFT calculations for single molecules of water placed at distances corresponding to the first layer above the (100) ZnO surface where the largest binding affinity has been found.
Experimental studies of water molecules on metals 34 indicate existence of rich variety of structures with both H-up and H-down orientations. For ZnO, however, we observe the H atoms of the molecules in the first layer to prefer orientations that are closer to the surface but in a manner that depends on the surface (see Fig. 14 in ESI).
The density profiles depend on the type of the surface. For (100) the first layer is 0.08 nm closer to the surface than in the case of (0001)-O and the gap between the two layers is more articulated. The gap is even more articulated for the (000)-Zn surface.
The first layer fluctuates much less than the second (in 1 ns only two molecules exchange between the two in the case of (110) - no exchange has been detected in other cases) but they both provide screening from the surface and hinder a closer approach of a biomolecule to the surface.
An inspection of the average values of ’s given in Table 2 leads to the conclusion that, at the deepest minimum of , the CM of an AA is above the second layer – for each of the four surfaces. The corresponding CM of the side group is either between the first two layers or within the second layer. As illustrated at the top of Figure 1 qualitatively, the AA displaces water level at the second layer and makes a cavity for itself. Its interactions with the wall are screened by the first layer – a direct approach to the bare surface is unlikely. The motion of the pulling particle has rarely led to some penetration of the first layer. It should be noted that the calculations were performed by adding AAs to water. If water was added after the adsorption of an AA in vacuum then no dissociation was observed. (However, the total energy of the system becomes less negative in the latter case.) The reason for this behavior is that when water is present from the begining, the density profiling sets in and the formation of the first layer prohibits a closer approach of an AA to the surface.
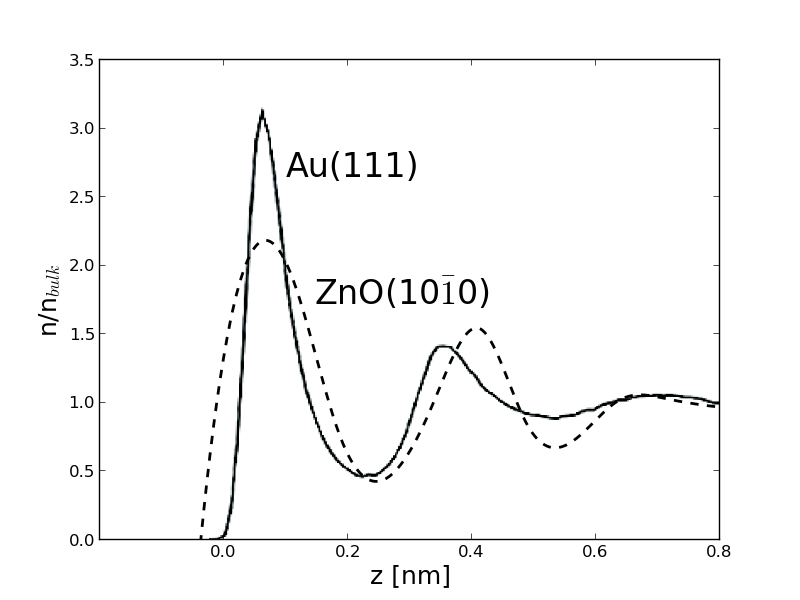
It should be noted that the density profile of water near Au(111) 3 is quite distinct compared to the profiles found near ZnO. The two are compared in Figure 15 in ESI where the case of ZnO is represented by the (100) face. The first density maximum near the Au surface is almost 50% higher and noticeably narrower than near the ZnO. The corresponding PMFs have minima right in the middle of the first layer 3; see also 35. This leads to the AAs approaching closer to the surface, breaking the first layer and binding stronger. The reason for such a behavior is relate to the details of the modeling of Au surface 36. In particular, the effective charges are more than three times smaller than in the model of ZnO surface, e.i. 0.3 and -0.3. These charges are even smaller than in two models of the water molecule, SPC and TIP3P, i.e. about 0.4 and -0.8 for H and O atoms respectively. Furthermore, the opposite charges on gold are merely 0.07 nm apart, which makes the net electric field small but accounts for the polarizability properties of the metal. For comparison, Zn and O atoms are separated by about 2 nm and bind water much stronger making the first layer impenetrable.
Our results for ZnO are qualitatively consistent with related simulations 37 pertaining to ammonium, methane, methanol, methanoate, benzene and guanidinium which are analogues of the side chains of lysine, alanine, serine, aspartic acid, phenylalanine, and arginine respectively, at the aqueous rutile TiO2 (110) interface. The effective charges used were 2.196 and -1.098 for the Ti and O atoms respectively. We get energies of the similar order of magnitude, plots of also come with minima both at positive and negative energies, and there are also repulsive situations. Some analogues tend to bind to the first layer of the solvent instead of to the solid.
We now discuss sequences of AA’s. One example is ZnOBP – the ZnO binding peptide. It has been recently discovered 38 that ZnOBP suppresses the (0001) growth from zinc hydroxide so it can be used to grow flattenned ZnO nanoparticles – an approaching Zn atom cannot attach to the cristal directly. The ”hot spot” in the peptide has turned out to be MET-HIS-LYS at its 5-6-7 sequential sites. This finding has motivated Togashi et al. 19 to consider dipeptides MET-HIS and HIS-LYS for the same purpose. They work even better than ZnOBP whereas no effect was detected for the control dipeptides ALA-ALA, ALA-HIS, and HIS-VAL or the monomeric HIS, MET and LYS. These findings are surprising when confronted with the values of the binding energy listed in Table 1. For instance, at the (000)-Zn surface, of both ALA and VAL is larger than of MET or LYS. This suggests that binding energies of combined objects are not simply additive since interactions between AAs lead to conformational changes that may affect adsorption.
This lack of additivity has been shown to arise in peptides near the (100) Si surface 9: various sequential arrangements of a fixed set of AAs lead to different binding affinities. A similar work 39 involved a host of septapeptides near the surface of Pt and various degrees of affinities have been measured due to conformational flexibility. However, flexibility of proteins is generally reduced compared to short peptides so binding affinities may become more dependent on the single AA binding strength. None of the binding energies obtained here ensures a permanent AA adsorption to ZnO which agrees with the experimental findings on adsorption of monomeric AAs 19. We find that the (000)-Zn surface should attract AAs much better than (100) or (110) which explains the (0001) face suppression by dipeptids.
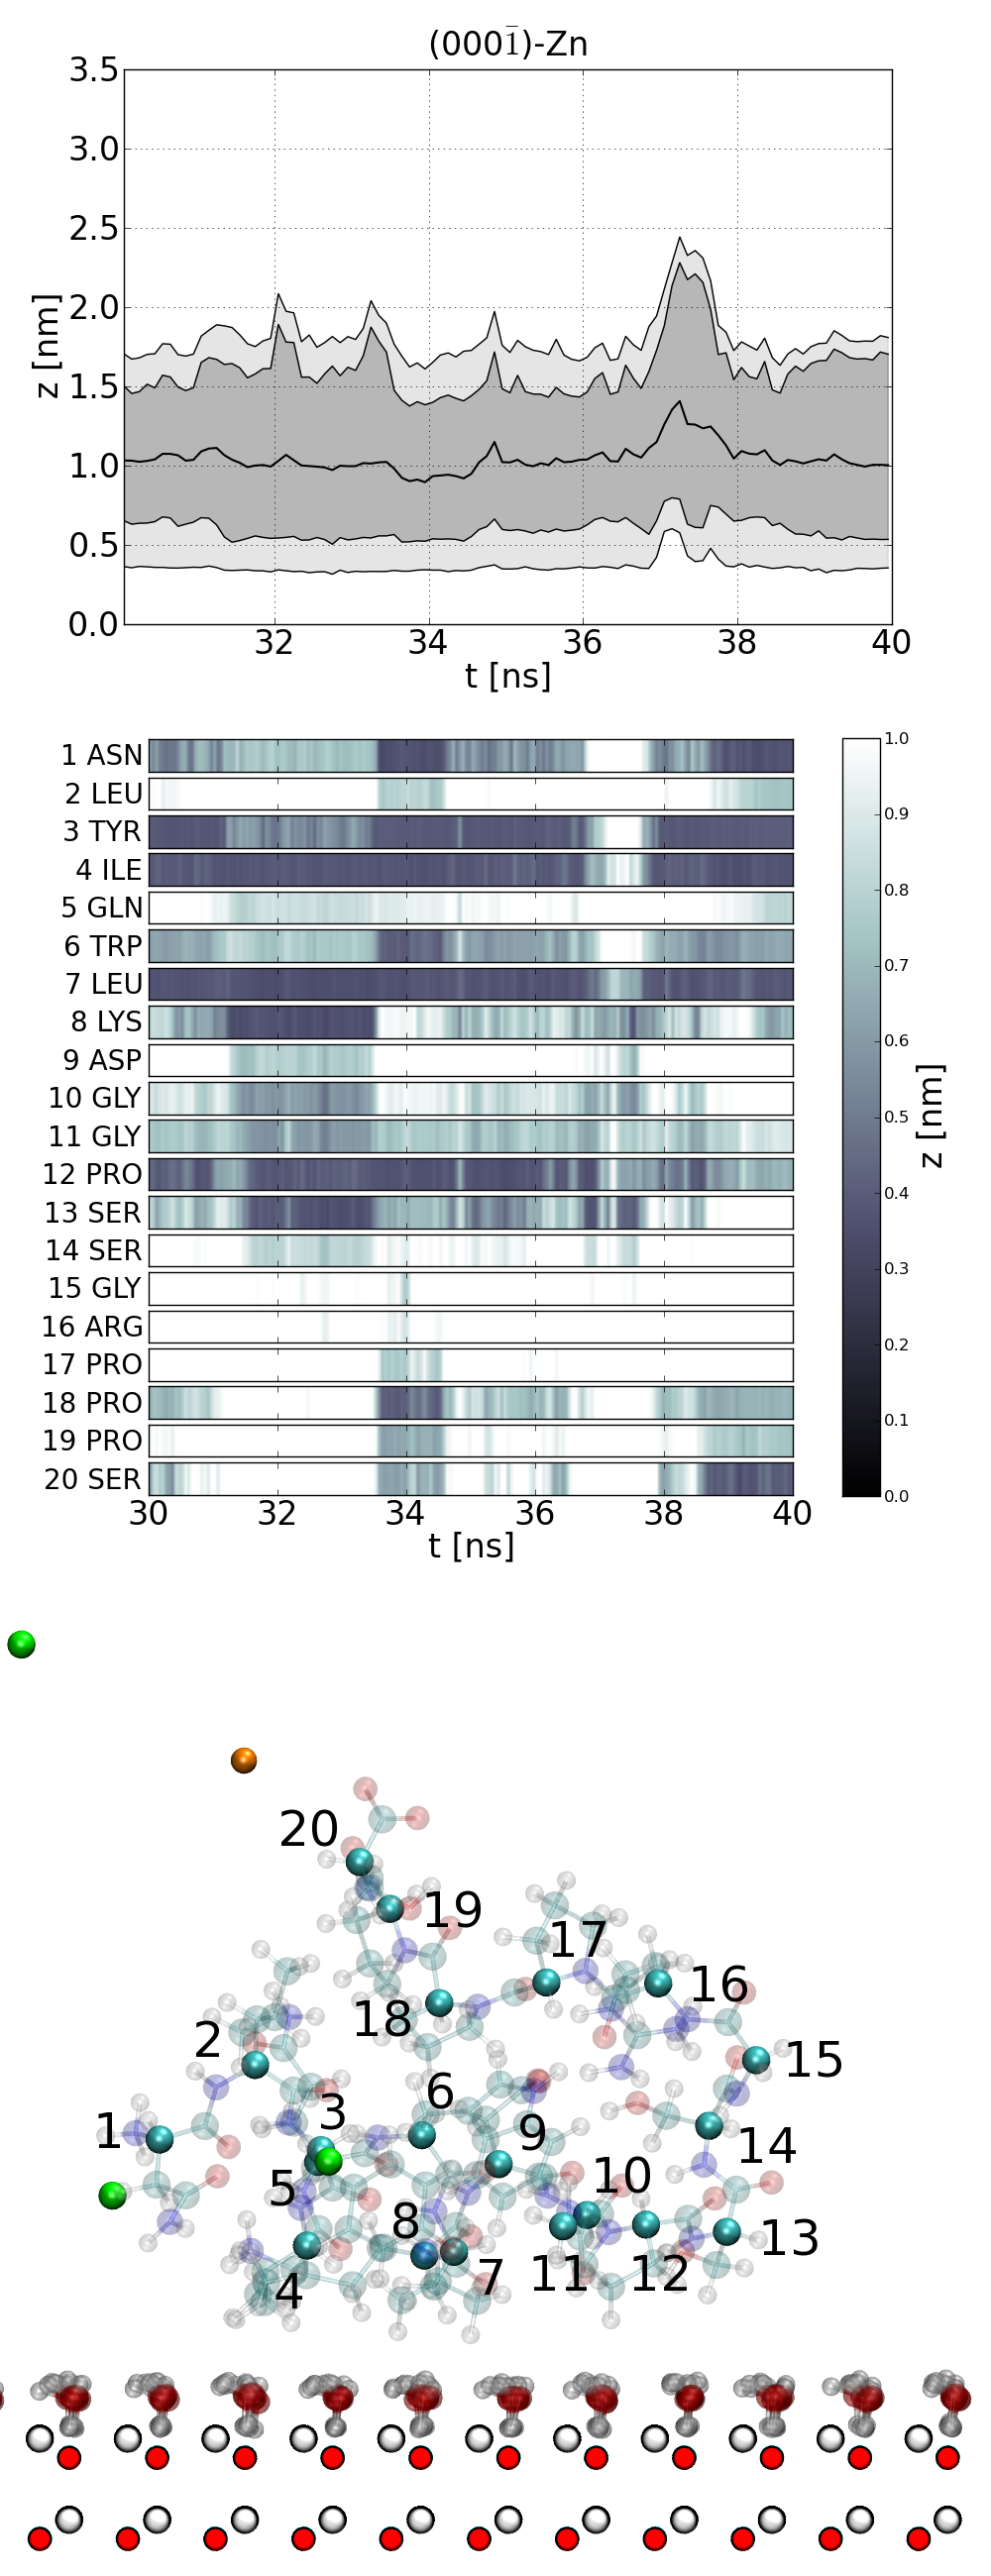
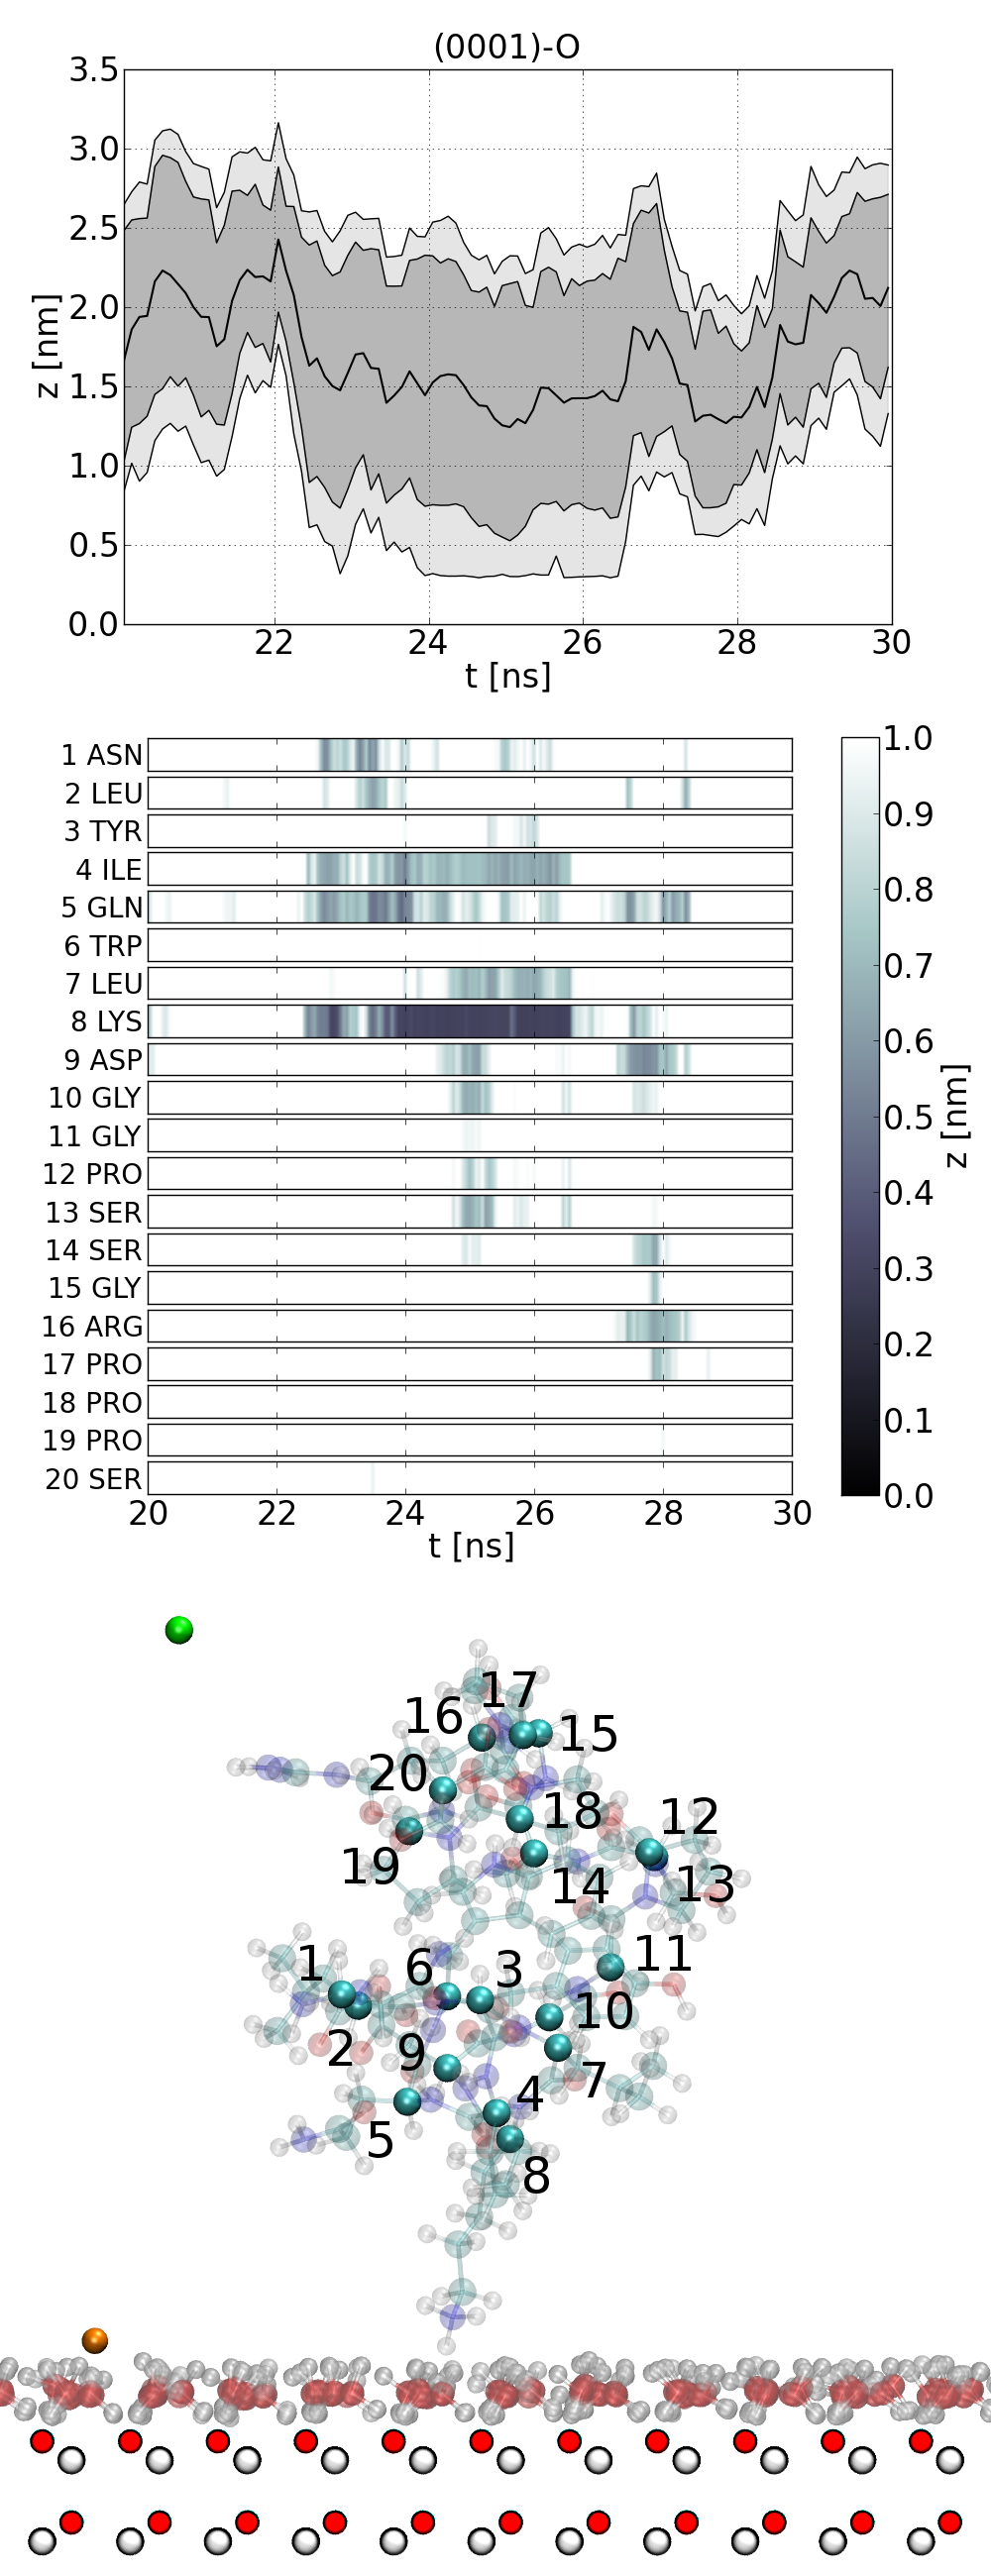
Tryptophane cage with the structure code 1L2Y and a sequence of 20 AAs is a convenient small protein for further studies of the issues of binding to surfaces. Our MD simulations suggest that once 1L2Y approaches a ZnO surface through diffusion, it may bind temporarily for between 0.5 and 20 ns. In altogether four trajectories of 40 ns for each of the surfaces that start with the CM at 2 nm, we have observed 34 temporary adsorption events: 8 for the (100) surface, 6 for 110), 7 for (0001)-O, and 13 for (000-Zn). In each of these, the set of AAs that coupled to the surface was distinct. In the case of (100), the coupling is usually due to the flexible lysine. The temporary nature of the attachment signifies that at most several of the bonds form and each of them is merely about one hydrogen-bond strong. Our pilot studies of the PMF for this protein suggest a potential with several minima with none of them deeper that -3 kJ mol-1.
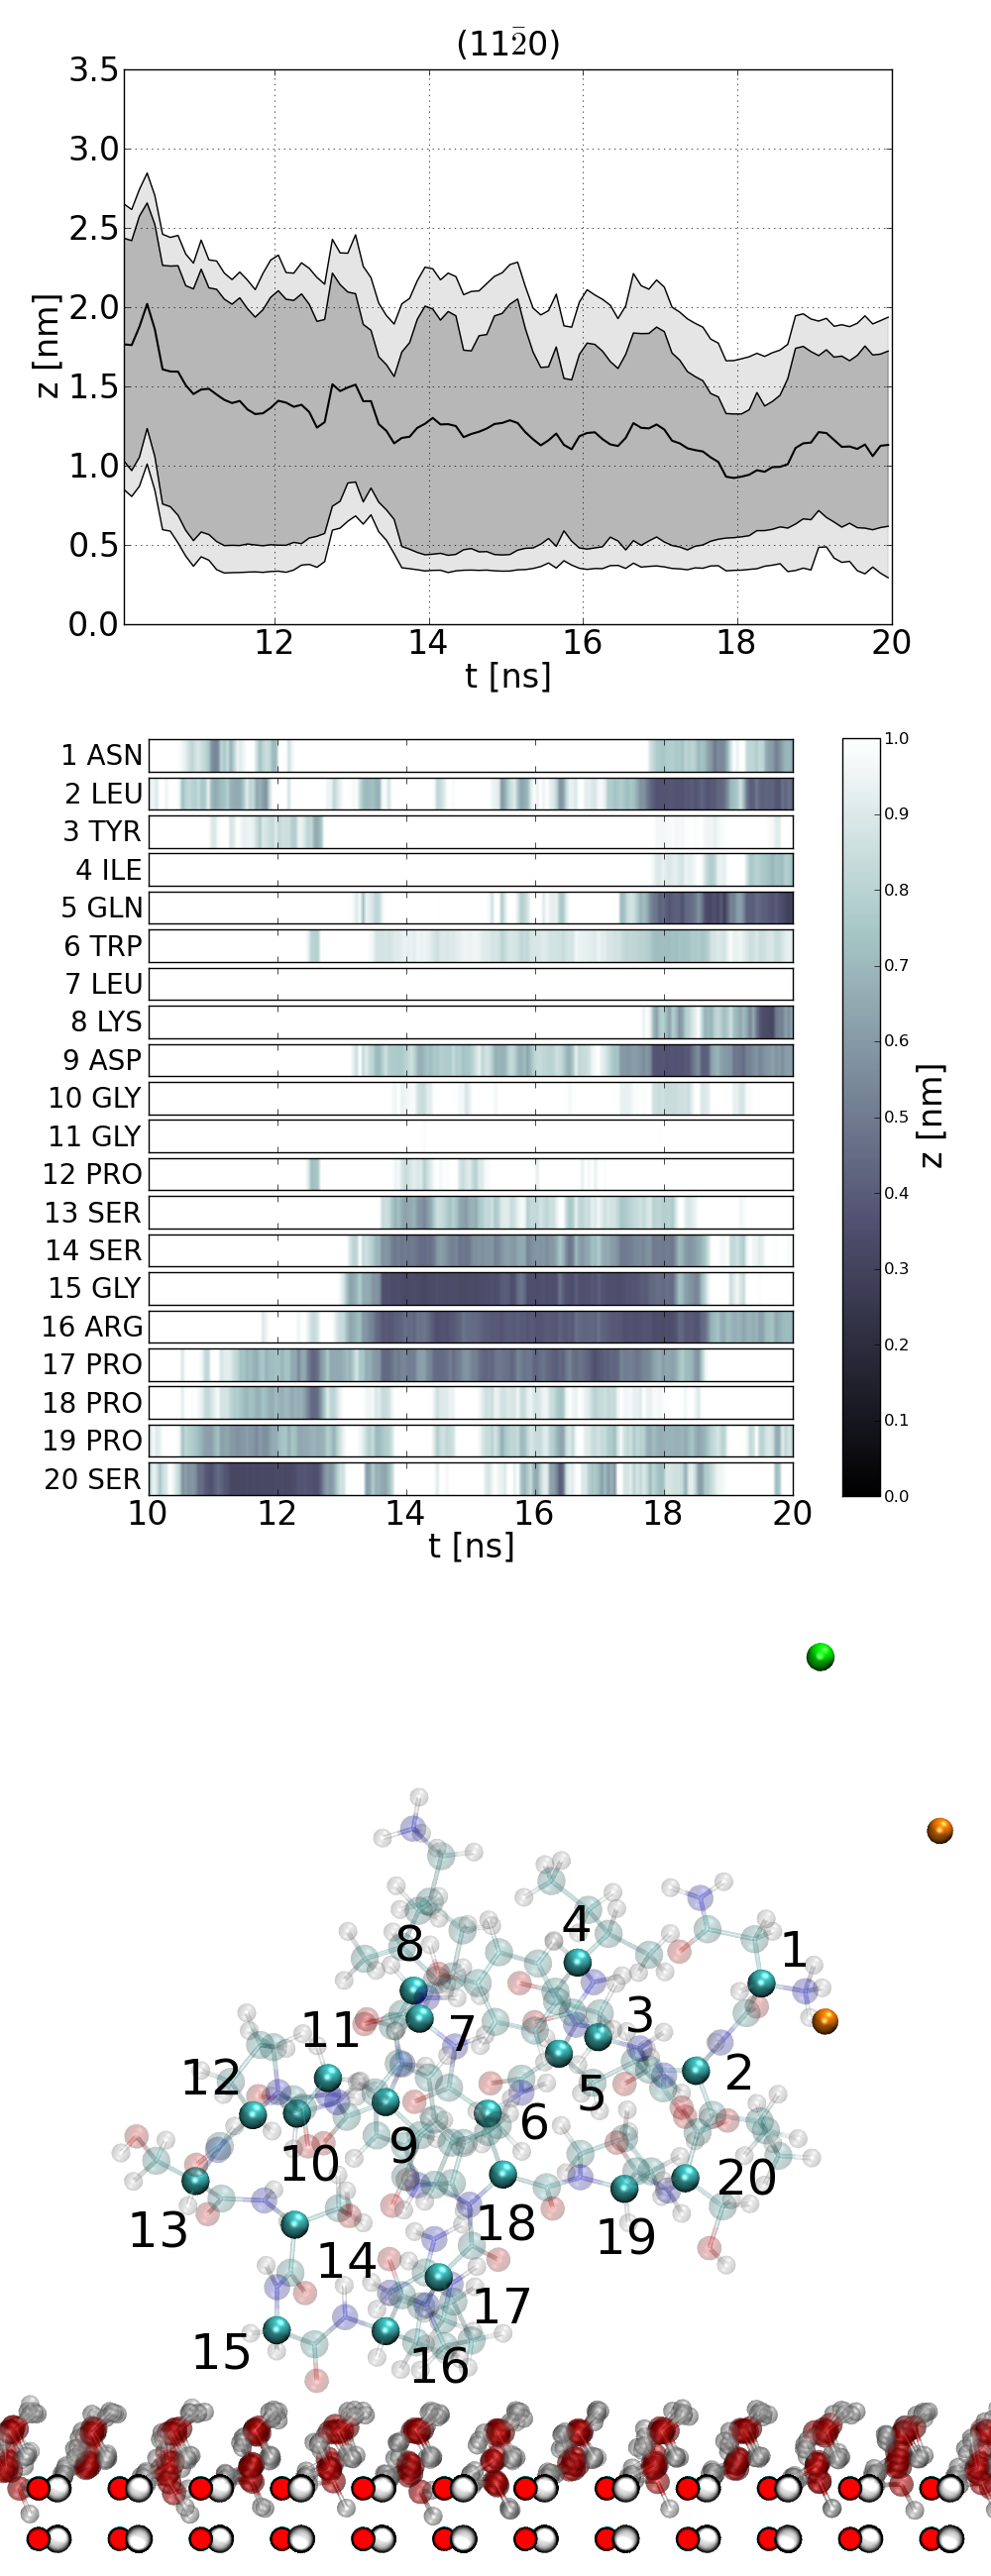
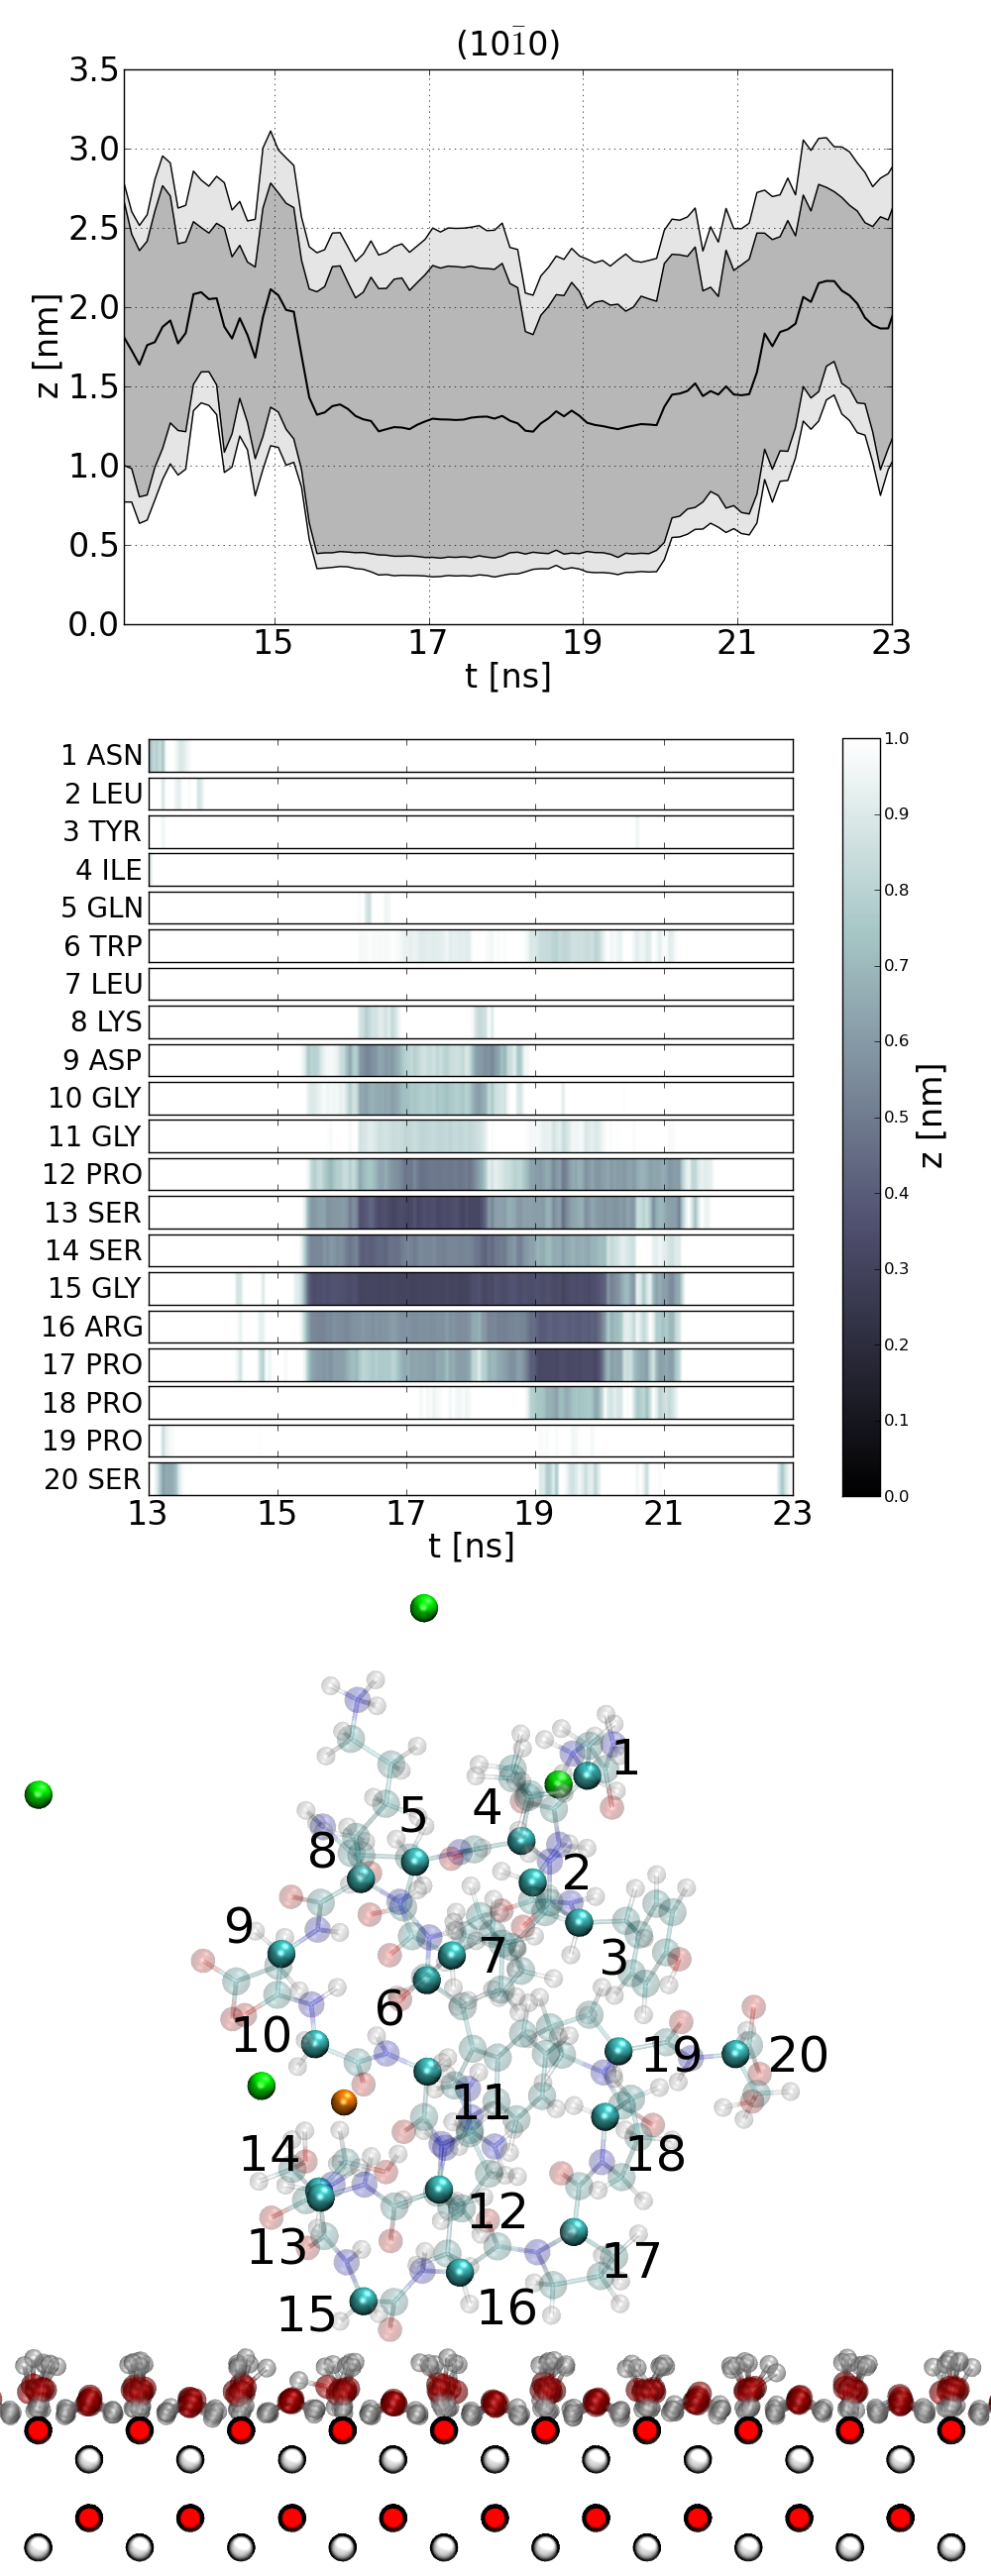
An example of a binding event shows Figure 5 for the case of (100). The top two panels pertain to a time interval between 13 and 23 ns in a trajectory that starts when the lowest atom is around 0.9 nm above the surface. The protein ”touches down” several times and then disengages before entering the interval we focus on here. Binding is seen to take place between 15.5 and 20 ns. The lowest placed AA is 15-GLY and the coordinate of its lowest atom is seen to be nearly fixed at nm. Between 18.9 and 19.9, adsorption appears to involve two more AAs: 16–ARG and 17-PRO. The former has no binding affinity to (100), according to Table 1. It is likely that it has come to the surface simply because its sequential neighbors got attracted there.
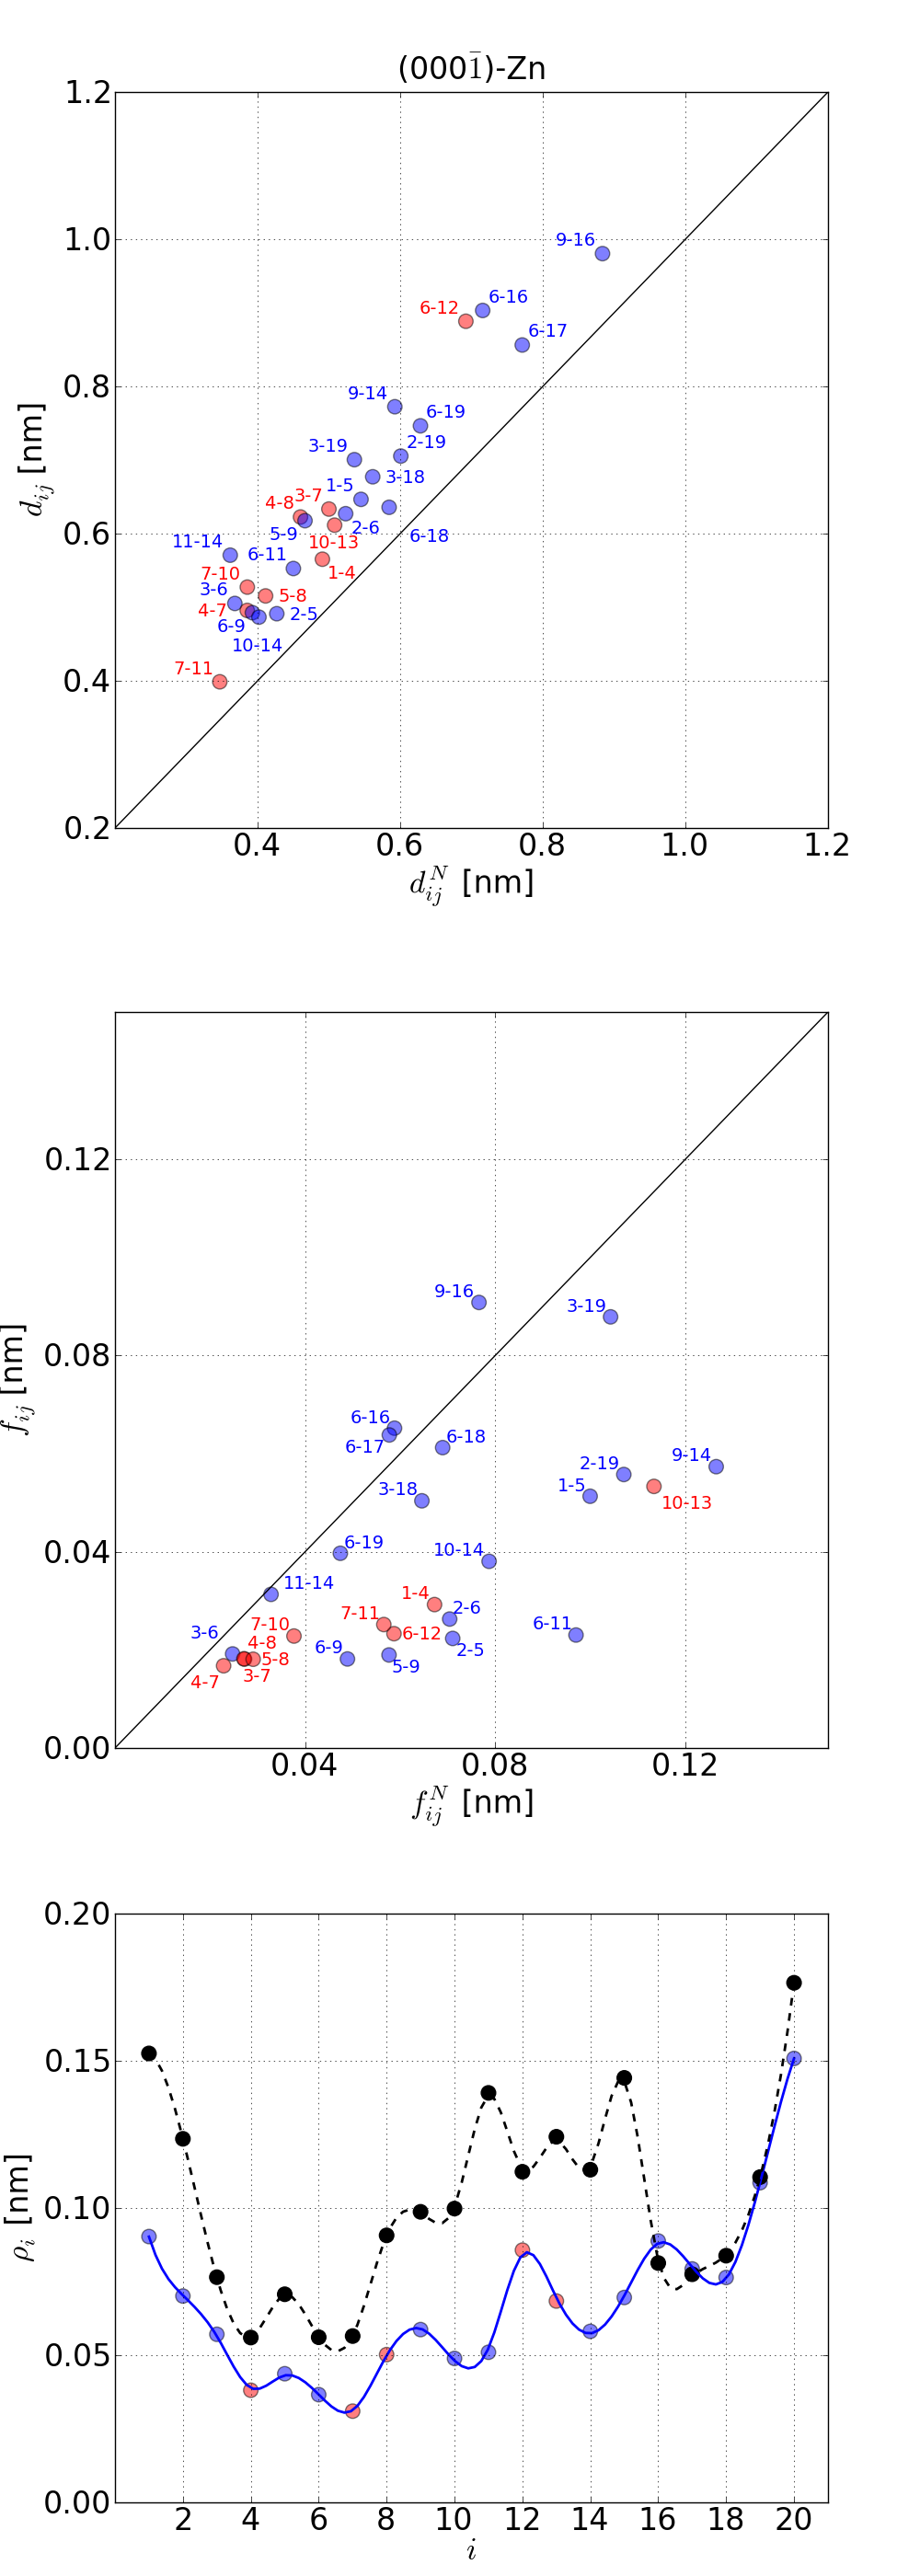
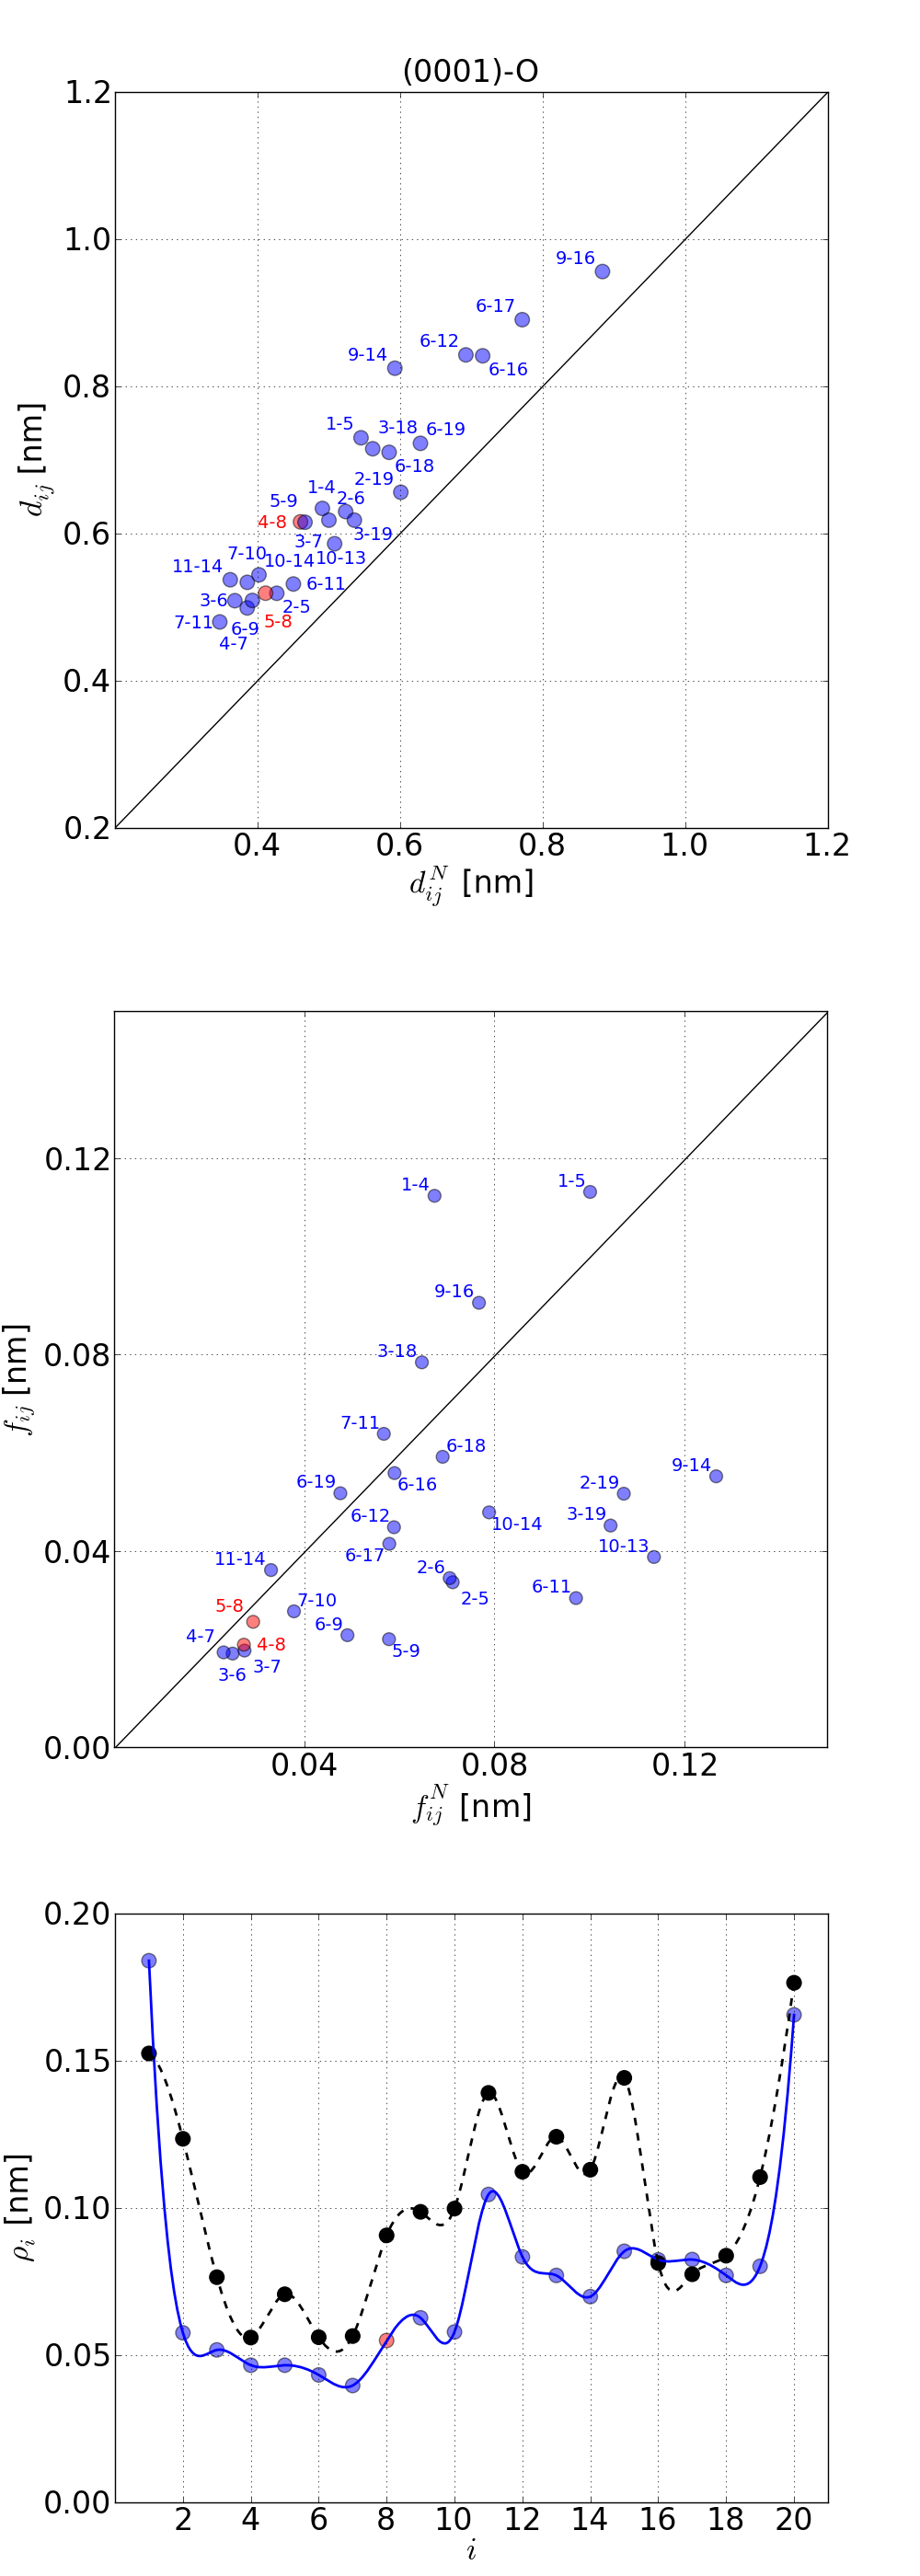
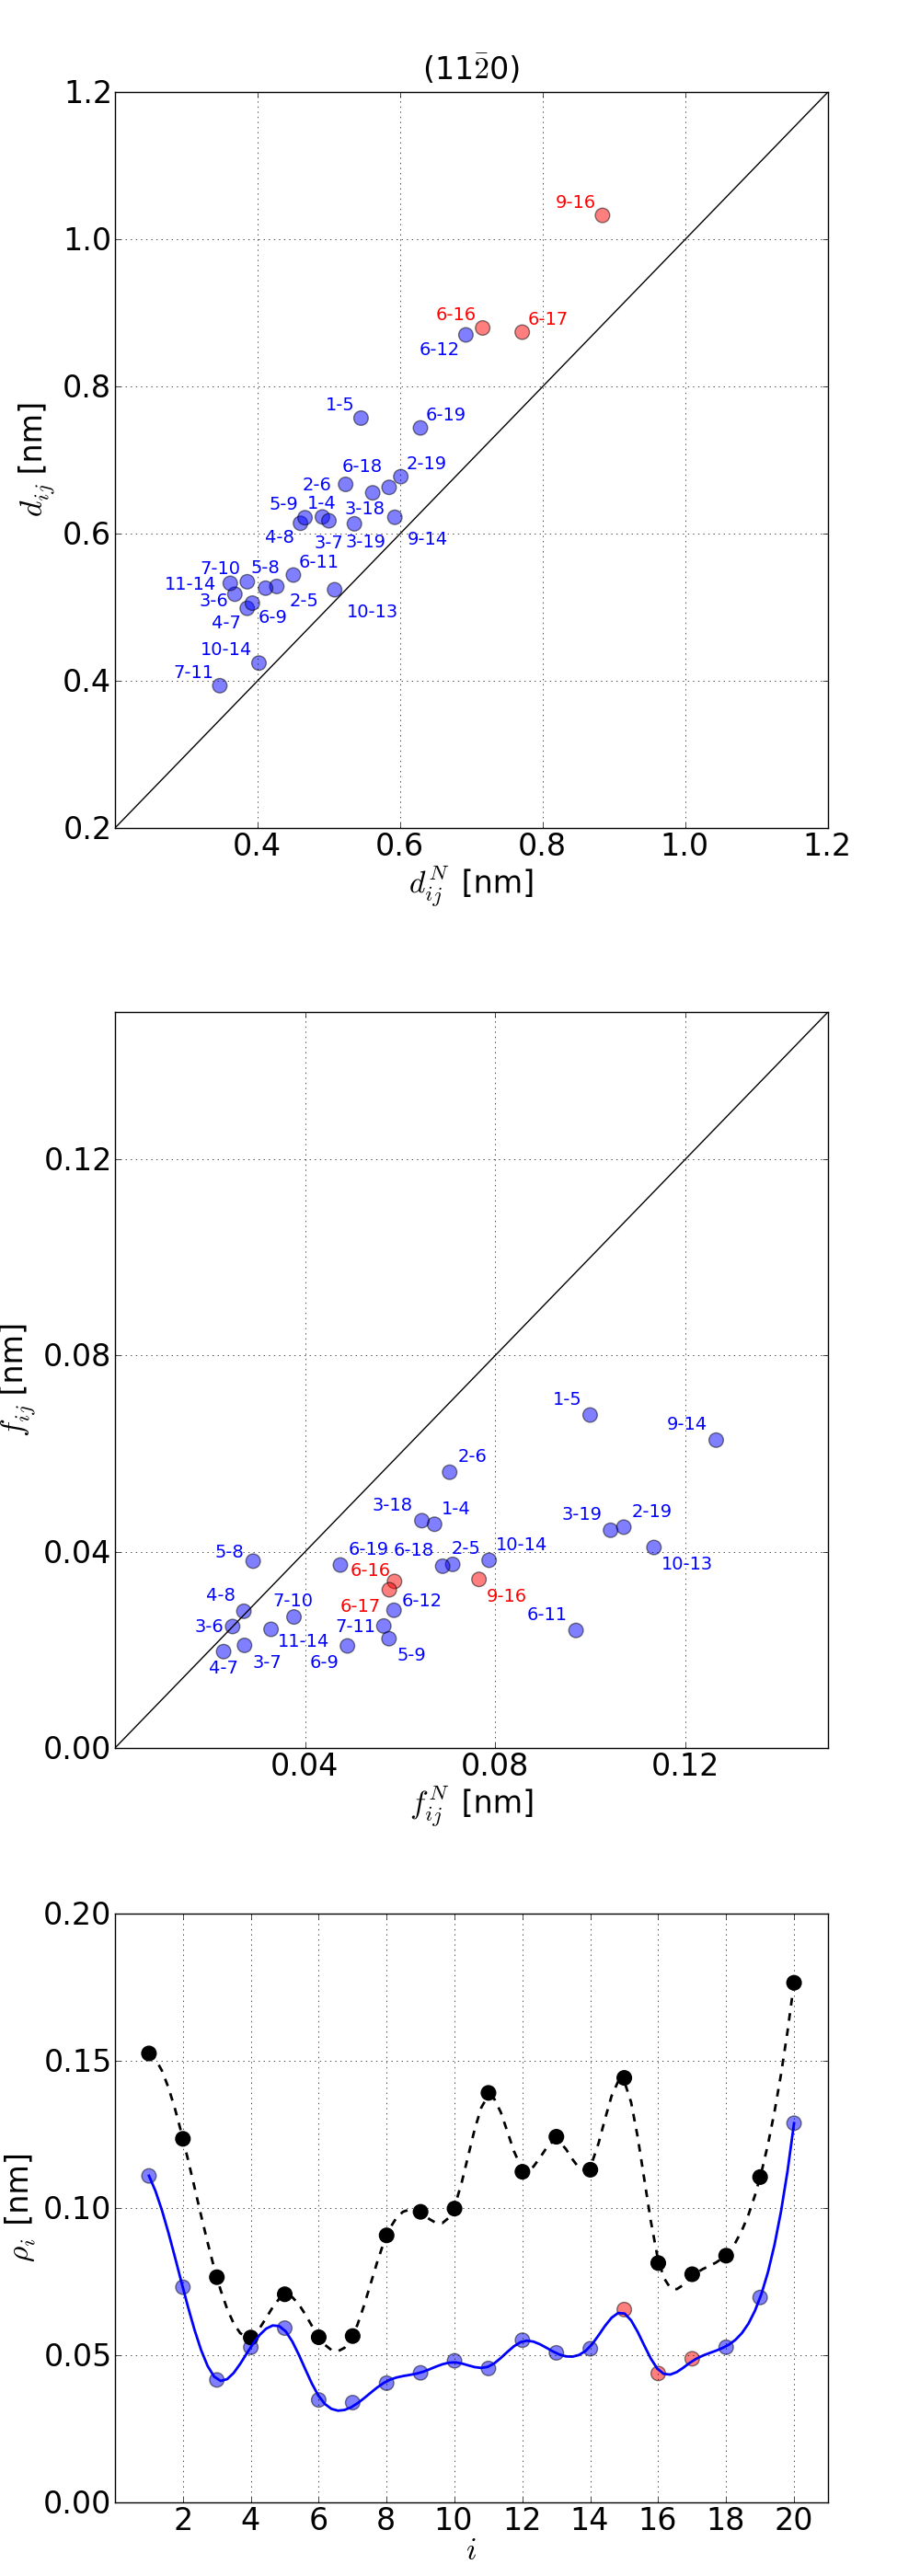
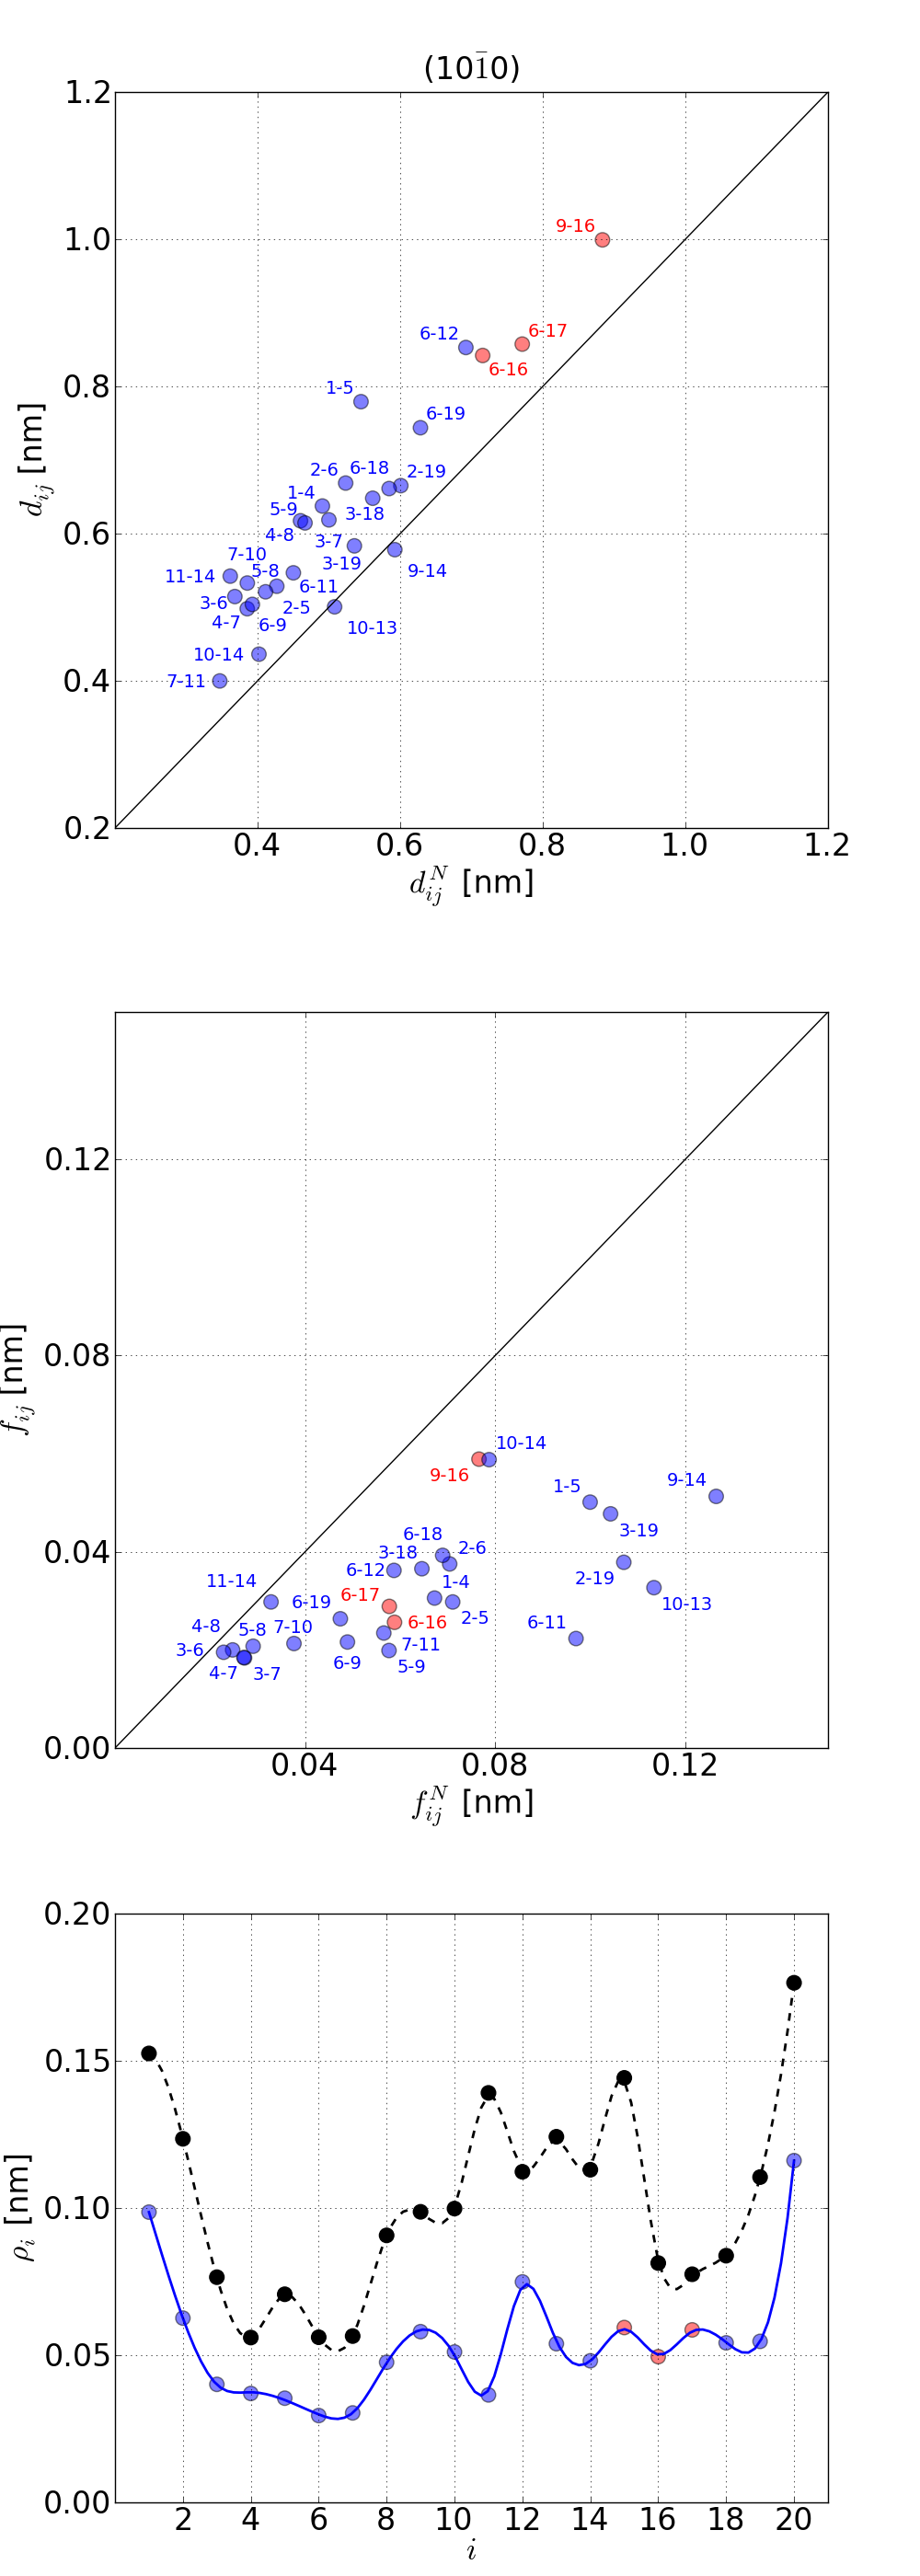
The bottom panel shows the conformation of the protein bound at 19 ns. Its radius of gyration, , is equal to (0.7060.007) nm, which is close to that in bulk water, (0.7270.014) nm, and yet the adsorbed conformation is seen to be deformed relative to the native state. The Cartesian components of are found to be equal to , , and for the , , and components respectively. Thus the surface-normal direction is the easiest to rotate about. The does not capture the distortion, but average distances, , between AAs do. This is shown in the top panel of Figure 6 where in the native contacts are plotted against their values in bulk water, . The native contacts are defined in a geometric fashion as in ref. 40 through the van der Waals volume of the heavy atoms, and as used dynamically in Go-like models 41, 42. A native contact between AAs and is declared to be present if their excluded volumes nearly overlap. We observe that all native contacts get longer by between 8 and 38%.
The second panel shows that also the rms fluctuations, in the are distinct from those, , corresponding to the . Most ’s are smaller than ’s, indicating formation of a more rigid structure. However, some of the contacts, like 1–4, fluctuate stronger. Another way to describe the fluctuational dynamics of a protein is through the RMSF - fluctuations in the location of a single AA (after subtracting translation of the CM and rotations) and denoted here by . The last panel in Figure 6 shows that s in the bound state are smaller than in bulk water. The suppresion in sites 15 through 17 is by a factor of about 1.3. Three other examples of adsorption intervals are analyzed in ESI. Each of them leads to different patterns in the fluctuations and different numbers of the AAs are involved in binding.
4 Discussion
In summary, we have studied aqueous solutions of AAs near rigid surfaces of ZnO by means of the MD simulations. The advantage of this approach over ab initio methods is that it brings in many of the ingredients that are important in the studies of adsorption: bigger systems, longer times scales, a possibility to consider many conformations and include motion of the molecules of water. We have found that the layered character of the density profile of water near the surfaces affects the adsorption process of AAs and is a crucial factor that determines the binding strength.
Unlike the situation in vacuum, the values of are found to depend sensitively on the precise identity of an amino acids. For instance, the two protonated forms of histidine (HID and HIP in Table 1) have distinct values of . This sensitivity stems from the fact that the side groups attempt to find an optimal conformation between the first two layers of water. The layer closer to the solid is nearly frozen and aligned by the electric field generated by the solid. It creates an electric field of its own through polarization and the side groups would tend to find an energy minimum in it. However, there is also the second layer and the residues also have to adjust to it. This second layer is mobile and its interplays with the side groups are transient. The second layer may repel or attract the residues. Consider the aromatic and hydrophobic phenylalanine above the (000)-Zn surface. The first layer of water here has the H atoms facing the solvent and forming an almost frozen grid of positive partial charges with an underlying but laterally shifted plane of negative (and twice as big) charges due to O. The second layer of water alignes the aromatic ring parallel to the hydrogenic grid underneath which brings the partial negative charges of the carbon atoms to the proximity of the grid. A binding occurs through a proper locking of all ring atoms into the nonuniform electric field. The binding is enhanced for tyrosine and tryptophan by also involving their polar groups. The positively charged histidine has a different ring. This ring is more tilted relative to the grid in the HIE form whereas it is nearly parallel in the HID form.
The optimal PMF energies for interactions of the AAs with ZnO are found to be: a) weaker in strength than hydrogen bonds in a protein (when all binding situations are considered, for all four surfaces, kJ mole-1), b) highly specific, and c) highly dependent on the selection of the surface. If one considers all binding situations on all four surfaces then the . This result implies that preparations of bio-sensing or bio-functionalized ZnO interfaces require uniformly ordered crystalline structures that are more costly to prepare.
We predict that a small protein, 1L2Y, should bind to ZnO only intermittently. It is possible that larger proteins, containing many binding AAs, may generate long lasting attachments because of more AAs participating in making the coupling and larger cancellation of the random forces exerted by the molecules of water further away from the surface that might induce detachment.
Analyzing larger proteins will be helped by using coarse grained models in which the PMFs derived here could be incorporated to describe interactions with ZnO. Modeling systems with other surfaces in a systematic way is important when considering applications in bio-sensing and bio-functionalization.
Acknowledgments Discussions with P. Cieplak, D. Elbaum, J. Grzyb, B. Różycki, and M. Sikora are appreciated as well as the help of S. Niewieczerzał with the GROMACS code. This work has been supported by he European Union within European Regional Development Fund, through Innovative Economy grant (POIG.01.01.02-00-008/08) and by the Polish National Science Centre Grant No. 2011/01/B/ST3/02190. The local computer resources were financed by the European Regional Development Fund under the Operational Programme Innovative Economy NanoFun POIG.02.02.00-00-025/09. We appreciate help of A. Koliński and A. Liwo in providing additional computer resources such as at the Academic Computer Center in Gdańsk.
References
- 1 V. Hlady and J. Buijs, Curr. Opin. Biotechnol., 1994, 7, 72-77.
- 2 J. J. Gray, Curr. Opin. Struc. Biol., 2004, 14, 110-115.
- 3 L. Feng and J. D. Andrade, J. Biomed. Mater. Res., 1994, 28, 735-743.
- 4 K. Nakanishi, T. Sakiyama and K. Imamura, J. Biosci. Bioengin., 2001, 91, 233-244.
- 5 I. Lynch and K. A. Dawson, Nanotoday, 2008, 3, 40-47.
- 6 C. A. Haynes and W. Norde, J. Coll. Interfa. Sci., 1995, 169, 313-328.
- 7 G. A. Somorjai, Introduction to Surface Chemistry and Catalysis, John Wiley & Sons, Inc, New York, USA, 1994.
- 8 S. R. Whaley, D. S. English, E. L. Hu, P. F. Barbara and A. M. Belcher, Nature, 2000, 405, 665-668.
- 9 M. Bachmann, K. Goede, A. G. Beck-Sickinger, M. Grundmann, A. Irback and W. Janke, Angew. Chem. Int. Ed., 2010, 49, 9530-9533.
- 10 V. A. Basiuk and T. Y. Gromovoy, Adsorption, 1996, 2, 145-152.
- 11 M. Hoefling, F. Iori, S. Corni and K. E. Gottschalk, Langmuir, 2010, 26, 8347-8351.
- 12 Z. L. Wang, J. Phys.: Condens. Matter, 2004, 16, R829-R858.
- 13 C. K. Thai, H. Dai, M. S. R. Sastry, M. Sarikaya, D. T. Schwartz and F. Baneyx, Biotech. and Bioeng., 2004, 87, 129-137.
- 14 M. Sarikaya, C. Tamerler, A. Jen, K. Shulten and F. Baneyx, Nature Mater., 2003, 2, 577-585.
- 15 Y. Wang and L. Chen, Nanomedicine, 2011, 7, 385-402.
- 16 B. Gu, C. Xu, C. Yang, S. Liu and M. Wang, Biosens. Bioelectron., 2011, 26, 2720-2723.
- 17 S. Yatsunenko, J. Kaszewski, E. Wolska, J. Grzyb, I. Pełech, B. Witkowski, M. M. Godlewski, E. Mijowska, U. Narkiewicz and M. Godlewski, J. Phys.: Cond. Matter, 2013 (in press).
- 18 J. Zhuang, M. Liu and H. B. Liu, Sci. China Ser. B, 2009, 52, 2125-2133.
- 19 T. Togashi, N. Yokoo, M. Umetsu, S. Ohara, T. Naka, S. Takami, H. Abe, I. Kumagai and T. Adschiri, J. Biosci. Bioeng., 2011, 111, 140-145.
- 20 M. M. Tomczak, M. K. Gupta, L. F. Drummy, S. M. Rozenzhak, and R. R. Naik, Acta Biomater., 2009, 5, 876-882.
- 21 Y. K. Gao, F. Traeger, O. Shekhah, H. Idriss and C. Woll, J. Coll. Interf. Sci., 2009, 338, 16-21.
- 22 M. Hoefling, F. Iori, S. Corni and K. E. Gottschalk, ChemPhysChem, 2010, 11, 1763-1767.
- 23 K. Kubiak and P. A. Mulheran, J. Phys. Chem. B, 2009, 113, 12189-12200.
- 24 A. Starzyk and M. Cieplak, J. Chem. Phys., 2011, 135, 235103.
- 25 S. Kumar, D. Bouzida, R. H. Swendsen, P. A. Kollman and J. M. Rosenberg, J. Comp. Chem., 1992, 13, 1011-1021.
- 26 S. H. Jochen, B. L. de Groot and D. van der Spoel, J. Chem. Th. Comp., 2010, 6, 3713-3720.
- 27 U. Rossler, Landolt-Bornstein, New Series, Group III, Springer, Heidelberg, 1999.
- 28 V. E. Henrich and P. A. Cox, The Surface Science of Metal Oxides., Cambridge University Press, Cambridge, 1994, 464.
- 29 C. Lamberti, A. Zecchina, E. Groppo and S. Bordiga, Chem. Soc. Rev., 2010, 39, 4951-5001.
- 30 R. B. Pandey, Zhifeng Kuang, B. L. Farmer, Steve S. Kim and Rajesh R. Naik, Soft Matter, 2012, 8, 9101-9109.
- 31 J. S. Hanas, J. L. Larabee and J. R. Hocker, Zinc Finger Proteins: From Atomic Contact to Cellular Function, Kluwer Academic/Plenum Publishers, New York, 2007, 39-46.
- 32 M. Cieplak, J. Koplik and J. R. Banavar, Phys. Rev. Lett., 2001, 86, 803-806.
- 33 M. Cieplak, J. Koplik and J. R. Banavar, Physica A, 1999, 274, 281-293.
- 34 J. Carrasco, A. Hodgson and A. Michaelides, Nature Mat., 2012, 11, 667-674.
- 35 J. Feng, R.B. Pandey, R.J. Berry, B.L. Farmer, R.R. Naik, and H. Heinz, Soft Matter, 2011, 7, 2113-2120.
- 36 F. Iori, R. Di Felice, E. Molinari and S. Corni, J. Comput. Chem., 2009, 30, 1465-1476.
- 37 S. Monti and T. R. Walsh, J. Phys. Chem. C, 2010, 114, 22197-22206.
- 38 N. Yokoo, T. Togashi, M. Umetsu, K. Tsumoto, T. Hattori, T. Nakanishi, S. Ohara, S. Takami, T. Naka, H. Abe, I. Kumagai and T. Adschiri, J. Phys. Chem. B, 2010, 114, 480-486.
- 39 E. E. Oren, C. Tamerler and M. Sarikaya, Nano Lett., 2005, 5, 415-419.
- 40 J. Tsai, R. Taylor, C. Chothia and M. Gerstein, J. Mol. Biol., 1999, 290, 253-266.
- 41 J. I. Sułkowska and M. Cieplak, J. Phys. Cond. Mat., 2007, 19, 283201.
- 42 M. Sikora, J. I. Sułkowska and M. Cieplak, PLoS Comp. Biol., 2009, 5, e1000547.
- 43 D. Van der Spoel, E. Lindahl, B. Hess, G. Groenhof, A. E. Mark and H. J. C. Berendsen, J. Comp. Chem., 2005, 26, 1701-1718.
- 44 Y. Duan, C. Wu, S. Chowdhury, M.C. Lee, G. Xiong, W. Zhang, R. Yang, P. Cieplak, R. Luo, T. Lee, J. Caldwell, J. Wang, and P. Kollman, J. Comp. Chem., 2003, 24, 1999-2012.
- 45 W. L. Jorgensen, J. Chandrasekhar, J. D. Madura, R. W. Impey and M. L. Klein, J. Chem. Phys., 1983, 79, 926-935.
- 46 D. Raymand, A. C. T. van Duin, M. Baudin and K. Hermannson, Surf. Sci., 2008, 602, 1020-1031.
- 47 U. Essmann, L. Perera, M. L. Berkowitz, T. Darden, H. Lee and L. G. Pedersen, J. Chem. Phys., 1995, 103, 8577-8592.
- 48 J. G. Kirkwood, J. Chem. Phys., 1935, 3, 300-313.
- 49 J. A. Lemkul and D. R. Bevan, J. Phys. Chem. B, 2010, 114, 1652-1660.
| ZnO | (100)v | (100) | (110) | (0001)-O | (000)-Zn |
|---|---|---|---|---|---|
| ASP | 192.14 | 0.72 | – | 1.10 | 3.91 |
| GLU | 197.33 | – | 0.42 | 1.03 | 2.56 |
| CYS | 167.27 | 1.04 | 0.59 | – | 3.07 |
| ASN | 170.38 | 4.17 | 2.31 | 0.27 | 4.12 |
| PHE | 110.16 | – | 0.27 | – | 1.99 |
| THR | 136.39 | – | – | – | 0.51 |
| TYR | 128.26 | 0.17 | 2.00 | – | 7.01 |
| GLN | 160.66 | – | 1.01 | 0.48 | – |
| SER | 140.36 | 0.63 | 1.68 | 0.48 | 0.97 |
| MET | 123.53 | – | 2.19 | 0.25 | 0.77 |
| TRP | 165.73 | 3.08 | 0.17 | – | 4.78 |
| VAL | 135.23 | 0.16 | 1.02 | 0.31 | 1.39 |
| LEU | 142.16 | 0.19 | – | – | 1.28 |
| ILE | 126.54 | – | – | – | 2.80 |
| GLY | 116.24 | 2.57 | 0.29 | – | 2.08 |
| ALA | 110.98 | – | 1.06 | 0.25 | 2.91 |
| PRO | 121.15 | 0.70 | 0.66 | 0.64 | 2.72 |
| HIE | 194.74 | – | – | – | 0.52 |
| HID | 202.98 | 0.74 | 1.56 | – | 3.19 |
| HIP | 181.40 | 4.47 | 2.28 | – | 1.34 |
| LYS | 169.68 | – | – | 1.78 | 0.74 |
| ARG | 126.46 | – | 2.70 | – | 4.14 |
| average | 146.68 | 0.76 | 0.88 | 0.33 | 2.47 |
| dispersion | 27.41 | 1.17 | 0.86 | 0.47 | 1.67 |
| ZnO | (100)v | (100) | (110) | (0001)-O | (000)-Zn |
|---|---|---|---|---|---|
| average | 146.68 | 1.46 | 1.22 | 0.66 | 2.60 |
| dispersion in | 27.41 | 1.33 | 0.81 | 0.48 | 1.61 |
| average | 0.28 | 0.67 | 0.65 | 0.84 | 0.56 |
| dispersion in | 0.02 | 0.19 | 0.13 | 0.15 | 0.05 |
Electronic Supplementary Information
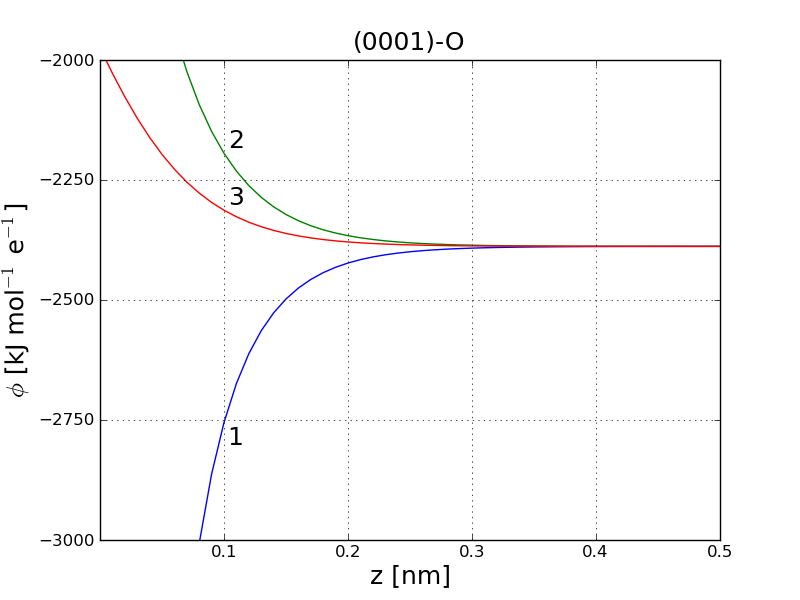
Electrostatic potential near ZnO surfaces
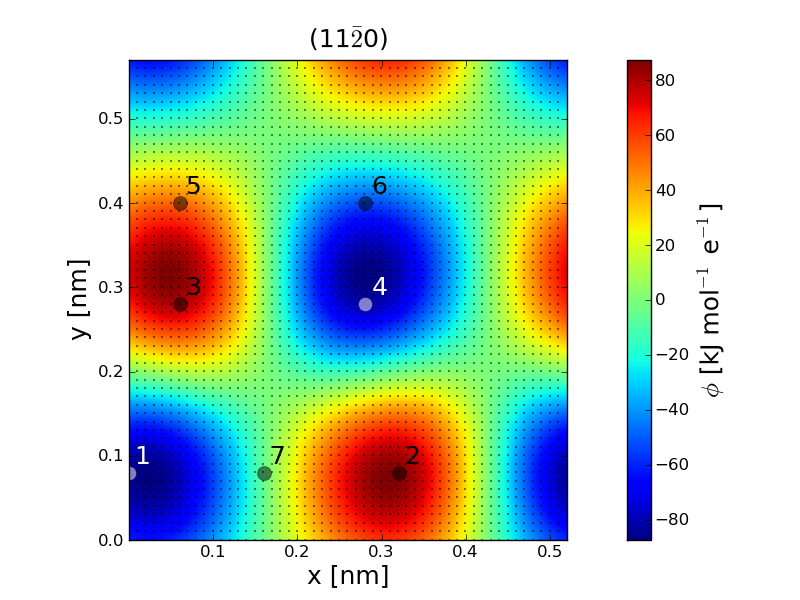
The simulations described in the paper can be performed in two equivalent ways. One is to introduce a cutoff in all Coulombic interactions and then using the periodic boundary conditions with the particle mesh Ewald summation 1. The other is to treat the static electric field of the semi-infinite solid as external to the molecular interactions and then use the Ewald summation only for the ”internal” interactions. Here, we discuss the properties of the electrostatic potential, , generated by ZnO that could be used in the second way. The potential is non-uniform very near the surface but it becomes practically uniform at a sufficiently large elevation. It is interesting to find out how does the transition between the two regimes take places.
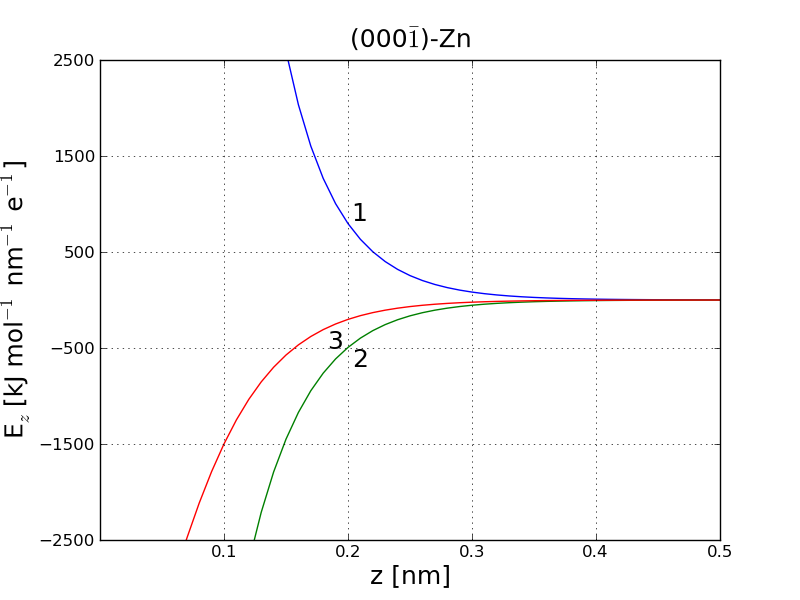
We construct the surfaces by making planar cuts in the bulk solid generated by translating the unit cell. The potential is determined at sites on a grid spaced by 0.01 nm extending 5 nm above and 0.5 nm below the surface. The solid is represented by a slab of layers of the unit cells. For every grid point, we consider a vertical cylinder with radius and the axis going through the grid point. The cylinder contains an integer number of the unit cells so its sides are rough. The atoms within this cylinder contribute to the Coulombic sum , where is the distance from the grid site to the ’th atom, is its charge and =138.935485 kJ mol-1 nm is the conversion factor. The effective charges are -1.026 and 1.026 for the O and Zn atoms respectively, as obtained through the Mulliken analysis 2. The sums are calculated for a set of values of up to 500 nm and then extrapolated to an infinite by fitting to ( is another fitting constant) – see Figure 7 for =0.2 nm and ==0.0, i.e. at the O atom. The values of are stored. The electric field is obtained through discretized differentiation. For instance, its -component is given by . The values of and away from the grid points can be obtained through interpolation involving the 8 nearest grid nodes.
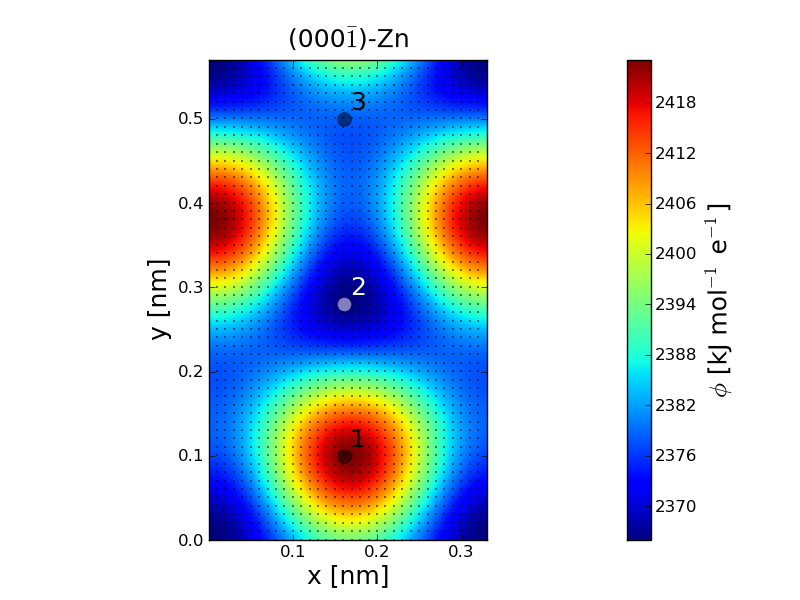
The electrostatic potential due to the surface has a lateral structure that depends on . Above 0.4 nm the electric field becomes uniform and close to zero for each surface. Modulations in the density of water persist above 0.4 nm as they are induced by the field at lower elevations. It is sufficient to take two layers of cells in the slab – the slab is about 0.5 nm wide. Combining, say, 10 slabs one atop another either does not change the or, in the case of the polar surfaces, merely adds a constant.
An alternative way to determine is by considering larger and larger spheres of radius (up to 1 m) that are cut out in the bulk solid and are centered at the grid point. The spheres contain same numbers of the Zn and O atoms, but fractional numbers of unit cells. Therefore, the nature of the net polarization keeps oscillating which results in the oscillatory nature of the potential. Extrapolation to an infinite sphere is, however, consistent with the slab results (see Figure 7).
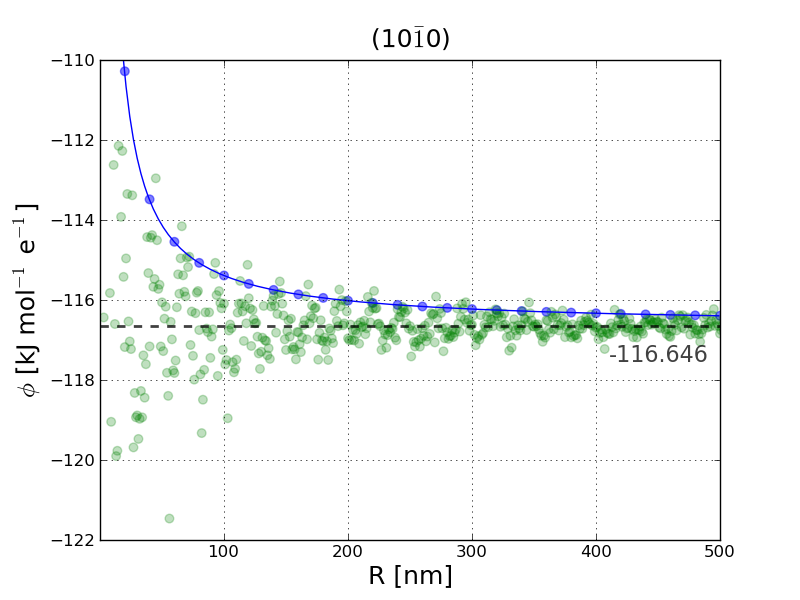
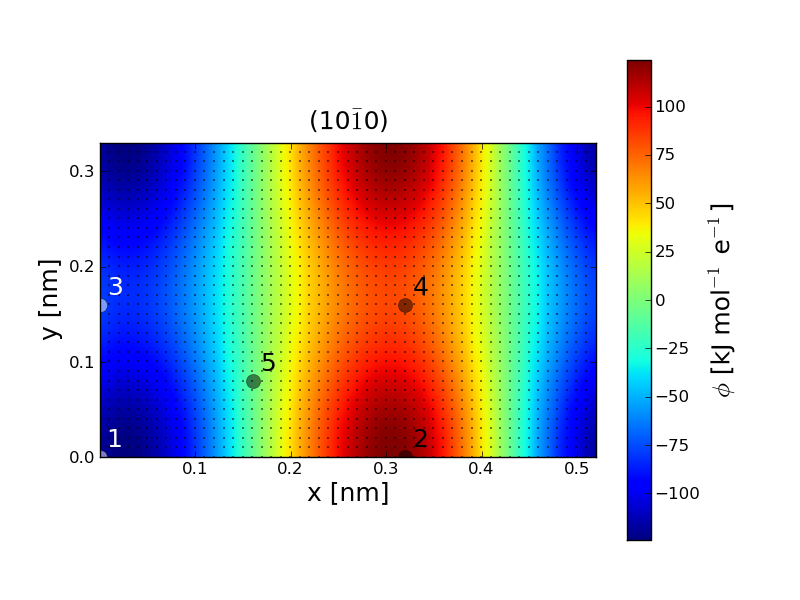
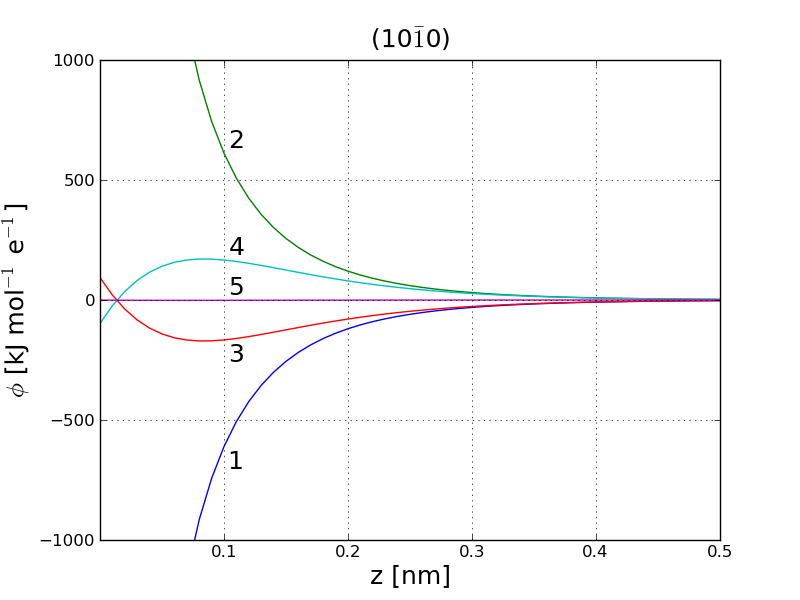
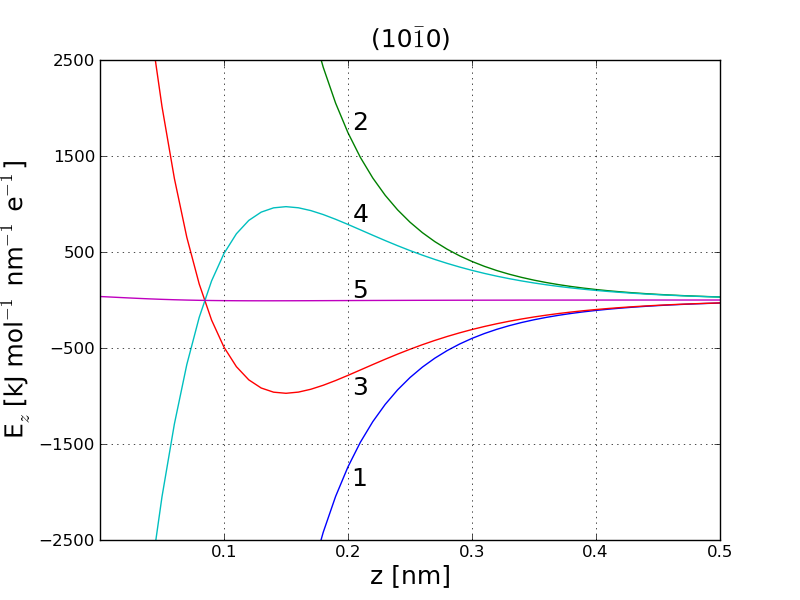
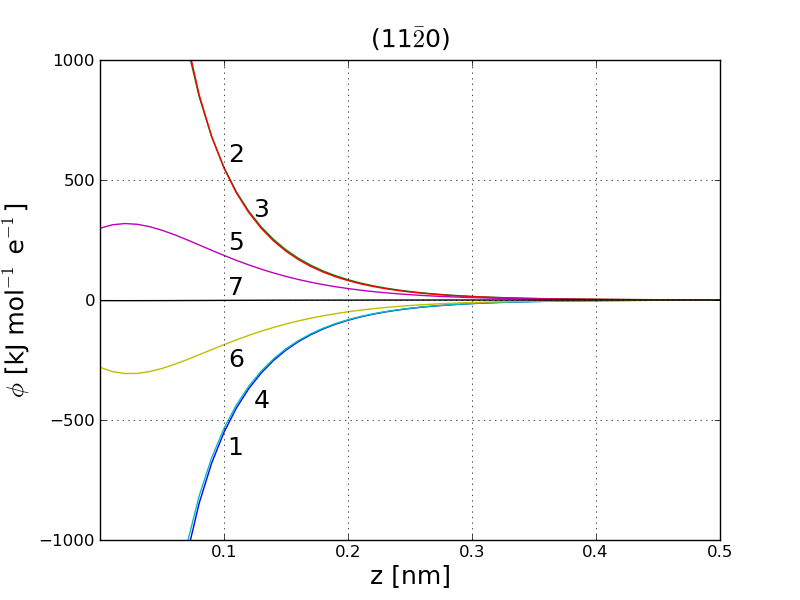
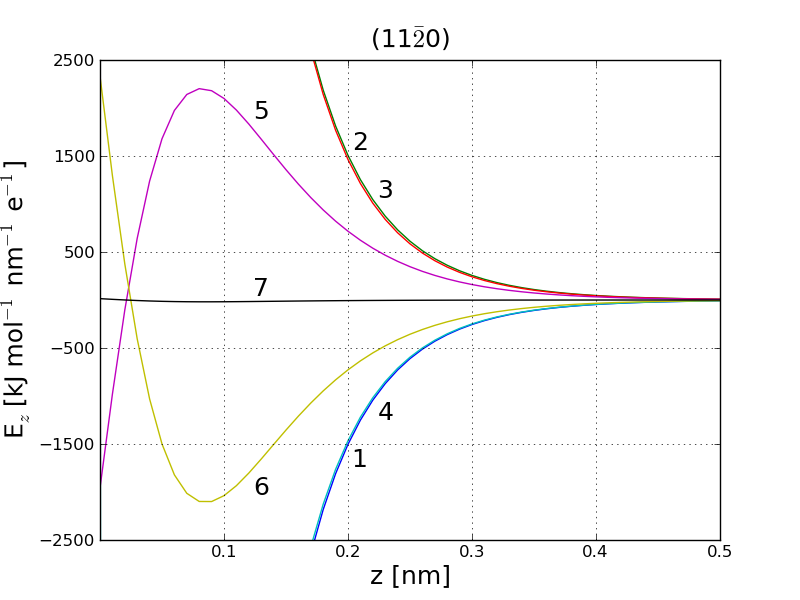
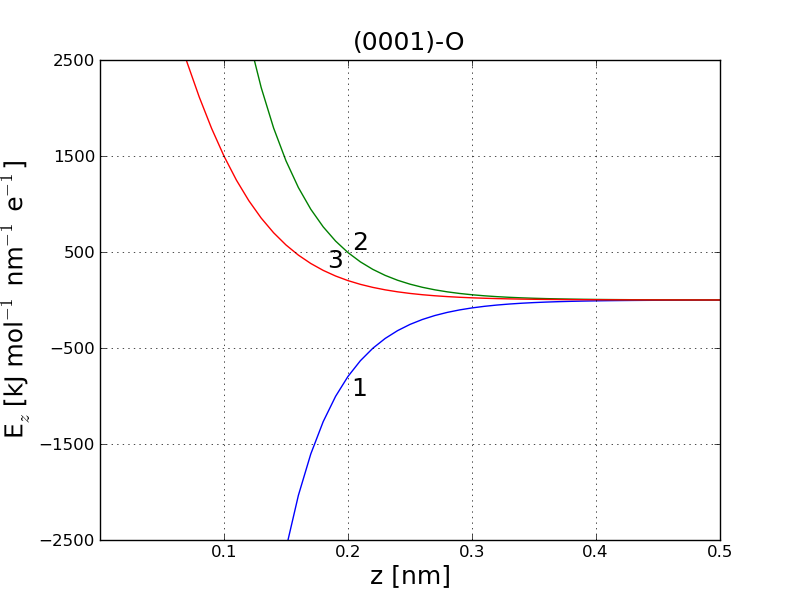
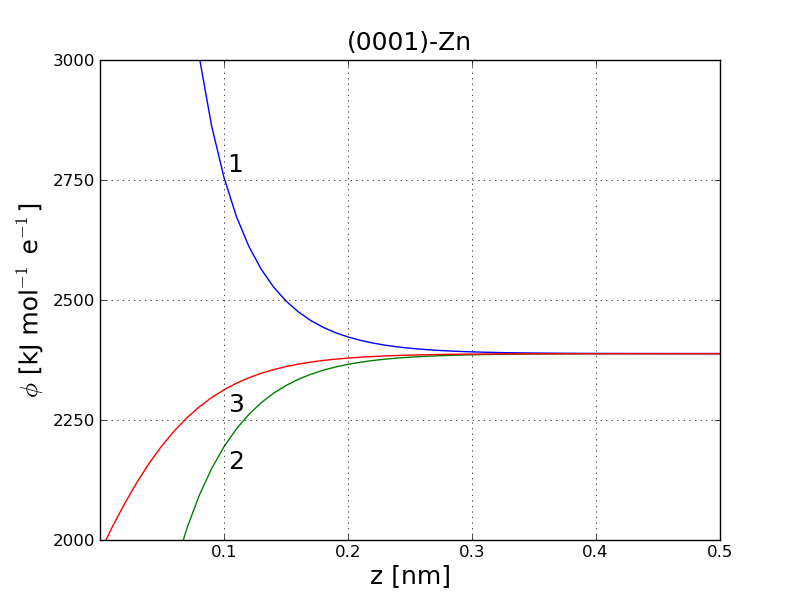
Figure 8 shows in the plane at =0.2 nm above the () surface of ZnO. Figure 9 shows as a function of for selected locations (1 through 5) that are indicated in Figure 7. For instance, 1 is at the origin, i.e. above the O atom. 2 is above the Zn atom. 3 and 4 are above O and Zn atoms as for sites 1 and 2, but these atoms are located deeper – under the top plane of the surface. 5 is in the middle. Figure 10 shows the corresponding values of the -component of the electric field.
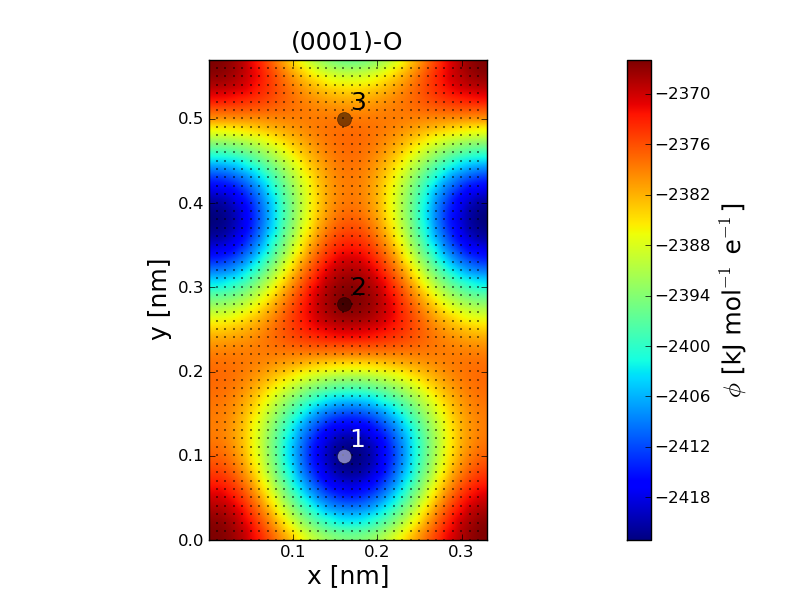
The next three figures, 11, 12 and 13, are similar but they refer to surface 110. Figures 14, 15, and 16 refer to the polar surface (0001-O) and figures 17, 18, and 19 to the polar surface (000-Zn).
References
- 1 U. Essmann, L. Perera, M. L. Berkowitz, T. Darden, H. Lee and L. G. Pedersen, J. Chem. Phys., 1995, 103, 8577-8592.
- 2 D. Raymand, A. C. T. van Duin, M. Baudin and K. Hermannson, Surf. Sci., 2008, 602, 1020-1031.
- 3 M. Hoefling, F. Iori, S. Corni and K. E. Gottschalk, Langmuir, 2010, 26, 8347-8351.
Structure of water at the solid-water interface
Figure 20 shows snapshots of the solid-water interface that illustrate the architecture of the solid and the nature of layering of water molecules for the four surfaces and at various projections. Figure 21 shows the time averaged profile of the number density of water molecules near ZnO(100), as taken from Figure 3 in the main paper, and compares it to the profile near Au(111). The profiles are normalized so that the bulk value corresponds to 1.
The umbrella sampling method
Summary of the results on the binding parameters
Table 1 provides an expanded version of Table 1 in the main text. In addition to items listed there it also gives values of the parameter for individual amino acids.
| ZnO | (100)v | (100) | (110) | (0001)-O | (000)-Zn | |||||
|---|---|---|---|---|---|---|---|---|---|---|
| ASP | 0.29 | 192.14 | 0.55 | 0.72 | – | – | 0.56 | 1.10 | 0.44 | 3.91 |
| GLU | 0.28 | 197.33 | – | – | 0.91 | 0.42 | 0.61 | 1.03 | 0.52 | 2.56 |
| CYS | 0.28 | 167.27 | 0.51 | 1.04 | 0.88 | 0.59 | – | – | 0.56 | 3.07 |
| ASN | 0.23 | 170.38 | 0.54 | 4.17 | 0.59 | 2.31 | 0.87 | 0.27 | 0.58 | 4.12 |
| PHE | 0.29 | 110.16 | – | – | 0.92 | 0.27 | – | – | 0.55 | 1.99 |
| THR | 0.31 | 136.39 | – | – | – | – | – | – | 0.58 | 0.51 |
| TYR | 0.29 | 128.26 | 0.90 | 0.17 | 0.63 | 2.00 | – | – | 0.54 | 7.01 |
| GLN | 0.27 | 160.66 | – | – | 0.63 | 1.01 | 0.95 | 0.48 | – | – |
| SER | 0.28 | 140.36 | 0.49 | 0.63 | 0.53 | 1.68 | 0.87 | 0.48 | 0.55 | 0.97 |
| MET | 0.26 | 123.53 | – | – | 0.55 | 2.19 | 0.89 | 0.25 | 0.54 | 0.77 |
| TRP | 0.33 | 165.73 | 0.63 | 3.08 | 0.61 | 0.17 | – | – | 0.53 | 4.78 |
| VAL | 0.27 | 135.23 | 1.01 | 0.16 | 0.56 | 1.02 | 0.91 | 0.31 | 0.65 | 1.39 |
| LEU | 0.29 | 142.16 | 0.86 | 0.19 | – | – | – | – | 0.64 | 1.28 |
| ILE | 0.31 | 126.54 | – | – | – | – | – | – | 0.61 | 2.80 |
| GLY | 0.31 | 116.24 | 0.47 | 2.57 | 0.53 | 0.29 | – | – | 0.50 | 2.08 |
| ALA | 0.27 | 110.98 | – | – | 0.54 | 1.06 | 0.99 | 0.25 | 0.54 | 2.91 |
| PRO | 0.31 | 121.15 | 0.88 | 0.70 | 0.63 | 0.66 | 1.00 | 0.64 | 0.57 | 2.72 |
| HIE | 0.27 | 194.74 | – | – | – | – | – | – | 0.56 | 0.52 |
| HID | 0.23 | 202.98 | 0.51 | 0.74 | 0.55 | 1.56 | – | – | 0.56 | 3.19 |
| HIP | 0.27 | 181.40 | 0.50 | 4.47 | 0.58 | 2.28 | – | – | 0.89 | 1.34 |
| LYS | 0.27 | 169.68 | – | – | – | – | 0.74 | 1.78 | 0.56 | 0.74 |
| ARG | 0.26 | 126.46 | – | – | 0.64 | 2.70 | – | – | 0.51 | 4.14 |
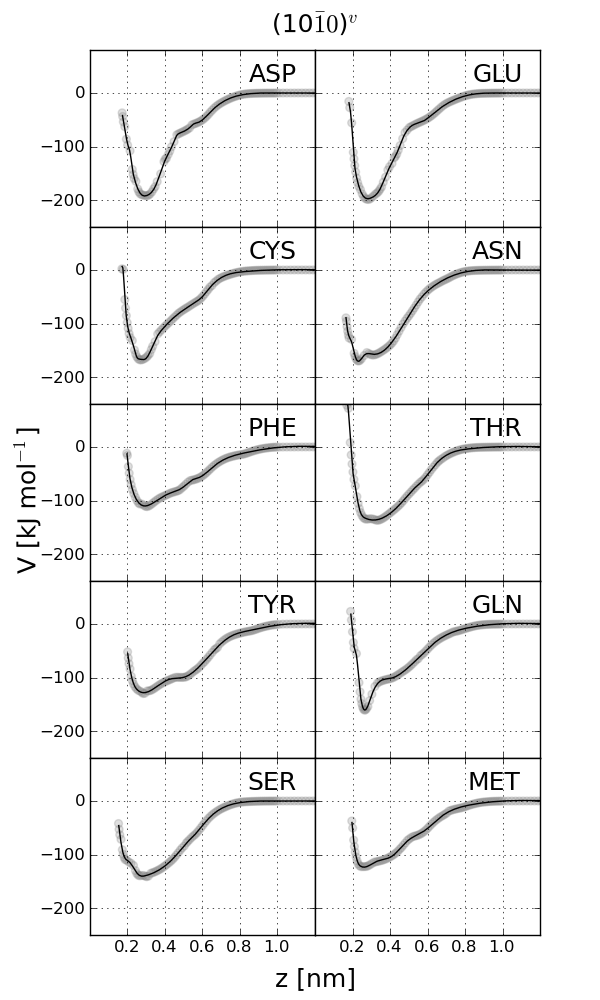
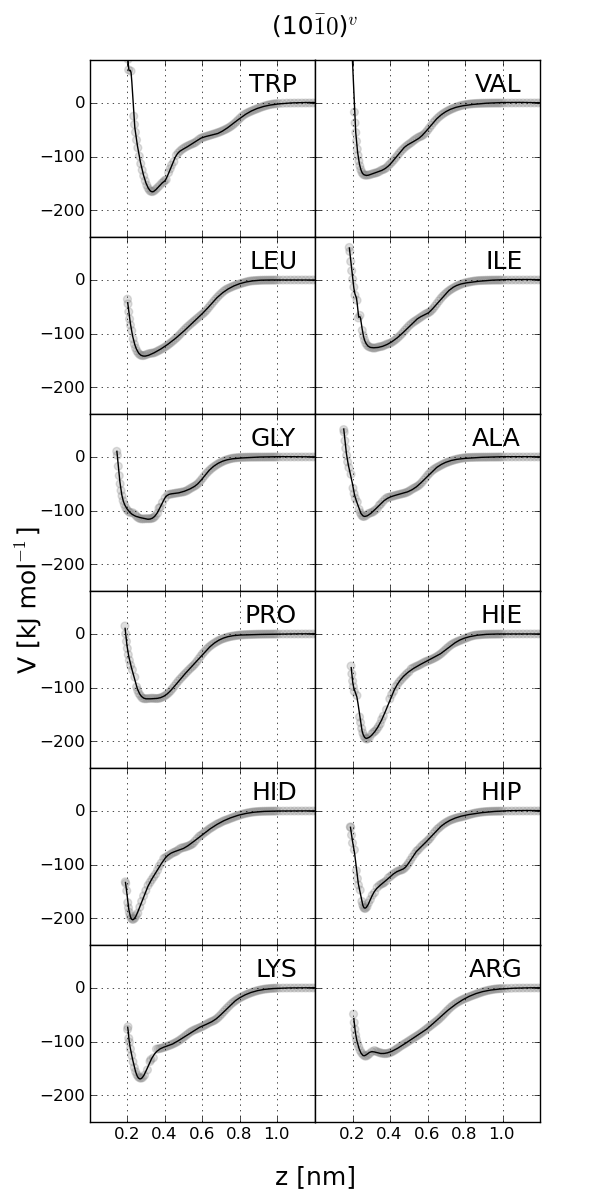
Potential of the mean force at the ZnO interface in vacuum
Here, we provide plots of the PMF obtained by the umbrella sampling simulations for AAs above the in vacuum – Figures 23 through 32. The binding energy varies across the AAs between 100 and 200 kJ/mol (Table I in the main text and Table 1 here). The average bond length is about 0.28 nm.
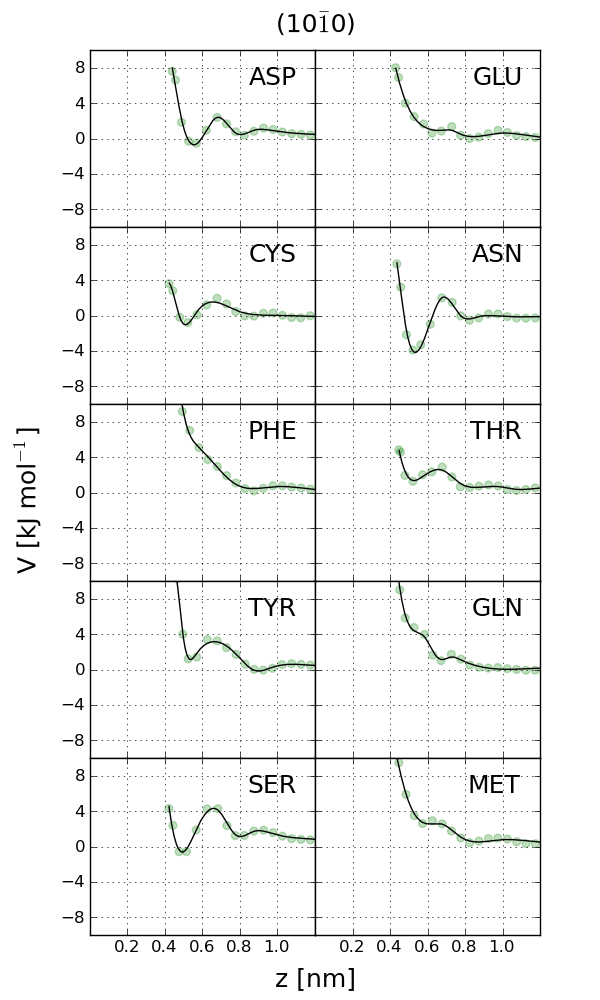
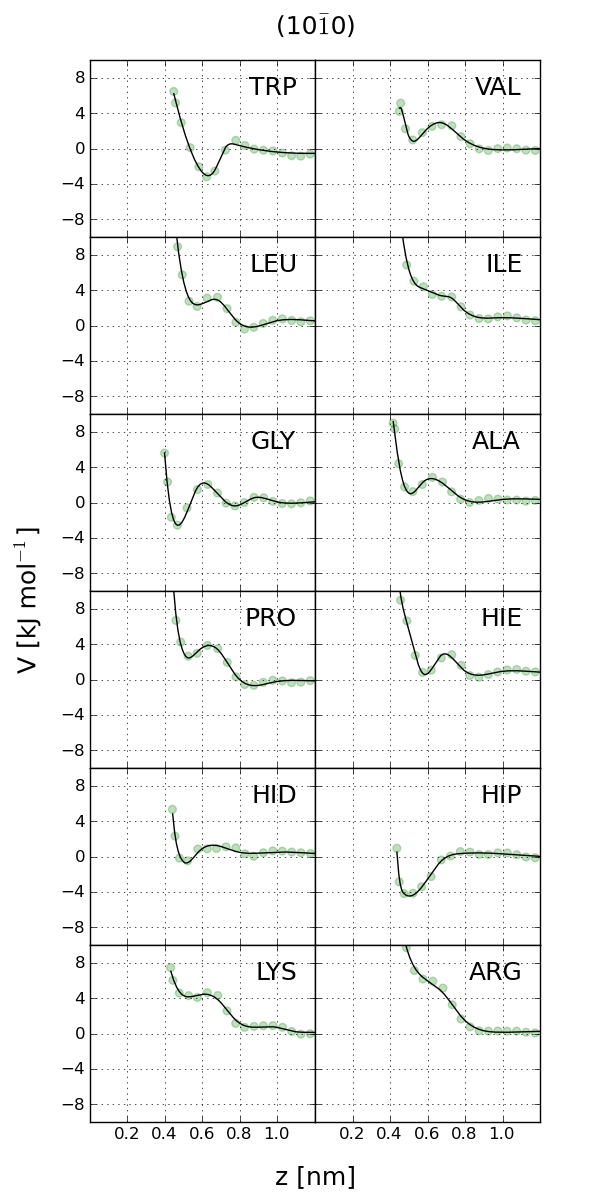
Potential of the mean force at the ZnO interfaces in water Here, we provide plots of the PMF obtained by the umbrella sampling simulations for AAs in water – Figures 25, and 26. The binding energies are listed in Table I in the main text and Table 1 here.
Protein 1L2Y at the ZnO surfaces
The following double sets of triple panels provide an analysis of the behavior of 1L2Y during three examples of adsorption events in analogy to Figures 5 and 6 in the main text. We consider events in which at least one atom of the protein is closer than 0.5 nm to the surface for at least 1 ns.