The Brightest Cluster Galaxy in Abell 85: The Largest Core Known so far
Abstract
We have found that the brightest cluster galaxy (BCG) in Abell 85, Holm 15A (catalog A85-BCG), displays the largest core so far known. Its cusp radius, kpc (), is more than 18 times larger than the mean for BCGs, and kpc larger than A2261-BCG (catalog ), hitherto the largest-cored BCG (Postman et al., 2012). Holm 15A hosts the luminous amorphous radio source 0039-095B and has the optical signature of a LINER. Scaling laws indicate that this core could host a supermassive black hole (SMBH) of mass . We suggest that cores this large represent a relatively short phase in the evolution of BCGs, whereas the masses of their associated SBMH might be set by initial conditions.
1 Introduction
We have been aware of the enormous core of Holm 15A (Holmberg, 1937), the brightest cluster galaxy (BCG) in Abell 85, for over thirty years. Hoessel (1980) fitted a modified Hubble law to its surface-brightness profile, and reported a core radius (i.e., the radius where the surface brightness reaches half of its central value) , which corresponds to a physical size kpc at Abell 85’s restframe (; combined redshift, data taken from the literature and our analysis of data from SDSS DR9; Ahn et al., 2012). Extended +[N II] and [O III] emission was reported by Hu et al. (1985) and Fisher et al. (1995). Brown (1997) using LOCOS data (López-Cruz, 1997) found that Holm 15A has a large core. Although Faber et al. (1997) had already suggested the presence of cores in galaxies brighter than mag, establishing the core-cusp dichotomy, this was largely overlooked due, in part, to the lack of resolution that had hampered most BCG studies, and the additional complication of using different parameterizations. As a result, Holm 15A has remained a curiosity.
Before the distribution of cores was established (e.g., Laine et al., 2003; Lauer et al., 2007), Faber et al. (1997) had advanced the idea that large cores were a manifestation of SMBH binaries. Although, we are still unclear about details such as BH merging times, hardening, and the so-called “final parsec problem” (e.g., Khan et al., 2013), the view that cores are expanded by the “scouring” action of SMBH over galactic cusps has gained wide acceptance (e.g., Merritt, 2006; Kormendy & Ho, 2013). Nevertheless, there are alternative scenarios, for example, scalar-field dark matter (e.g., Robles & Matos, 2012), in which cores are formed without secondary mechanisms.
Añorve (2012) and Añorve & López-Cruz (2014, in preparation) have conducted a comprehensive study of the structure of galaxies using LOCOS clusters at , using the Driver for GALFIT on Cluster Galaxies (DGCG, Añorve, 2012), a Perl script for GALFIT (Peng et al., 2010) that accounts for the effects of crowding and point spread function (PSF) variations. DGCG allows the 2-D modeling (bulge+disk) of the surface-brightness distribution for cluster galaxies. Holm 15A was one of the few galaxies for which our DGCG analysis did not converge. This prompted us to perform the more detailed study that we report in this Letter.
2 Observations
2.1 Optical Observations
We work from a LOCOS image of Holm 15A. This image was taken under good weather conditions with an average seeing (pixel scale ). To supplement our results, we looked for higher-resolution images. We failed to find HST images. However, Abell 85 is part of the ongoing Multi-Epoch Nearby Cluster Survey (MENeaCS, Sand et al., 2011), from which we selected an image with 120-s integration in the SDSS band, taken with the CFHT 3.5m-telescope and MegaCam (see Table 1).
The LOCOS image was reduced with IRAF, according to standard reduction procedures (e.g., López-Cruz et al., 2004). The MENeaCS were processed using the Elixir pipeline (Sand et al., 2011). Optical spectra from SDSS DR9 were used to determine cluster membership, galaxy and cluster velocity dispersions, and line ratios.
2.1.1 Photometry
The Nuker law, introduced by Lauer et al. (1995), is a “broken” power law given by
| (1) |
where is the power index of the inner cusp, is that of the envelope, is that at the “break radius” , the radius of maximum curvature in space, and is the intensity at the break radius. has been used as a scale indicator, but the “cusp radius” , the radius where , correlates better with other galaxy properties (e.g., Carollo et al., 1997; Lauer et al., 2007).
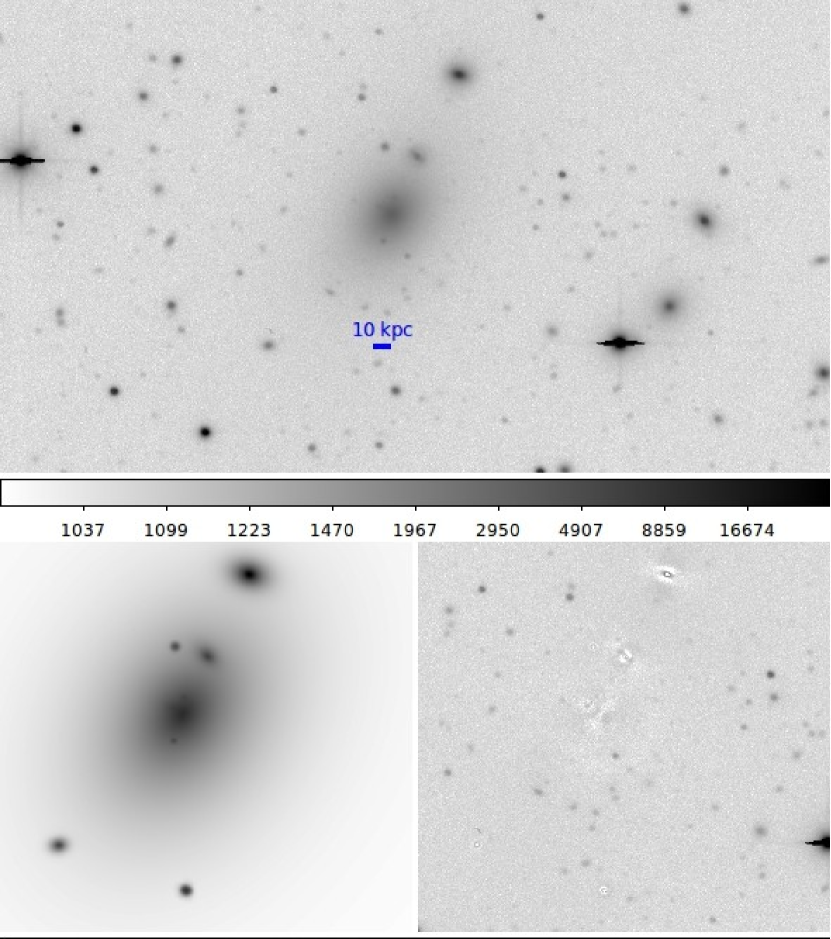
GALFIT was used to fit Holm 015A with an elliptical generalization of Eq. 1 including centroid, axis ratio, and position angle (i.e., nine free parameters in total), simultaneously with single-Sérsic fits to eight neighboring galaxies. The input parameters for those eight galaxies were taken from a DGCG run over the whole LOCOS image. The star SDSS J004159.70-091937.3 ( mag) from the center of Holm 15A was selected to generate the local PSF for Holm 15A. GALFIT proceeds by convolving a local PSF with the model component on a pixel center and minimizes against the galaxy of interest data (see Ravindranath et al., 2001; Peng et al., 2010, for details). The sky background was modeled without including gradients. In simulated data it has been found that fitting neighboring bright objects simultaneously with the galaxy of interest gives more accurate results than simple pixel masking (e.g., Häussler et al., 2007, Añorve & López-Cruz 2014). Since the background is the most important source of uncertainty in surface brightness modeling, we carefully investigated how our model parameters depend on the background level, using the combination of one to five Sérsic models to remove the light of Holm 15A with other objects masked. For each (fixed) value of the background, a new fit to (1) was generated. This allowed us to make a realistic assessment of the errors for each fitted parameter (cf., Huang et al., 2013). The results are given in Table 1. The large core size of Holm 15A, , and its low redshift allow accurate parameter estimates even under the modest seeing conditions of the LOCOS frame: the value of is more than ten times larger than the seeing FWHM. The original LOCOS image, the model, and the residual are shown in Fig. 1.
We confirmed our result using the MENeaCS image. The fitting strategy was the same as for the LOCOS, except that we found a slight background gradient, and did not perform such a detailed error analysis. Despite differences in telescope size, CCD format, pixel resolution, seeing, waveband, etc., the resulting parameter set (Table 1, second row) agrees well with the LOCOS result. The agreement of the fitted values of and is noticeable. The inner slope of Holm 15A is flat (, see Table. 1) but in less luminous galaxies tends to be larger (e.g., Ravindranath et al., 2001, who applied GALFIT to large sample of early type galaxies (ETG)). We note that the value of the outer slope , found from either fit is the largest ever reported — compare the mean and maximum of and in Laine et al. (2003).
We used the IRAF ellipse package on the LOCOS image to derive a 1D surface brightness profile of Holm 15A (blue points with errors in Figure 2). We worked on a deconvolved image (the PSF was generated using neighboring stars) generated using STSDAS Maximum Entropy Method (MEM) inversion, with errors calculated by applying ellipse to 50 simulated images, where the background was randomly varied , pixel-by-pixel. We compared deconvolved images using MEM and the Richarson-Lucy approach (e.g., PL12), we found negligible differences. From this 1D profile we can determine and directly using their definitions (given above). These non-parametric (np) estimates are and , these agree to better than one pixel with the results in Table 1. To compare the results from 1D and 2D surface brightness modeling, we use the parameters resulting after the GALFIT Nuker Law fit to Holm 15A, whose parameters are given in Table 1 (first row). The resulting profile (red continuous line in Fig. 2) closely matches the blue dots, indicating excellent agreement between 1D and 2D modeling. We conclude that the core scale is reliably measured by either a parametric or non-parametric approach.
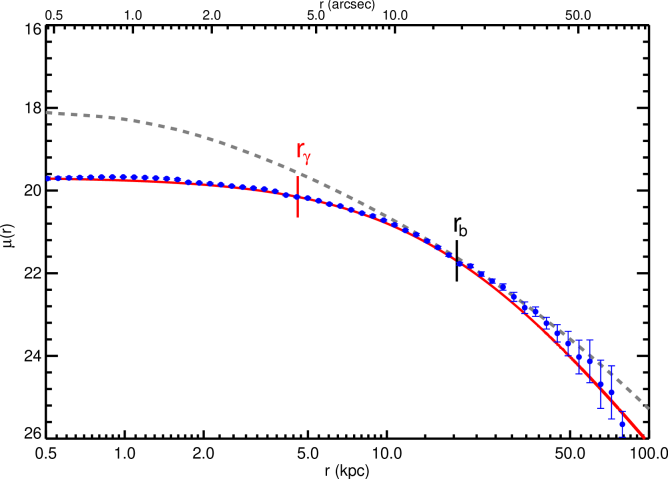
The total stellar light in Holm 15A was modeled by the sum of two Sérsic profiles. We obtained a total absolute magnitude (cf., Donzelli et al., 2011), where we have assumed , as is typical for giant early ETG. We attempted to fit a de Vaucouleurs profile (dVP) to the LOCOS image (using GALFIT) and the 1D profile. This function rises too steeply at small radii and gives large residuals inside (Fig. 2). We estimate the missing light in this fit by comparing the dVP integrated magnitude , where the errors are estimated by comparing the 1D and 2D dVP fits to Holm 15A, with the value of (an approach similar to that advocated by Kormendy & Ho, 2013). Hence, the approximate luminosity missing at relative to the dVP is . Missing light has been found to correlate with SMBH mass (e.g., Kormendy & Bender, 2009; Kormendy & Ho, 2013)
2.1.2 Spectroscopy
By applying Fourier Quotient and Cross-Correlation methods, and the synthesis code STARLIGHT (Cid Fernandes et al., 2005), on the SDSS DR9 spectrum of Holm 15A we obtain velocity dispersions of and . While SDSS DR9 reports a velocity dispersion of , Fisher et al. (1995) reported and a slight velocity gradient. Based on these values, our best estimate for the velocity dispersion is , or about less than the velocity dispersion of A2261-BCG (, PL12).
SDSS DR9 reports coordinates for the 3-arcsec diameter fiber on Holm 15A. We used this to search for lines associated with AGN activity, by correcting for extinction, removing stellar continuum using STARLIGHT (as in Torres-Papaqui et al., 2012), and fitting Gaussian line profiles. We found line ratios
with mean errors of about (Coziol et al., 2011).
2.2 Infrared Data
We used a 2MASS image to determine the integrated infrared luminosity of Holm 15A. Using elliptical apertures we determined a total (asymptotic) magnitude (cf., Skrutskie et al., 2006), so that mag and . We find for Holm 015A, this color falls within the expected range for luminous ETG (e.g., Kormendy & Ho, 2013, supplemental material), and hence no correction is needed to the standard 2MASS photometry.
2.3 Radio and X-ray Observations
The radio field of Abell 85 is complicated, but our analysis of archival VLA datasets clearly distinguishes radio emission from Holm 15A from other radio components associated with 0039-095B (catalog ) (Owen et al., 1984), and the radio structure associated with the cluster merger (Slee et al., 2001). Using the AR286 dataset (from 1992 December), which provides the best angular resolution available, we find a compact (0.39 arcsec major axis) radio source with peak flux density and integrated flux density at associated with the core of Holm 15A. This component of an overall 6.5-mJy source, about 5 arcsec in size, appears to be extended along a direction parallel to the major axis of the galaxy. The 8.4-GHz structure at the centre of the galaxy lies within a diffuse structure arcsec in size at 1.4 GHz, with an NVSS flux density (Condon et al., 1998). Adopting a spectral index (Burns, 1990), we obtain a radio power for 0039-095B.
We analyzed Chandra archival data (OBSID 904) using CIAO analysis task wavdetect, and found no X-ray point source near the center of Holm 15A. However, there is a compact X-ray source, which appears extended although with a bright center, associated with the position of SDSS J004150.75-091824.3 (catalog ) (hereafter J004150). This source, (), from the center of Holm 15A, is a quasar candidate with (Richards et al., 2009).
3 Discussion
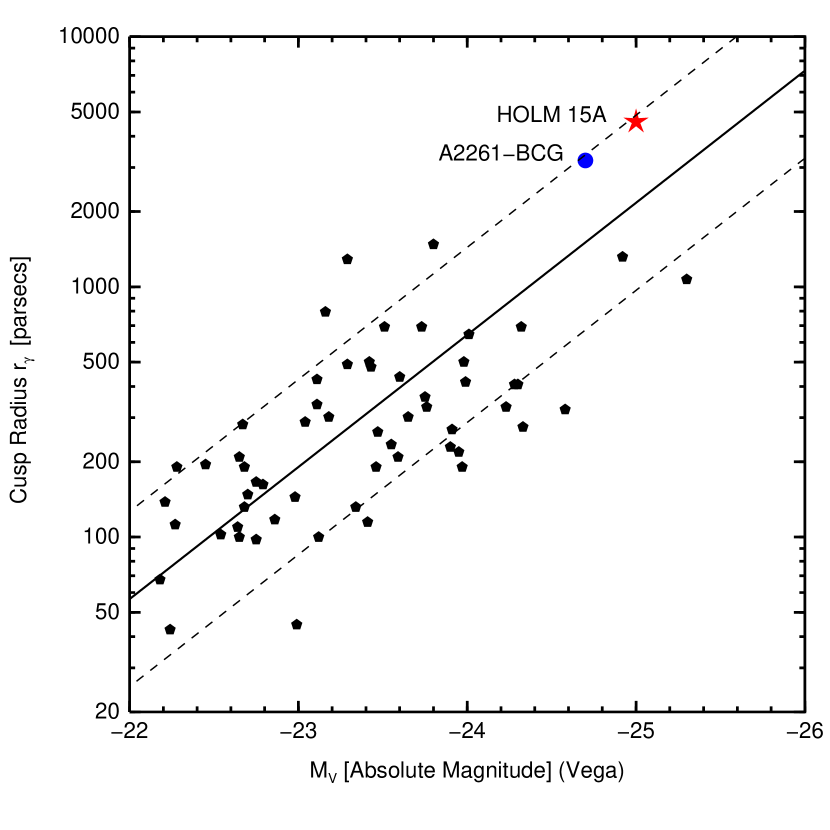
We have used optical images taken with different telescope configurations, using parametric and non-parametric approaches, and consistently find a large cusp radius for Holm 15A (). This value of the cusp radius makes Holm 15 about larger than A2261-BCG ( kpc), hitherto the largest-cored BCG (PL12). Holm 15A’s cusp radius is about the mean cusp radius for cored BCG (based on data from Laine et al., 2003). Figure 3 shows that although Holm 15A is the largest cusp-BCG, it nevertheless lies less than above the correlation between and luminosity (as does A2261-BCG). This might suggest that a common mechanism is responsible for the formation of cores over a wide range of scales.
The line ratios (§2.1.2) suggest that Holm 15A is a LINER (e.g., Ho, 2008; Torres-Papaqui et al., 2012). By comparison, A2261-BCG is devoid of emission lines (PL12). Low emission from molecular gas (Salomé & Combes, 2003) and dust (Quillen et al., 2008) suggests that there is little star formation in Holm 15A. Indeed, the radio power of Holm 15A (§2.2), being larger than , cannot be explained by star formation alone (Morrison et al., 2003). Hence, we conclude that optical line emission and radio continuum are dominated by AGN activity. A2261-BCG is a radio-AGN, it is slightly more luminous than Holm 15A (, PL12)
Using known scaling relations we formed the five SMBH mass estimates given in Table 2. The mass inferred from the relation is the lowest. This might be a consequence of the breakdown of the scaling law for (e.g., Lauer et al., 2007; Kormendy & Ho, 2013). Three scaling relations suggest BH masses , but these relations have large scatter and were derived with limited samples. Therefore, we conservatively suggest that Holm 15A hosts an SMBH with .
An SMBH has a strong stellar-dynamical influence within radius . If we adopt and velocity dispersion , . Thus only with the largest mass estimate from Table 2 can we interpret the cusp radius as due to the gravitational influence of an SMBH causing .
Let’s suppose that Holm 15A contains an SMBH binary with total mass , then we would expect the separation between the SMBH components to be (Dotti et al., 2012). For an SMBH binary total mass this implies , which is close to the average cusp scale of BCGs, but much less than the scale of Holm 15A.
The morphology of the radio emission in Holm 15A is not clear in current data, since most of the flux density is in rather diffuse structure, which could be much distorted. If this is the case, then by analogy with RBS 797 (Gitti et al., 2013), a high-sensitivity, high-resolution, map of the center of Holm 15A could test whether Holm 15A hosts an SMBH binary.
J004150 appears to be at far higher redshift than Holm 15A. However, if the light of Holm 15A was not properly modeled, the photometric redshift estimated for J004150 could be in error. Moreover, if J004150 is a quasar at , then extended X-ray emission from the hot interstellar medium is unlikely to have been detected in the current Chandra exposure. Instead, the apparent X-ray extension is more consistent with a low- AGN. It is possible that J004150 is a third SMBH component associated with Holm 15A. This can be tested by optical spectroscopy of J004150.
We follow Kormendy & Ho (2013, §6.10) to estimate the mass of the SMBH associated to the cluster dark matter halo. Abell 85 has velocity dispersion (from our own analysis and the literature) and hence should host a central SMBH. Holm 15A is the central galaxy of Abell 85, and three of the mass estimates in Table 2 are consistent with the expected cluster central SMBH mass. Such agreement is unexpected unless dark matter halos are scale-free, and the SMBH-dark matter coevolution is independent from the effects of baryons (cf., Kormendy & Ho, 2013). Otherwise, we should accept that ultramassive () BH in BCG follow special scalings as suggested by Hlavacek-Larrondo et al. (2012), and that the masses of SMBH cannot grow indefinitely (Natarajan & Treister, 2009).
4 Conclusions
We have found that Holm 15A has the largest core known so far, with . A central AGN supports the presence of a central BH, which could be ultramassive. Very large cores () seem to be rare (see Figure 3) and may represent a relatively brief phase in the evolution of BCG, as calculated merging times for SMBH binaries appear to be relatively short (Khan et al., 2014). Other mechanisms might be at work, because time scales for cusp regeneration seem too long (e.g., Merritt, 2006). If SMBH growth is regulated by galaxy mergers (e.g., Merritt, 2006; Booth & Schaye, 2011), their final masses were set, perhaps, by initial conditions (e.g., Treister et al., 2013).
The physical condition of Holm 15A may represent one of the best laboratories for testing the SMBH “scouring” scenario for the creation of BCG cores. Follow-up observations that might test for the presence of a second, or third, SMBH component include improved radio mapping, optical spectroscopy of J004150, and stellar- and gas-dynamical mapping using HST or a large ground-based telescope (e.g., Dalla Bontà et al., 2009; McConnell et al., 2012) to investigate velocities on scale . Since only a few BCGs have dynamically-determined BH masses (e.g., Table 2 in Kormendy & Ho, 2013), further studies on Holm 15A (and A2261-BCG) could provide crucial tests of the applicability of SMBH mass scaling laws, the core “scouring” scenario, and, hence, on the coevolution of BH.
References
- Ahn et al. (2012) Ahn, C. P., Alexandroff, R., et al. 2012, ApJS, 203, 21
- Añorve (2012) Añorve, C., 2012, Ph.D. Thesis, INAOE.
- Booth & Schaye (2011) Booth, C. M., & Schaye, J. 2011, MNRAS, 413, 1158
- Brown (1997) Brown, J.P. 1997, Ph.D. Thesis, University of Toronto.
- Burns (1990) Burns, J. O. 1990, AJ, 99, 14
- Cid Fernandes et al. (2005) Cid Fernandes, R., Mateus, A., et al. 2005, MNRAS, 358, 363
- Condon et al. (1998) Condon, J. J., Cotton, W. D., et al. 1998, AJ, 115, 1693
- Carollo et al. (1997) Carollo, C. M., Franx, M., et al. 1997, ApJ, 481, 710
- Coziol et al. (2011) Coziol, R., et al. 2011, Rev. Mexicana Astron. Astrofis., 47, 361
- Dalla Bontà et al. (2009) Dalla Bontà, E., Ferrarese, et al. 2009, ApJ, 690, 537
- Donzelli et al. (2011) Donzelli, C. J., Muriel, H., & Madrid, J. P. 2011, ApJS, 195, 15
- Dotti et al. (2012) Dotti, M., et al. 2012, Advances in Astron., 2012, 940568.
- Faber et al. (1997) Faber, S. M., Tremaine, et al. 1997, AJ, 114, 1771
- Fisher et al. (1995) Fisher, D., Illingworth, G., & Franx, M. 1995, ApJ, 438, 539
- Gitti et al. (2013) Gitti, M., Giroletti, M., et al. 2013, A&A, 557, L14
- Häussler et al. (2007) Häussler, B., McIntosh, D. H., Barden, M., et al. 2007, ApJS, 172, 615
- Hlavacek-Larrondo et al. (2012) Hlavacek-Larrondo, J., Fabian, A. C., Edge, A. C., & Hogan, M. T. 2012, MNRAS, 424, 224
- Ho (2008) Ho, L. C. 2008, ARA&A, 46, 475
- Hoessel (1980) Hoessel, J. G. 1980, ApJ, 241, 493
- Holmberg (1937) Holmberg, E. 1937, Annals of the Observatory of Lund, 6, 1
- Hu et al. (1985) Hu, E. M., Cowie, L. L., & Wang, Z. 1985, ApJS, 59, 447
- Huang et al. (2013) Huang, S., Ho, L. C., Peng, C. Y., et al. 2013, ApJ, 766, 47
- Khan et al. (2013) Khan, F. M., Holley-Bockelmann, K., et al. 2013, ApJ, 773, 100
- Khan et al. (2014) Khan, F. M, Holley-Bockelmann, K., & Berczik, P. 2014, arXiv:1405.6425
- Kormendy & Bender (2009) Kormendy, J., & Bender, R. 2009, ApJ, 691, L142
- Kormendy & Ho (2013) Kormendy, J., & Ho, L. C. 2013, ARA&A, 51, 511
- Laine et al. (2003) Laine, S., van der Marel, R. P., et al. 2003, AJ, 125, 478
- Lauer et al. (1995) Lauer, T. R., Ajhar, E. A., Byun, Y.-I., et al. 1995, AJ, 110, 2622
- Lauer et al. (2007) Lauer, T. R., Faber, S. M., et al. 2007, ApJ, 662, 808
- López-Cruz (1997) López-Cruz,O., 1997, Ph.D. Thesis, University of Toronto.
- López-Cruz et al. (2004) López-Cruz, O., et al. 2004, ApJ, 614, 679
- McConnell et al. (2012) McConnell, N. J., Ma, C.-P., et al. 2012, ApJ, 756, 179
- Merritt (2006) Merritt, D. 2006, Reports on Progress in Physics, 69, 2513
- Morrison et al. (2003) Morrison, G. E., Owen, F. N., et al. 2003, ApJS, 146, 267
- Natarajan & Treister (2009) Natarajan, P., & Treister, E. 2009, MNRAS, 393, 838
- Owen et al. (1984) Owen, F. N., Burns, J. O., & White, R. A. 1984, Clusters and Groups of Galaxies, 111, 295
- Peng et al. (2010) Peng, C. Y., Ho, L. C., Impey, et al. 2010, AJ, 139, 2097
- Postman et al. (2012) Postman, M., Lauer, T. R., et al. 2012, ApJ, 756, 159 (PL12)
- Quillen et al. (2008) Quillen, A. C., Zufelt, et al. 2008, ApJS, 176, 39
- Ravindranath et al. (2001) Ravindranath, S., Ho, L. C., Peng, C. Y., et al. 2001, AJ, 122, 653
- Richards et al. (2009) Richards, G. T., Myers, A. D., et al. 2009, ApJS, 180, 67
- Robles & Matos (2012) Robles, V. H., & Matos, T. 2012, MNRAS, 422, 282
- Rusli et al. (2013) Rusli, S. P., Erwin, P., et al. 2013, AJ, 146, 160
- Salomé & Combes (2003) Salomé, P., & Combes, F. 2003, A&A, 412, 657
- Sand et al. (2011) Sand, D. J., Graham, M. L., Bildfell, C., et al. 2011, ApJ, 729, 142
- Skrutskie et al. (2006) Skrutskie, M. F., Cutri, R. M., et al. 2006, AJ, 131, 1163
- Slee et al. (2001) Slee, O. B., Roy, A. L., Murgia, M., et al. 2001, AJ, 122, 1172
- Torres-Papaqui et al. (2012) Torres-Papaqui, J. P., et al. 2012, Rev. Mexicana Astron. Astrofis., 48, 275
- Treister et al. (2013) Treister, E., Schawinski, K., Volonteri, M., & Natarajan, P. 2013, ApJ, 778, 130
| P. A. | Data | ||||||||
|---|---|---|---|---|---|---|---|---|---|
| 0.26 | -33.33 | ★★ LOCOS (López-Cruz, 1997), Telescope: KPNO 0.9m, CCD: T2KA; pixel scale: /pixel. filter: (Kron-Cousins), exposure time: , seeing: FWHM, FOV: . | |||||||
| 22.32 | 19.09 | 20.50 | 1.22 | 3.62 | 0.0 | 0.24 | -34.07 | ∙∙ MENeaCS (Sand et al., 2011), Telescope: CFHT 3.5m, CCD: MegaCam; pixel scale: /pixel, filter: (SDSS), exposure time: , seeing: FWHM, FOV: . |
Note. — centroid: ,