Magnetic field amplification and magnetically supported explosions of collapsing, non-rotating stellar cores
Abstract
We study the amplification of magnetic fields in the collapse and the post-bounce evolution of the core of a non-rotating star of 15 in axisymmetry. To this end, we solve the coupled equations of magnetohydrodynamics and neutrino transport in the two-moment approximation. The pre-collapse magnetic field is strongly amplified by compression in the infall. Initial fields of the order of translate into proto-neutron star fields similar to the ones observed in pulsars, while stronger initial fields yield magnetar-like final field strengths. After core bounce, the field is advected through the hydrodynamically unstable neutrino-heating layer, where non-radial flows due to convection and the standing accretion shock instability amplify the field further. Consequently, the resulting amplification factor of order five is the result of the number of small-eddy turnovers taking place within the time scale of advection through the post-shock layer. Due to this limit, most of our models do not reach equipartition between kinetic and magnetic energy and, consequently, evolve similarly to the non-magnetic case, exploding after about 800 ms when a single or few high-entropy bubbles persist over several dynamical time scales. In the model with the strongest initial field we studied, , for which equipartition between flow and field is achieved, the magnetic tension favours a much earlier development of such long-lived high-entropy bubbles and enforces a fairly ordered large-scale flow pattern. Consequently, this model, after exhibiting very regular shock oscillations, explodes much earlier than non-magnetic ones.
keywords:
Magnetohydrodynamics (MHD) - Supernovae: general - Stars: magnetic fields - Stars: magnetars1 Introduction
Most scenarios for the explosion mechanism of core-collapse supernovae (SNe) involve a combination of energy deposition in the matter surrounding the nascent proto neutron star (PNS) and multi-dimensional hydrodynamic flows. Examples for means of energy transfer to the SN ejecta are the prompt bounce shock, neutrinos, magnetic fields and acoustic waves. In the neutrino-heating mechanism neutrinos tap the gravitational potential energy released during collapse and deposit a part of it behind the stalled shock. This process is enhanced and thus supported by non-radial fluid flows triggered by hydrodynamic instabilities like convection and the standing accretion shock instability (SASI; Blondin et al., 2003; Foglizzo, 2001, 2002)
It is safe to assume that the collapsing stellar core will possess a magnetic field of some (uncertain) strength and topology. This assumption is supported by observational evidence for the presence of surface magnetic fields of up to in white dwarfs, which resemble in many respects the iron cores of evolved massive stars (Wickramasinghe & Ferrario, 2000). Furthermore, neutron stars created in SNe may be endowed with magnetic fields G (pulsars) to G (magnetars; see, e.g. Kaspi, 2010). Nonetheless, the possible influence of the field on the explosion is less clear. The main reason for the small number of conclusive investigations into this topic is that important effects are expected to occur only when the magnetic field is roughly in equipartition with the kinetic energy of the gas flow, a condition corresponding to extremely strong fields similar to those observed in magnetars. This makes full MHD simulations including a treatment of the important neutrino physics in the SN core indispensable.
Stellar evolution calculations, predicting only weak pre-collapse magnetic fields (Heger et al., 2005), render the prospects for magnetically affected explosions very much dependent on the amount of field amplification happening during and after collapse. Rapid differential rotation may amplify a weak seed field quite generically to dynamically relevant values, e.g. by winding up a poloidal field (a process linear in time) or, exponentially in time, by the magneto-rotational instability (MRI, for a review, see Balbus & Hawley, 1998). The potential relevance of the latter in supernova cores was first pointed out and explored by Akiyama et al. (2003). Magneto-rotational explosions, theoretically discussed by Meier et al. (1976), have been studied in various approximations, e.g. by Bisnovatyi-Kogan et al. (1976); Symbalisty (1984); Akiyama et al. (2003); Kotake et al. (2004); Thompson et al. (2005); Moiseenko et al. (2006); Obergaulinger et al. (2006); Dessart et al. (2007); Burrows et al. (2007); Cerdá-Durán et al. (2007); Obergaulinger et al. (2009); Masada et al. (2012). Recent magnetohydrodynamic (MHD) simulations employing (detailed) microphysics (neutrinos and a sophisticated high-density equation of state) have been performed by Burrows et al. (2007) and by Scheidegger et al. (2008); Winteler et al. (2012) and Mösta et al. (2014). While the former used a multi-group flux-limited diffusion treatment for the neutrino transport in a Newtonian framework, the latter approximated the effects of neutrino radiation by a parametrisation of the pre-bounce deleptonisation of the core. Albeit using simplified neutrino physics, the high-resolution global simulations of Sawai et al. (2013) addressed one of the most severe problems in numerical models of magneto-rotational collapse, viz. the extremely high resolution required to resolve the fastest growing MRI modes.
However, according to stellar-evolution models, the majority of progenitors is expected to rotate slowly. Although many stars on the upper main sequence show a surface rotation period close to the critical value for mass shedding, they will most likely lose most of their angular momentum during their subsequent evolution, e.g. by strong stellar winds or magnetic braking (Heger et al., 2005; Meynet et al., 2011). Non-rotating cores, albeit lacking the above-mentioned efficient channels for amplification, may experience field growth by several effects:
-
1.
Due to the extremely low resistivity of the SN core matter, the magnetic field lines are frozen in the flow. Hence, the compression of the gas during the collapse is accompanied by an increase of the field strength by roughly three orders of magnitude, while the topology of the field does not change.
-
2.
After bounce, convection develops in the PNS and the surrounding hot-bubble region. Breaking down into three-dimensional turbulence, convection may provide the effect responsible for a small-scale dynamo amplifying the field on length scales comparable to the scale of turbulent forcing, i.e. the size of convective eddies (Thompson & Duncan, 1993). However, the generation of a large-scale field, e.g. on the scale of the PNS, probably requires a non-vanishing kinetic helicity of the turbulent flow, which can most naturally be accounted for by (differential) rotation (see, e.g. Brandenburg & Subramanian, 2005).
-
3.
Endeve et al. (2010) and subsequently Endeve et al. (2012) have demonstrated that the standing-accretion-shock instability, growing through acoustic and advective perturbations that form a positive feedback cycle between the shock wave and the deceleration region above the PNS, has the potential to amplify the magnetic field by up to four orders of magnitude. Dynamically relevant field strengths (in which case the field reaches at least 10% of equipartition with the kinetic energy) can be reached only when the pre-collapse field in the stellar core is sufficiently strong.
-
4.
Non-radial fluid motions triggered by these instabilities can excite perturbations of the magnetic field propagating as Alfvén waves along the field lines. The outward propagation of Alfvén waves excited close to the PNS has to compete with the accretion of gas towards the centre. Assuming that the accretion flow decelerates in this region continuously, Guilet et al. (2011) argue that there must be an Alfvén point at which the Alfvén speed equals the accretion velocity, and the propagation of the wave (measured in the lab frame) comes to a rest. They show that Alfvén waves are amplified exponentially at such a stagnation point. For the conditions of a supernova core, the amplification should be most efficient for a magnetic field strength of a few G and could yield final fields of the order of G. Dissipation of the wave energy can increase the entropy of the gas, thus modifying the dynamics in the accretion region. For even stronger fields, the Alfvén point can be close to the shock wave. In this case, Suzuki et al. (2008) find that the explosion can be driven solely by the energy deposited by the dissipation of Alfvén waves. This process transmitting energy from the (convectively active) PNS to the much less dense surrounding medium bears a strong similarity to the proposed mechanism for heating the solar corona by Alfvén waves emerging from the solar surface (e.g. McIntosh et al., 2011).
Previous simulations of magnetohydrodynamic stellar core collapse have used a wide variety of methods to treat the effects of neutrinos: in the simplest models, they were either ignored (e.g. Obergaulinger et al., 2006; Mikami et al., 2008) or treated by simple parameterizations or local source terms (e.g. Cerdá-Durán et al., 2008); more complex approaches include trapping/leakage schemes (e.g. Kotake et al., 2004), multi-dimensional, energy-dependent flux-limited diffusion (Dessart et al., 2006) or the isotropic-diffusion source approximation, which distinguishes between trapped and free-streaming components to avoid the treatment of stiff source terms (Liebendörfer et al., 2009). In our approach to radiation-magnetohydrodynamics (RMHD), we employ a new multi-dimensional and energy-dependent scheme for the neutrino transport in supernova cores, namely a two-moment solver for the neutrino energy (lepton number) and momentum equations with an analytic closure relation (Cernohorsky & van Weert, 1992; Pons et al., 2000; Audit et al., 2002). Two-moment closure schemes for neutrino transport were also applied in relativistic simulations of black hole-torus systems by Shibata & Sekiguchi (2012) (see also Shibata et al., 2011) and in stellar core collapse by Kuroda et al. (2012); O’Connor & Ott (2013).
It is the goal of this work to extend and improve our previous study (Obergaulinger & Janka, 2011). Employing a more detailed analysis, we investigate the relevance of field amplification mechanisms like those in points (i)-(iv) concerning their importance for the evolution and potential revival of the stalled shock by core-collapse simulations including a reasonably good treatment of the relevant microphysics. In particular, we will study the field growth connected to convective and SASI activity in the post-shock layer and the role of energy transport and dissipation by Alfvén waves. To this end, we perform MHD simulations of collapse and post-bounce evolution of the core of a star of 15 solar masses (Woosley et al., 2002). Varying the strength of the initial field, we can determine different regimes and mechanisms of field amplification and identify the back-reaction of the field onto the flow and the ultimate onset of an explosion. In contrast to current models of stellar evolution, which predict predominantly toroidal magnetic fields (Heger et al., 2005), we start our simulations from purely poloidal initial fields. This choice is in part motivated by the use of similar initial fields in previous studies of core collapse (e.g. Obergaulinger et al., 2006; Suwa et al., 2007). Furthermore, in axisymmetric models neglecting rotation, there is no topological difference between the - and -components of the field, and a field containing the radial and the -component is qualitatively equivalent to a field consisting of all three components. Hence, we do not expect this choice of the initial field geometry to have a crucial influence on our results.
2 Physical model and numerical methods
We assume that the evolution of the gas and the magnetic field is described by the equations of Newtonian ideal magnetohydrodynamics (MHD),
| (1) | ||||
| (2) | ||||
| (3) | ||||
| (4) | ||||
| (5) |
describing the conservation of mass, electron-lepton number, gas momentum, total energy of the matter, and magnetic flux, respectively. In addition to these evolutionary equations, the magnetic field has to fulfil the divergence constraint,
| (6) |
The symbols used in this system have standard meanings: , , and are mass density, electron fraction, velocity, magnetic field, gas pressure, and the gravitational potential, respectively. The total energy density is defined as the sum of internal energy density, , kinetic energy density, and magnetic energy density, , and the total pressure contains the contributions of the gas pressure and the magnetic pressure, . The source terms , and , account for the exchange of (net) electron number, energy, and momentum between the gas and the neutrinos, respectively, and will be discussed below.
We use a finite-volume code based on the constrained-transport formulation of the equations of Newtonian ideal magnetohydrodynamics and employing high-resolution monotonicity-preserving reconstruction schemes of order (Suresh & Huynh, 1997) and the HLL Riemann solver within the MUSTA framework (Toro & Titarev, 2006). The stellar material is described by the equation of state (EOS) of Lattimer & Swesty (1991) with a compressibility of at high densities above . Below that threshold, we use the treatment of the Vertex simulations as applied in Liebendörfer et al. (2005) including leptons, nuclei (Si and Ni), and radiation. We approximate general relativistic gravity by version A of the TOV potential of Marek et al. (2006).
We will outline the basics of our treatment of neutrino physics in the following. For a detailed description of the transport scheme and its implementation, we refer to a forthcoming publication by Just, Obergaulinger, & Janka. We solve the comoving-frame energy-dependent, multi-dimensional moment equations for the energy density, , and energy flux, , of neutrinos of energy (the subscript distinguishes between neutrino flavours),
| (7) | ||||
| , | ||||
| (8) | ||||
| , |
where (the neutrino pressure tensor) and are the second and third angular moments of the neutrino distribution function and denotes the fluid velocity, respectively.
In addition to energy and momentum conservation (in the absence of source terms), the neutrino numbers need to be conserved as well, if sources and sinks do not play a role. This is not automatically guaranteed by numerical schemes that solve the moment equations for the energy density and energy flux. However, with a suitable discretisation scheme for Equations (7) and (8), this problem can be overcome (Müller et al., 2010, Appendix B).
Conservation of energy and momentum translates into the following relations for the source terms in the fluid equations:
| (9) | |||||
| (10) |
The source term for the conservation equation of net electron number, Eq. (2), follows from the source term for energy,
| (11) |
where is the atomic mass unit.
Presently only electron neutrinos and antineutrinos are considered, i.e. . The source terms, , include the interaction rates of neutrinos with the gas by emission, absorption, and scattering reactions; we use a reduced set of processes, viz.
-
1.
emission and absorption of electron neutrinos by neutrons,
-
2.
emission and absorption of electron anti-neutrinos by protons,
-
3.
elastic scattering of all neutrinos off nucleons,
-
4.
emission and absorption of electron neutrinos by heavy nuclei,
-
5.
coherent elastic scattering of all neutrinos off heavy nuclei,
-
6.
inelastic scattering of neutrinos off electrons and positrons.
In our implementation of these processes, we follow Rampp & Janka (2002). Due to their stiffness, we solve these source terms implicitly and split them off from the other parts of the conservation equations by an operator-split step.
Despite the simplified treatment of neutrino-matter interactions, in the context of the questions focussed on in this paper, the scheme provides a reasonably good representation of the neutrino effects that play a role during core collapse, bounce, shock propagation and in the accretion layer behind the stalled supernova shock. Moreover, it is a computationally efficient treatment of the neutrino transport, and two-dimensional simulations up to several hundred milliseconds after bounce are well feasible.
Furthermore, fluid-velocity dependent effects such as the work associated with diverging flows appear in the equations as well. To close the system of moment equations, we have to specify the tensor of the second moment, , for which we employ the maximum-entropy closure due to Cernohorsky & Bludman (1994). Using a tensorial generalisation of a one-dimensional Eddington factor, our method is generically multi-dimensional.
We note that our set of equations goes beyond the usual diffusion ansatz, in which the system of moment equations is truncated at the level of the energy equation and closed by expressing the flux in terms of the gradient of the energy density, mostly connecting diffusion and free-streaming limits by a flux limiter. Retaining the first two moment equations, our scheme leads to a hyperbolic system, which can be solved by common methods such as high-resolution shock-capturing methods.
In the models presented here, we include only electron neutrinos and anti-neutrinos and neglect pair processes and muon and tau neutrinos. This simplification affects to a certain degree the cooling of the PNS, and hence its contraction. Although this effect modifies the surrounding layers where much of the field amplification takes place, these modifications are not sufficiently strong to change our main results concerning the processes relevant for field amplification beyond the level of quantitative corrections. We expect the corrections to be of a similar magnitude as the ones due to other uncertainties that affect the PNS cooling such as the possibility of a stiffer nuclear equation of state. The “stiffness” of the neutron-star EOS and the corresponding faster or slower contraction of the PNS can, however, have a decisive influence on the development of an explosion, which is favoured or develops faster for a soft EOS with more compact PNS (Marek & Janka, 2009; Janka, 2012; Suwa et al., 2013; Couch, 2013). The goal of this paper is therefore not the determination of explosion conditions of 2D stellar cores with magnetic fields in the most “realistic” manner (also the simplifications applied in our treatment of neutrino interactions would conflict with such an aim) but the assessment of field amplification mechanisms and of the influence of strong fields on the development of an explosion in comparison to the non-magnetic case.
3 Models and initial conditions
The main purpose of our simulations is the differential analysis of the effects of variations of the initial magnetic field on the collapse and post-bounce evolution of a stellar core until explosion when otherwise all parameters are kept equal. We select the core of a star of 15.0 (Woosley et al., 2002) and map the pre-collapse model to a grid of zones. In the axisymmetric simulations, lateral zones were distributed uniformly in between the north and south pole. Up to a radius of , the radial grid was uniform with a grid width of . For higher radii, the grid width was set to , resulting in an aspect ratio close to unity for grid cells. The outer radius of the grid was . At a radius of , the grid width is . The resolution at the grid centre is . We discretise the energy dependence of the neutrino distribution function with energy bins. The first zone of the energy grid covers the energy range , and the grid width of the other 15 zones is given by . The grid extends to a maximum energy of .
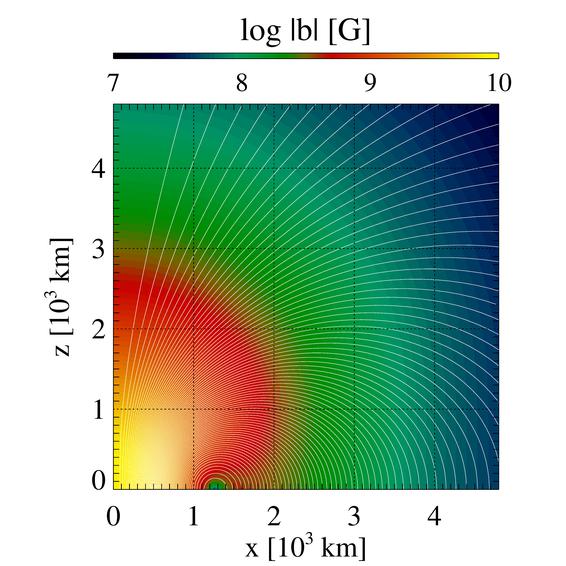
The topology of the magnetic field at the onset of collapse is highly uncertain. On the main sequence, field amplification by, e.g., gradual contraction of the star or convection competes with the loss of magnetic energy in stellar winds and in work the magnetic field does by exerting torques on the stellar matter. In the absence of rotation, stars lack an important ingredient of most large-scale dynamos. In such a case, they may be dominated by a small-scale turbulent field rather than a large-scale field. Nevertheless, we assume a simple initial field, viz. a modified dipole (Fig. 1). While this may not be the most likely field configuration in real stellar cores (though it resembles the poloidal component of the field topology found by Braithwaite & Nordlund (2006) simulating the magnetohydrodynamics of stellar interiors), it represents a favourable configuration for the Alfvén-wave amplification mechanism we are interested in because of the large, coherent radial component allowing for the radial propagation of Alfvén waves. Furthermore, we observe that the field is replaced by a more complex small-scale field in the regions of the core affected by hydrodynamic instabilities such as convection and the SASI. Hence, we deem the influence of such an artificial choice for the initial field on our results not crucial.
The field is the same as the one used by Suwa et al. (2007), defined by a vector potential of the form
| (12) |
We set the normalisation radius defining the location of the dipole to and vary the parameter setting the field at the centre of the core to values between and G, i.e. in a range considerably above that found by (Heger et al., 2005) for rotating progenitors. In particular the strongest initial fields can, thus, not be representative for typical pre-collapse cores. The models are called B, where the number is the decadic logarithm of . Fig. 1 displays the initial field of Model B10. For comparison, we also performed simulations of a non-magnetic model in spherical symmetry as well as axisymmetry (Models s15-15 and B0, respectively).
We assume open boundary conditions at the outer radius of our grid. There we extrapolate the mass density and the radial velocity of the gas in such a way that the mass accretion rate in the ghost zones, , varies linearly with radius.
4 Results
4.1 Hydrodynamics of non-magnetic models
We start the presentation of the simulation results with a description of the evolution of models without magnetic fields in spherical symmetry and axisymmetry, Models s15-1d and B0, respectively. They serve us as reference cases to which we will compare the results of the two-dimensional magnetised models. Furthermore, they allow for a comparison to existing simulations that use more accurate treatments of neutrino interactions.
We have performed a spherically symmetric (1D) simulation of the same progenitor star that we employ for the rest of the models in our paper. This simulation shows an overall qualitative (and in many aspects good quantitative) agreement with results obtained with more sophisticated neutrino-transport schemes and including all neutrino flavours. A detailed comparison will be provided by Just et al. (in preparation). As expected, the spherically symmetric model does not yield a successful SN explosion. Instead, the core collapses after of post-bounce accretion. We note that we cannot treat the evolution of this final collapse stage within the framework of our pseudo-relativistic treatment of gravity, but all diagnostic parameters indicate the onset black-hole formation, driven by continued accretion of collapsing stellar matter.
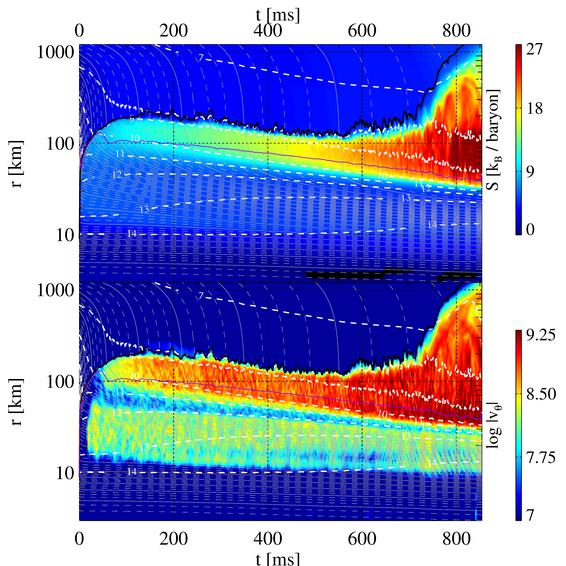
Deviations from spherical symmetry start to show up in the axisymmetric version of the non-magnetic model, B0, after bounce. We display the time evolution of angularly averaged specific entropy and lateral velocity in mass-shell plots in Fig. 2111Although the definition of mass shells is not possible in multi-dimensional models, we will use this term to refer to shells of enclosed mass in angularly averaged profiles of the axisymmetric models.. The angular averages of the absolute value of the non-radial velocity, visible in the bottom half, indicate where hydrodynamic instabilities develop. Two potentially unstable regions appear very clearly:
-
1.
Convective instability inside the PNS is limited in many simulations to a region below the neutrinospheres (e.g. Buras et al., 2006; Dessart et al., 2006). In these simulations, convection basically develops only where the Ledoux-criterion for instability is fulfilled. Although the Ledoux-unstable region has a very similar shape in our model, non-radial mass motions are not limited to this region in our case, but cover basically the entire outer layers of the PNS, from a density of to the neutrinospheres. This peculiar difference is most likely a consequence of the omission of and neutrinos. We take it as a matter of fact and will mainly discuss how the unstable region reacts to the presence of a magnetic field.
-
2.
The so-called hot-bubble region behind the stalled shock wave exhibits unstable flows due to convection and the standing accretion shock instability (SASI). The relative importance of these two instabilities is currently a matter of intense investigations (see, e.g. Burrows et al., 2012; Müller et al., 2012; Fernández et al., 2014). As in the case of the instability inside the PNS, a closer discussion of this problem is not the topic of our work, but we focus on the magnetic field amplification associated with these non-radial flows.
Non-radial mass motions in the gain layer cause shock deformations and oscillations on a moderate scale. For a long time, the minimum, mean, and maximum shock radii follow the trend of the spherical model and recede gradually. The first after bounce are characterised by oscillations of the shape of the shock (measured, e.g. by the difference between minimum and maximum shock radius). Later, shock recession comes to a halt. The minimum and average shock radius never decrease below 100 km, and expand after . At this point, the post-shock instabilities and shock oscillations start to become more violent again. The shock adopts an increasingly bipolar form. Finally, it expands, and a successful explosion sets in. Since this reduces the mass accretion onto the PNS, it does not undergo collapse as in the spherical version of the model. We note that the exact time of the onset of explosion will certainly depend on the detailed shock oscillations that develop in the phase of shock expansion and, thus, will have a stochastic nature.
Our results for this model should be understood in the same spirit as the spherical model, i.e. as a reference point for the following discussion of the magnetic models and not as a detailed investigation of the physics of the hydrodynamic instabilities and the neutrino physics. Irrespective of its cause, physical or as a result of our approximations, we take advantage of the long delay until the explosion sets in, because it allows us to follow the evolution of the magnetic field for a long time before the post-shock flows are disrupted. Thus we may identify magnetic effects that might be suppressed in a model exploding earlier, e.g. due to neutrino heating.
Based on this dynamical evolution, we introduce for further reference the following regions commonly used in CCSN theory:
- IHSP:
-
The inner hydrodynamically stable PNS extends from the origin to roughly the radius where the density of the gas drops below .
- PCNV:
-
This inner core is surrounded by the PNS convection zone, characterised by a negative gradient of the electron fraction and a flat or slightly negative entropy gradient. The outer boundary of this layer is associated with the location of the minimum of the profile.
- COOL:
-
In the cooling layer outside the PNS convection zone, the accreted matter suffers a net energy loss due to the production of neutrinos. At its bottom, the flow is decelerated and settles onto a stable layer on the “surface” of the PNS.
- GAIN:
-
The gain region is stirred by hot-bubble convection and SASI activity. The gain radius, which defines the transition from neutrino cooling below to neutrino heating above, coincides approximately with the upper boundary of the stable layer. Because of neutrino heating, the gain layer develops a negative entropy gradient and thus postshock convection. The SASI activity, however, takes place in a larger volume, encompassing parts of the neutrino-cooling layer as well. SASI modes are amplified between the shock as an outer boundary and an inner boundary layer, where the accretion flow gets decelerated (see, e.g. Foglizzo et al., 2006; Scheck et al., 2008). This happens typically between neutrinosphere and gain radius. Furthermore, convective overshooting may extend to regions below the gain radius.
Unless stated otherwise, we define these regions based on angularly averaged profiles. The resulting radii separating the four regions are therefore only an approximate representation of the more complex two-dimensional borders of the regions. For instance, convective overshooting in the COOL region leads to rather high non-radial kinetic energies also below the average222We will omit this adjective in the following. gain radius.
4.2 Weak initial magnetic field: Model B10
Models B08, B10 and B11 (, respectively) exhibit very similar dynamics compared both to each other and to the non-magnetised reference model. We will focus in the discussion on Model B10.
We simulated Model B10 until a post-bounce time . The structure of the core during the post-bounce evolution is the same as that of Model B0 shown in Fig. 2. We will present the discussion of the evolution of the magnetic field in the regions introduced above in the following.
4.2.1 The proto-neutron star
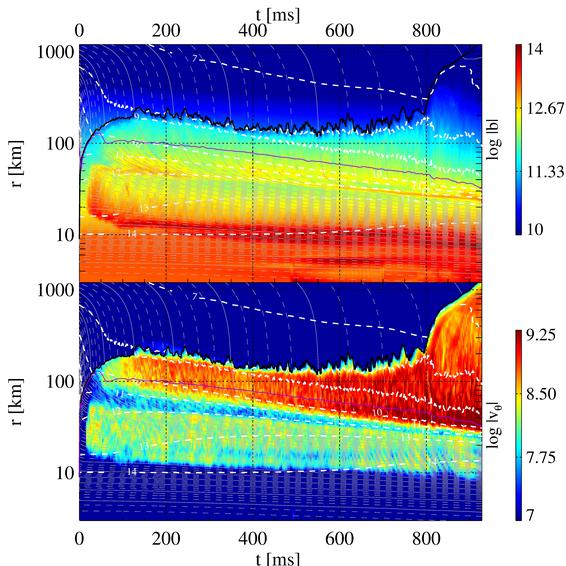
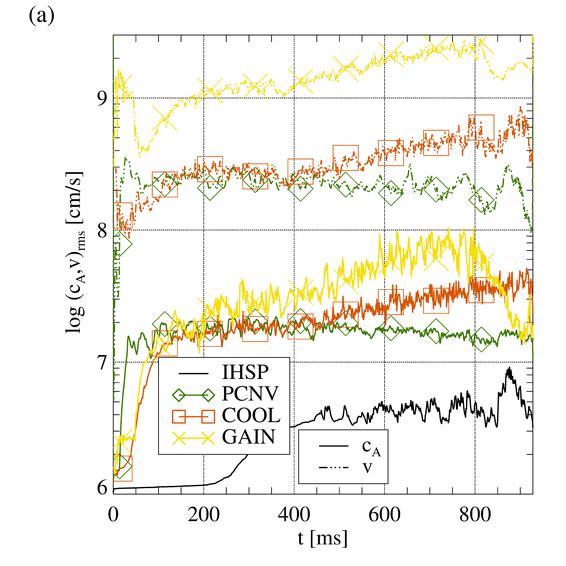
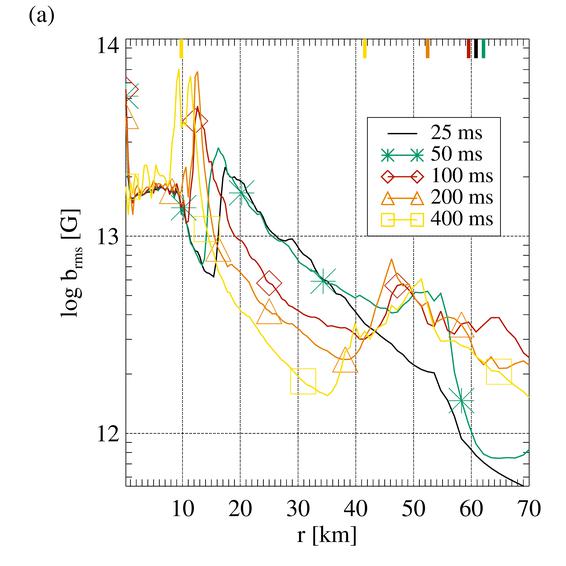
The regions inside of the PNS (regions IHSP, PCNV, and COOL) are visible in Fig. 3, and the time evolution of the angular average values of the Alfvén (solid lines) and flow speeds (dashed lines) in these regions is displayed in the top panel of Fig. 4. Accretion of matter (cf. the grey trajectories of angularly averaged mass shells in Fig. 3) leads to an increasing mass of the PNS and partially powers the neutrino emission. The PNS (for which we take the iso-density line as a proxy) contracts to a radius around at the end of the simulation. The extent and intensity of the hydrodynamically unstable flows inside the PNS is the same as in the non-magnetic model, i.e. we do not find a notable influence of the magnetic field on the hydrodynamics. Consequently, the average field strength in the IHSP region is basically constant; see the black line in Fig. 4 (top) - the increase after is not caused by field amplification in this region, but by a slow transport of magnetic energy across the iso-density surface of g cm3 from the convectively active region.
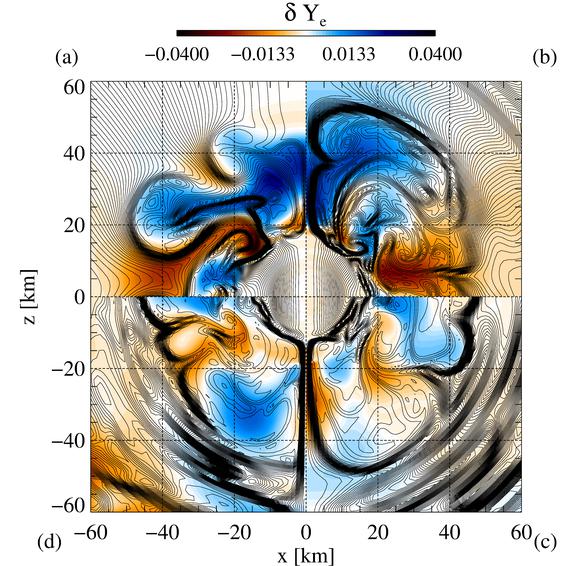
Overturning motions in the convectively unstable region, on the other hand, have a strong effect on the magnetic field. Snapshots forming a time series of the first of the evolution of the PNS are displayed in Fig. 5. The innermost are stable with velocities remaining close to zero there, and the magnetic field retains its initial topology. Outside of this radius, a few large convective rolls develop consisting of upflows of high (blue) and downflows of low (red) and entropy. They twist and stretch the magnetic field lines and amplify the field in region PCNV until a stationary level is reached. The solid green line with diamonds in the top panel of Fig. 4 presents a volume average of the Alfvén speed, , defined as
| (13) |
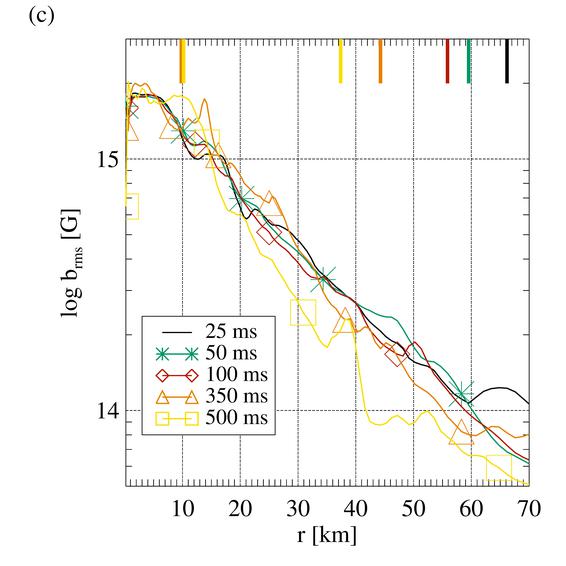
The steep early rise before is a geometric effect as the PCNV is established. Afterwards, the mean field increases moderately and levels off at a value around 333We define the r.m.s. mean of a vector field as , where represent the (volume) average., corresponding to an Alfvén speed of a few times .
In principle, a natural scale for the final magnetic energy achieved by convective field amplification could be set by the kinetic energy of the convective rolls. In our model, however, the magnetic energy falls short of this upper limit by about two orders of magnitude: the Alfvén speed is at least an order of magnitude lower than the flow speed. This shortfall coincides with a particular geometry of the field: the field is rather weak in the interior of the convective region, but strong in its upper and lower boundaries layers, as can be seen in the profiles of the bottom panel of Fig. 4 and the upper part of Fig. 3. Inside the convective region PCNV, a profile of the r.m.s. field strength roughly is established at late times. The power of the profile decreases considerably, i.e. convection does not lead to field amplification, or, at least, is unable to compensate the loss of magnetic flux from this region due to losses across the boundary of the convective layer and resistive dissipation and diffusion, leading to a field far from equipartition with the kinetic energy. Although our simulations are run in ideal MHD, i.e. without an explicit physical resistivity, inevitably the numerical discretisation leads to errors which can behave similarly to a physical resistivity (for a thorough discussion, see Endeve et al., 2012). We find strong indications for the influence of numerical resistivity in the development of closed magnetic field lines in the interior of these overturning cells (e.g. around in Panel (d) of Fig. 5). These form from magnetic flux sheets stretched by the overturning flows until their transverse dimension is comparable to the grid scale, at which point numerical diffusion disrupts them into separated magnetic islands.
In two-dimensional convection, such a phenomenon, known as convective flux expulsion, is very common (e.g. Mestel, 1999). Its occurrence might be taken as indication that our simulations are under-resolved and we should use much finer grids to reach convergence. Besides flux expulsion from the convection zone below, the accretion flow coming from the shock wave is decelerated in this region, thus depositing magnetic flux there and contributing to the magnetic energy (cf. the red line in the top panel of Fig. 4). This part of the magnetic field exhibits a strong lateral component, as can be seen in Panels (c), (d) of Fig. 5.
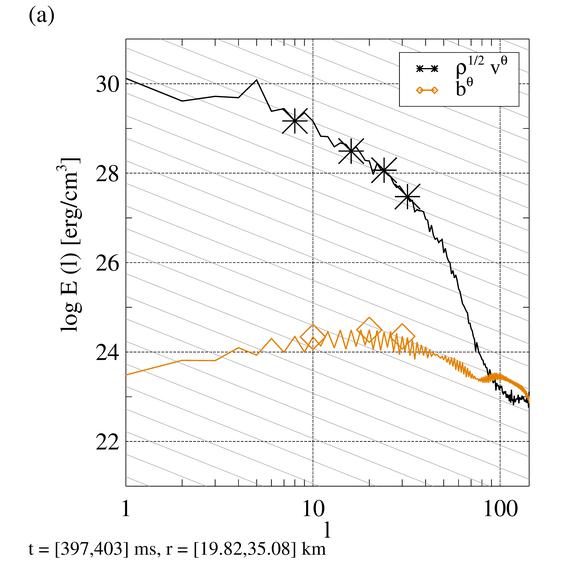
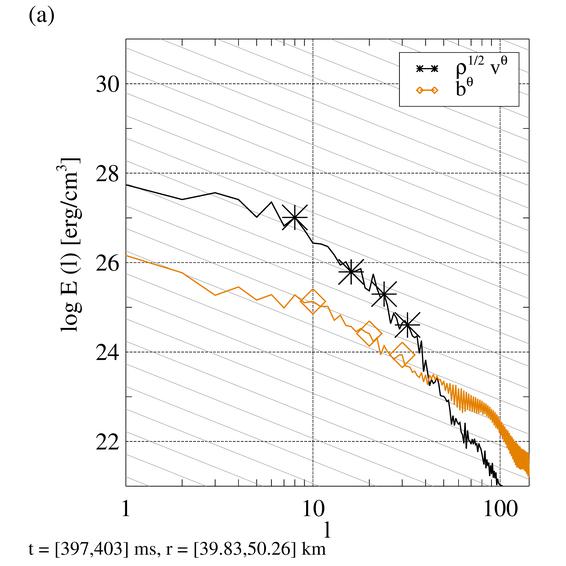
This evolution is reflected in the energy spectra of the angular components of the velocity and magnetic field. We decompose a variable into spherical harmonics of degree :
| (14) |
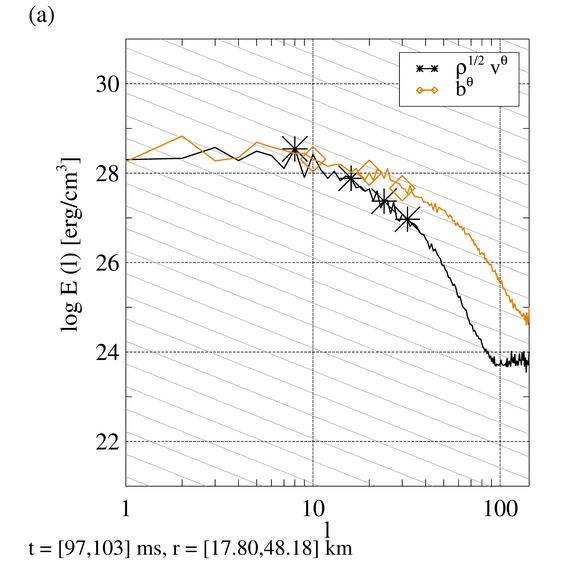
where the spherical harmonics are defined in terms of the associated Legendre polynomials . From the coefficients , we compute an energy spectrum, . Setting and , gives the lateral kinetic and magnetic energy of a spectral mode of degree . We show selected kinetic and magnetic energy spectra of the -components at a position in the lower PCNV region for times in Panel (a) of Fig. 6. The curves can be compared to the Kolmogorov scaling, (grey lines) characterising the enstrophy cascade at low to intermediate and the steeper scaling, typically , of the energy cascade at high (Hanke et al., 2013). Lower modes of the velocity spectra () have a mostly flat spectrum, and a Kolmogorov scaling is a good approximation in a rather limited intermediate range (), while higher modes are characterised by a steeper decline towards the dissipation scales close to the grid resolution. The normalisation of the low-mode part of the spectrum remains roughly constant, hinting at a constant energy in the convective motions in the PNS. The magnetic field possesses a mostly flat spectrum with much less spectral energy throughout the well-resolved modes. Over the course of the evolution, we observe a slow tendency of decreasing spectral power of the magnetic field on the lowest angular scales, while high-order modes develop a pronounced bump as overturns break down the large-scale structures of the magnetic field in the PNS convection layer into small-scale modes and, finally, dissipation converts those into thermal energy.
The structure of the field lines as shown in Fig. 5 hints towards another shortcoming of our models: the magnetic field is strongest along the symmetry axis where the geometry does not allow for the development of lateral velocities. This effect can also be understood in terms of the expulsion of magnetic flux into a region where convection is suppressed. However, the reason for the suppression in this case is not physical as the effect happens at the angular boundaries of the PCNV region; instead, it is an artifact of the assumption of axisymmetry.
The magnetic flux expelled from the interior of the convection zone tends to accumulate at the upper and lower boundaries where the velocities are close to zero, see the maxima in the bottom panel of Fig. 4 and the green-yellow and red bands in the top half of Fig. 3. The fluid velocities close to the radial and angular boundaries of the unstable layer are strongly aligned with the magnetic field and both are tangential to the region where overturning velocities operate: lateral at the top and bottom, and predominantly radial along the axis. As a consequence, very little magnetic flux is advected into the fluid vortices. In Panels (c) and (d) of Fig. 5, a few radial flows between the large convective cells can be identified, which drag along field lines. Injection of magnetic flux into the unstable region by these narrow, finger-like flows and its amplification by the convective motions is apparently insufficient to balance the loss of flux by diffusion and dissipation. In addition to the small amount of flux advected into the convective zone, their shape makes these magnetic fingers very vulnerable against dissipation or resistive instabilities. Therefore, they can be destroyed very easily, which further contributes to limiting the potential of field amplification.
The thin layers of non-radial field on top of the PCNV layer are not as prone to resistive disruption as the filaments in the unstable region. This highlights the importance of the small-scale dynamics for the field evolution. Numerical resistivity has only an important effect on structures with a size close to the grid resolution. The layers of lateral fields consist of far wider flux sheets, and also the radial streams injecting magnetic flux into the PCNV layer are relatively thick. The latter, however, are quickly stretched by the convective motions and in this process become increasingly thin until their transverse dimension approaches the grid width.
The energy spectra of the lateral flow in the stable layer (panel (b) of Fig. 6) feature a Kolmogorov-like power law in a short range of intermediate , and flatter and steeper scalings at low and high , respectively. The magnetic spectra are similar to the velocity spectra, though at they possess less power by about two orders of magnitude. In this part of the spectrum, the spectral magnetic energy, though larger than in the PCNV region, is still less than the spectral kinetic energy. Both energies are at a level much lower than that of the velocity field in the convective region.
If the resulting field structure remains frozen into the matter throughout the further evolution, the newly-born neutron star would possess a fairly peculiar field structure, where the observed surface and crustal field is enhanced w.r.t. the layers underneath and has a strong non-radial component. If this geometry does not change during the subsequent evolution, it might lead to a neutron star whose surface is shielded from external flows by a strong magnetic field. Furthermore, the magnetic energy stored in the layers of a non-radial surface field of alternating polarity (for Model B10 of the order of ) might be released by reconnection and trigger explosive events in the magnetosphere.
Whether or not this field geometry develops in a more realistic model, in which the three main restrictions of our simulations–neglect of neutrinos, axisymmetry, and low resolution–are removed, remains to be seen in future models.
4.2.2 The post-shock region
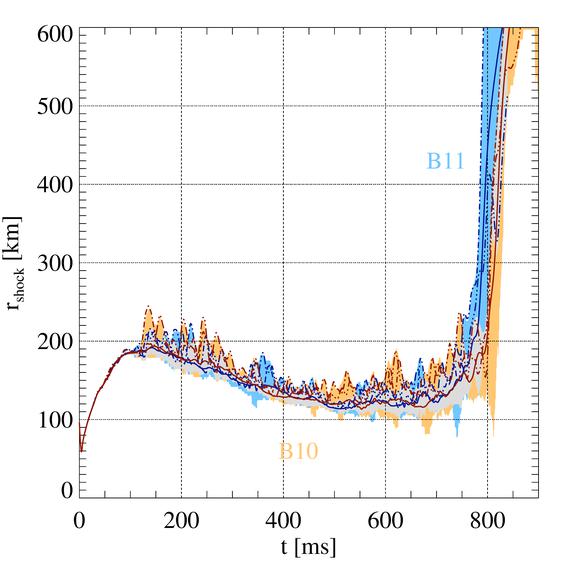
The magnetic field of Models B08, B10, and B11 is too weak to lead to significant changes in the behaviour of the post-shock region (see Fig. 3 for the evolution of Model B10). In Fig. 7, we present the evolution of the minimum, maximum, average and polar shock positions of the two models, and the right panels show the decomposition of the shock radius of Model B10 into spherical harmonics during the post-bounce evolution. Similarly to Burrows et al. (2012), we compute the expansion coefficients, , from the shock position as a function of angle, , as
| (15) |
Again, the shock stalls early and recedes, while showing a varying degree of non-spherical oscillations. After , the shock radius stabilises at values just above . The early shock phase is fairly spherical with small amplitudes of low-order modes. The dipole mode, , grows until reaching saturation around . Around , the dipole mode shows a minimum. Afterwards, shock oscillations become more violent, and, most prominently, large dipole modes with a significant quadrupolar contribution develop. Eventually, these oscillations evolve into a coherent expansion of the shock wave across all latitudes, signifying the onset of the explosion. For both models, this happens at almost the same time, insignificantly later than in the non-magnetic model. We do not attribute this short delay to the presence of the magnetic field; instead, it is the result of the stochastic nature of the non-radial flows governing the oscillatory motion of the shock wave.
The post-shock magnetic field is amplified by flux-freezing accretion and by the turbulent flows behind the shock. For the latter, two primary sources exist, viz. convection and the SASI. Though a detailed analysis of the relative importance of these two instabilities would be interesting and might be crucial for understanding the explosion mechanism, we do not focus on this here and limit ourselves to those aspects most relevant for the magnetic field. We note that Fernández et al. (2014) have emphasised that a SN explosion is intimately linked to the presence of large-scale bubbles of high entropy (see also Hanke et al., 2012; Couch, 2013; Dolence et al., 2013). Depending on the prevalence of convection or the SASI, different possible formation mechanisms exist for these, allowing for a multitude of explosion scenarios.
First, we will discuss the amplification of the field in the phases before the explosion develops. We can identify several effects contributing to the amplification of the magnetic field. We simplify the discussion by assuming a magnetic field that is either completely radial or completely non-radial; the former is a good approximation outside the shock (cf. Fig. 9). The radial dependence of the two types of fields follows from two different constraints. The divergence constraint fixes the form of a purely radial field to , which can hold only for . For a non-radial field, the magnetic flux frozen into the surface of a fluid element, i.e. the surface integral of , will be conserved during the collapse. Based on this, we can obtain two estimates for the field amplification by compression:
-
•
From flux freezing, we find that the magnetic field of a fluid element at mass coordinate scales as .
-
•
The density scales as , which we can combine with the above estimate to a scaling .
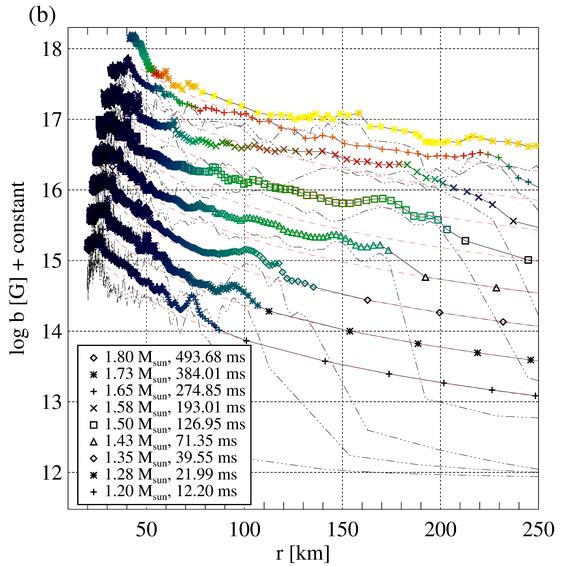
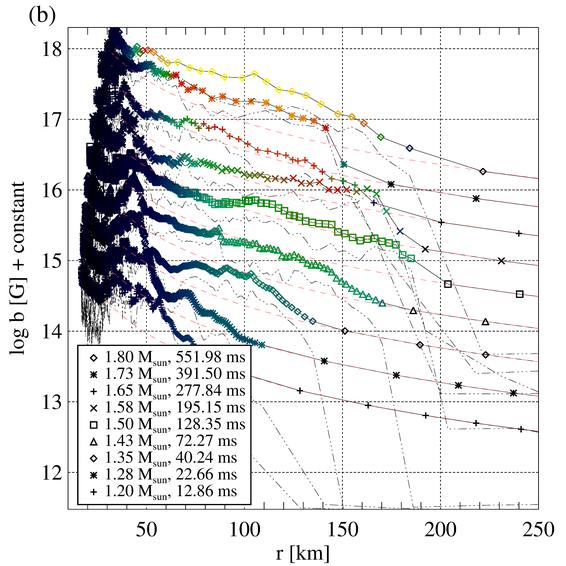
Both scaling laws are fulfilled very well at the centre of the core, but only approximately valid at intermediate mass coordinates (). A better description would require us to take into account the dynamics of the collapse. Though this task would be simplified by the simple homologous velocity profile, we do not perform it here, but use simple empirical findings for the scaling field profile. At all mass coordinates, an average of the two is a good estimate for amplification by collapse for the specific field profile developing in our models (dashed lines in Panel (a) of Fig. 8). By comparing the actual profile to this estimate, we can assess how much extra amplification is provided by other mechanisms.
When a fluid element falls through the shock wave, a non-zero -component of the field is formed (see Fig. 9). Across the shock, the field lines are bent way from the shock normal, and the -component of the field is amplified strongly at the shock, although it remains on average weak compared to the radial one, leading to an overall small amplification factor for the total magnetic field. At late times, the pre-shock field, though still almost perfectly radial, locally possesses a significant component parallel to the shock wave because the shock deviates considerably from spherical symmetry (cf. Panel (e) of Fig. 9), leading to a more pronounced shock amplification. Averaged over all latitudes, the jump of the field strength across the shock wave is only moderate and amounts to an amplification factor of the order of a few . Thus, the shock wave does not prominently show up in the profiles of the magnetic field shown in the profiles of the field strength displayed in Panel (a) of Fig. 8.
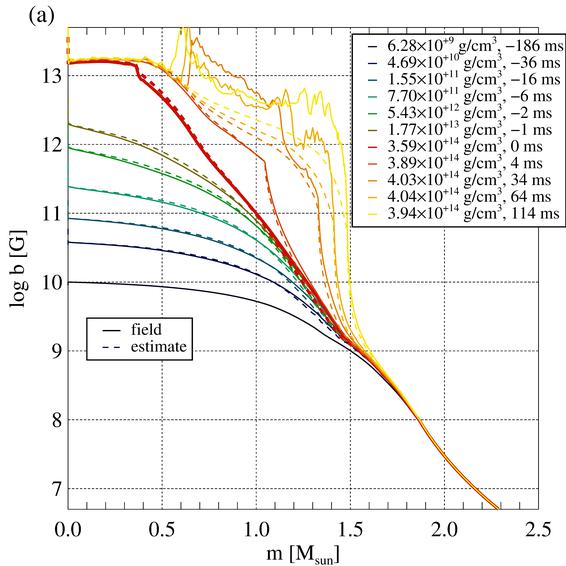
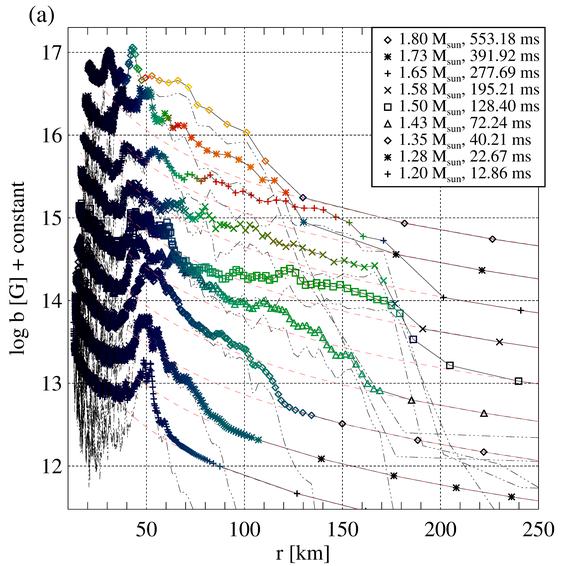
The amplification by the post-shock flow is much more pronounced. The yellow lines in the top panel of Fig. 4 show the mean values of the flow velocity and the Alfvén speed in the GAIN layer. Due to the hydrodynamic instabilities, this region exhibits the highest flow speeds of all post-bounce regions. The magnetic energy, indicated by the Alfvén velocity, is about four orders of magnitude lower. After an initial rise in the Alfvén speed before , both lines are roughly parallel. This suggests that the field amplification by the flow is strong initially, while afterwards the amplification factor does not vary strongly.
Soon after bounce, we find field strengths clearly in excess of our simple estimate for compressive amplification (see the orange and yellow lines in Panel (a) of Fig. 8). Since the hot-bubble region appears very compressed in profiles presented as a function of mass coordinate, we continue the discussion with Panel (b) of Fig. 8: The enhancement of the field strength of a fluid element w.r.t. the compression estimate (dashed lines) remains high for all mass shells until the onset of the explosion. We cannot state the definite reason for the difference between the decay of the field in the PNS and the sustained strong field in the hot-bubble region, but we tentatively argue for the importance of the advection of magnetic flux through the shock wave.
Above, we noted that very little injection of magnetic flux into the PCNV region of the PNS occurs, and what little there is, happens in a geometry that limits the efficiency of field amplification quite severely. Across the shock, the situation is completely different. The radial infall provides a continuous inflow of magnetic flux into the unstable region. Furthermore, a slow but steady accretion flow superposes the vortical motion behind the shock wave, in contrast to the essentially vanishing radial velocity in the PCNV region. The presence of the radial velocity has a number of important consequences for the development of hydrodynamic instabilities as well as for the magnetic field:
-
•
The development of convective structures has to compete with the accretion of matter through the unstable region. As pointed out by Foglizzo et al. (2006), convective cells will only grow from seed perturbations if their growth time is smaller than the advection time by a factor of .
-
•
Radial accretion forms a crucial part of the advective-accoustic cycle responsible for the development of the SASI (Foglizzo et al., 2007; Guilet & Foglizzo, 2012). The superposition of two instabilities, convection and the SASI, leads to more complex flows than in the PCNV layer with far less stationary, unstable cells. This is also reflected in the shape of the outer boundary: spherical for region PCNV, deformed for the GAIN layer.
-
•
We already noted the large-scale advection of radial magnetic flux into the unstable region across the shock wave. Even if all other conditions were the same as in the PNS, this might eventually lead to a steady state characterised by a balance between convective flux expulsion and advective flux injection.
-
•
The geometry of the field is rather different from that in the PNS. In the latter, fluid elements spend a very long time trapped in the vortical motion, and the field frozen into the flow is wound up into increasingly thin structures, which finally are disrupted by (numerical) resistivity. In the gain layer, on the other hand, a fluid element spends only a limited time, and the attached magnetic field lines are not stretched in as many turnovers as in the PCNV layer. This has two opposing effects: on the one hand, it limits the maximum amplification, but, on the other hand, it prevents the creation of structures near the grid resolution limit susceptible to resistive disruption.
All of these factors contribute to the specific evolution of the field in the hot-bubble region. Conditions for the development of the convection in the post-bounce accretion flow and typical properties of the convective flows were given by Foglizzo et al. (2006) For marginally unstable flows , which is approximately fulfilled in our model ( is the entropy scale height), they estimate that modes of degree should grow. In our case, this translates into convective structures extending over a length scale roughly around , in decent agreement with our simulation (see Panels (a), (b), (c) of Fig. 9).
In the unstable region, we can determine estimates for the source term in the evolution equation for the magnetic energy density,
| (16) |
The r.h.s. of this equation describes the growth of the magnetic energy density by work the flow does against the Lorentz force. It consists of a compression term (work against the magnetic pressure) and an anisotropic stretching term (work against the magnetic tension). We are mostly interested in the latter, because this is the term behind the excess of the field strength w.r.t. the compression profiles (dashed lines in Fig. 8, Panel (b)).
To get an order-of-magnitude estimate, we can approximate the growth of the magnetic energy locally as , where and are typical velocities and length scales of the unstable flow. Thus, the field grows on a time scale . The growth of the field in a fluid element has to compete with the advection of the fluid element through the gain layer, since amplification can only occur as long as the fluid element is inside the unstable region. Thus, we can get an estimate of the amount of field amplification by comparing to the dwell time of mass in the gain layer, . We can relate the dwell time to the mean accretion velocity fairly straightforwardly, , but the estimate of the stretch time is hampered by the uncertainty of and . If we could get estimates for them, we could translate them into a simple formula for the amplification factor of the field for a given fluid element, i.e. the ratio between the field strength after amplification by the turbulent flow and the field strength in the absence of turbulence (but including compression), :
| (17) |
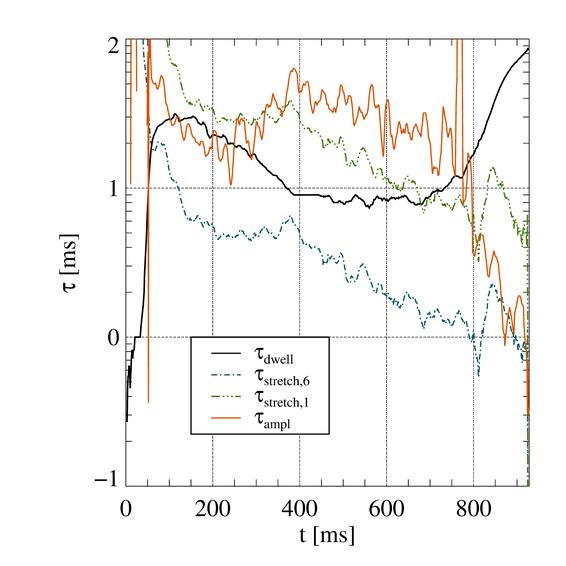
To use typical values of our model, we estimate from the mean velocity of convective eddies from the kinetic energy of the GAIN region and from the mean -velocity in this region. The length scale, , is even less well constrained. For this reason, we compare the dwell time to two estimates for the amplification time, one using , i.e. relatively small modes typical for convection, and , i.e. large-scale modes which might be more characteristic for the SASI. The two curves for (Fig. 10 resulting from the two approximations) should limit the true value of the stretching time scale from below and above. Since the flows in the model show a small-scale pattern first (see Panels (a,b,c) of Fig. 9) and large-scale flows later (Panel (d)), the dwell time (solid line) should be compared to the lower, dash-dot-dot-dotted line for early , and to the upper, dash-dotted line at late . We find that the amplification time is always of the same order as, and usually less than the dwell time, which would translate into a moderate amplification of the field in the GAIN layer, as we observe in the simulations. To test the quality of our simple considerations, we show the actual amplification time scale, , in the same figure (red line of Fig. 10). For each angularly averaged mass shell in the gain layer, we divide the magnetic energy by its time derivative and average the resulting amplification time over the time the fluid element spends in the gain layer.
Though the agreement is not overwhelming, we find that the time-scale criterion reproduces the order of magnitude and the trends reasonably well. The amplification time is longer than the estimates (dashed lines), because the actual efficiency of amplification is reduced by the advection through the gain layer. During the entire post-bounce evolution, we find an amplification factor varying around a value . At first, when the advection is slow and high-order convective modes dominate, the real amplification time is short. Later, when the advection is comparably fast and the unstable flow is dominated mostly by low-order modes, the amplification time grows before starting a slow secular evolution to shorter time scales again as the stretching time decreases.
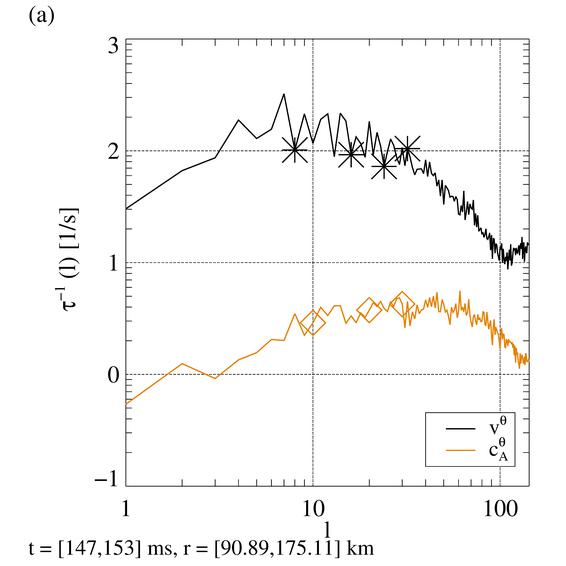
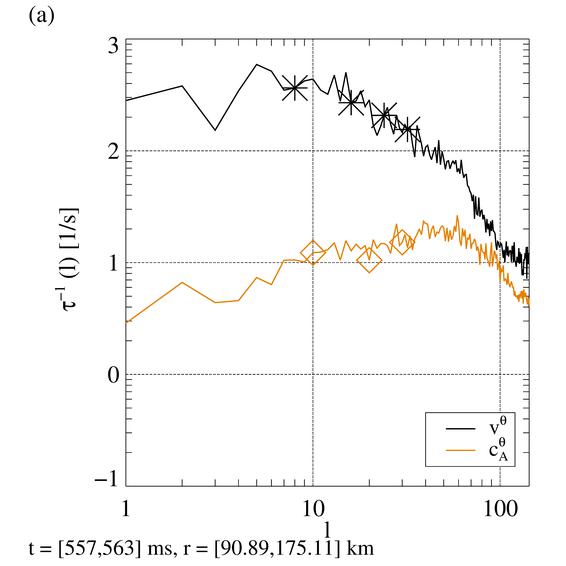
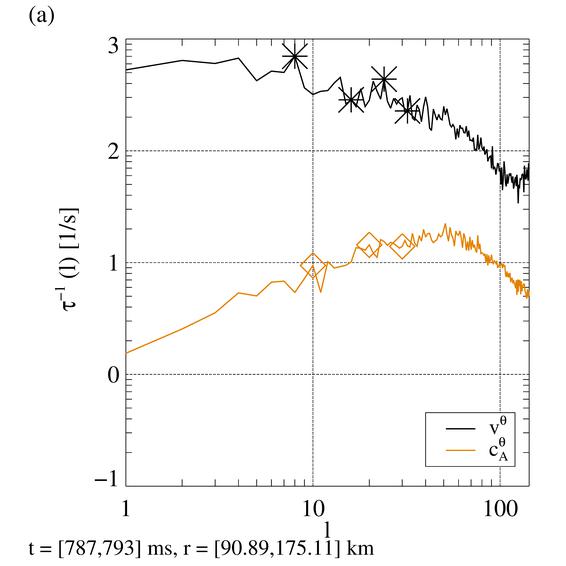
The time evolution of the spectra corroborates the assumption of a shift from modes of intermediate to the dipole mode which we used in the discussion of the field amplification time scale above. We can check this more quantitatively by converting the spectral energy density of the velocity field into an estimate for the typical turnover time scale for modes of given , ( is the angularly averaged mass density), which is in decent agreement with the above estimates for . The inverse of this quantity is shown in Fig. 11. At , the overturn time for dipole and quadrupole modes is greater than the minimum value of in the GAIN layer, which we find at modes around . Later, decreases most strongly for the lowest-order modes, leading to overturning times for the dipole mode that are similar to those at intermediate .
Hence, stretching of field lines should become more efficient at generating large-scale fields. Very strong power in the dipole mode can be encountered mostly in the lower radial range of the unstable region. At higher radii, the spectrum of the magnetic field for the largest modes is below the Kolmogorov scaling.
We summarise the most important points:
-
•
The largest contribution to field amplification comes from the radial infall. We can characterise the resulting field, dominated by the radial component, by simple, smooth functions of radius (see dashed lines in both panels of Fig. 8).
-
•
After the development of strong non-spherical deformations of the shock wave, the (mostly radial) pre-shock field is amplified at the shock wave, contributing on average a few to the total amplification.
-
•
On top of this, the post-shock instabilities amplify the field and generate a strong -component. The factor of amplification of the field is the result of a competition between vortical flows and the advection of magnetic flux out of the unstable region. Thus, we can quantify the efficiency of this process roughly by the ratio of the time scales of the turnover motion and the accretion. In our case, this competition leads to an amplification factor around 5…10.
-
•
The magnetic energy remains much smaller than the kinetic energy in the gain layer since the termination of the amplification is set by the aforementioned competition of time scales and not by back-reaction of the field onto the flow.
-
•
The magnetic field, amplified during its passage through the gain layer, accumulates in the stable layer outside the PNS and forms sheets of mostly lateral field. Here, the magnetic field has an energy comparable to the kinetic energy of the matter, which is almost at rest; however, it is still weak compared to the internal energy and, thus, has little effect on the structure of the layer.
-
•
The spectrum of the velocity and the magnetic field in the unstable region follow a Kolmogorov scaling for a limited range of mode numbers between and but are separated by three orders of magnitude. At no mode number (except in the dissipation range) do we find energetic equipartition between the flow and magnetic field.
4.2.3 Dependence on resolution
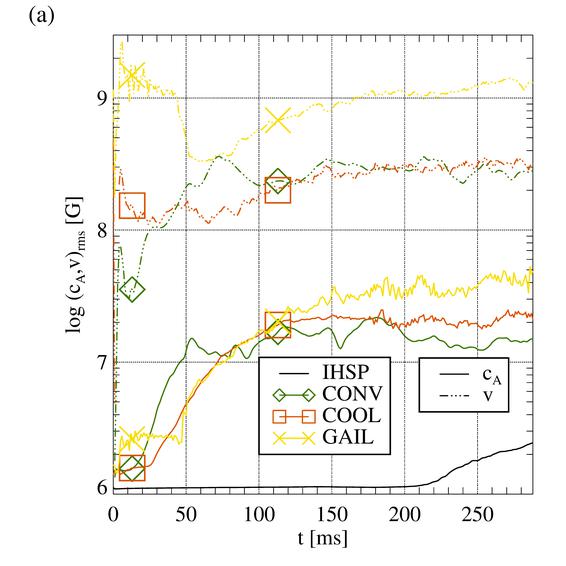
In order to assess the sensitivity of our results to numerical resistivity, which depends crucially on grid resolution, we resimulated model B10 on a grid of zones. Like in the simulation described above, the uniform grid width in the centre was , but outside of this region the grid is finer by a factor of 2 in radius and in angle than in model B10. The increased computational costs of the high-resolution simulation restricted us to run only up to a post-bounce time of . The change in resolution leaves the dynamics mostly unchanged. We show the time evolution of the average values of the flow and Alfvén speeds in Fig. 12. Compared to model B10 (Fig. 4, Panel (a)), the modifications are only minor. The most prominent difference concerns the Alfvén velocity in the GAIN region: comparing the two simulations at , the volume average of the high-resolution version is larger by a factor of about . This result can indicate either a higher saturation level of the amplification or a more rapid growth of the magnetic energy (note that it grows during the entire post-bounce phase of the simulation for our standard resolution).
4.2.4 Other weak-field models
Neither a decrease of the initial field strength by two orders of magnitude () nor an increase by an order of magnitude to leads to significant changes of the evolution. The mechanism of field amplification as well as the dynamic feedback is almost the same, although, of course, the details of the stochastic flows show differences. Consequently, the onset of the explosion and the time at which the shock starts to expand are very similar. The factors by which the magnetic field is amplified are essentially the same as discussed above. The only exception to the resulting scaling with is due to an artifact of our axisymmetric models, viz. the strong radial field along the polar axis.
4.3 Strong initial magnetic field
A very strong initial field of leads to a very different evolution of Model B12. Most prominently, shock runaway occurs about 400 ms earlier than in Model B10. We will contrast the evolution of the two models in the following.
4.3.1 The proto-neutron star
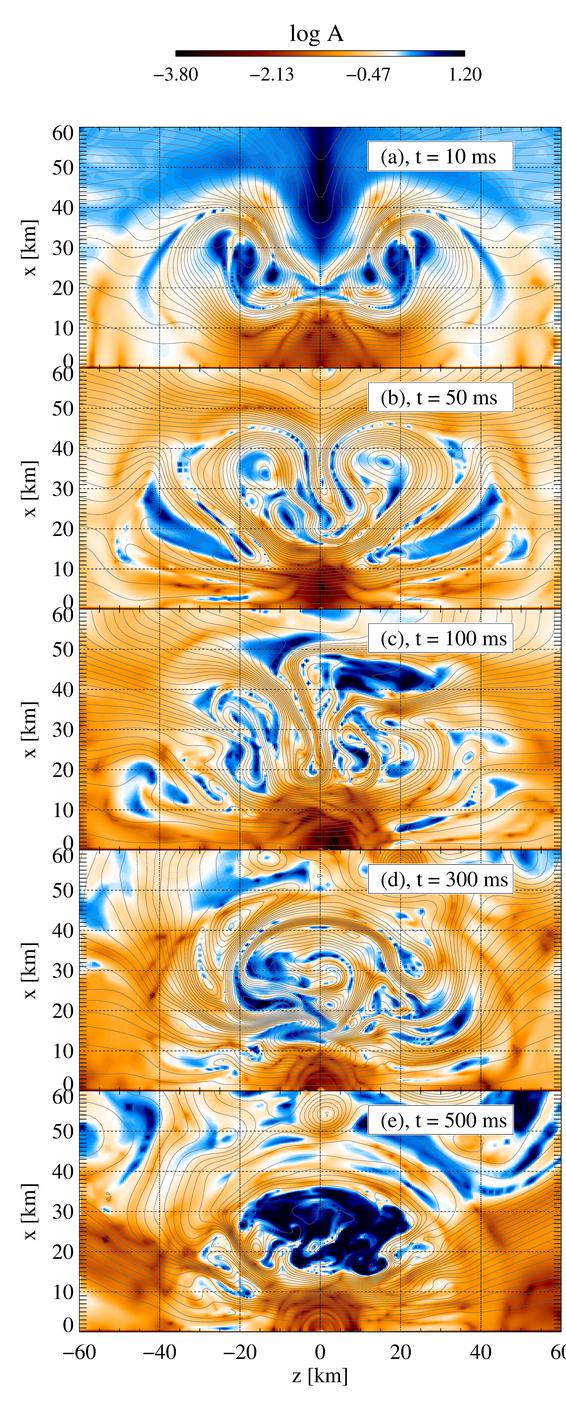
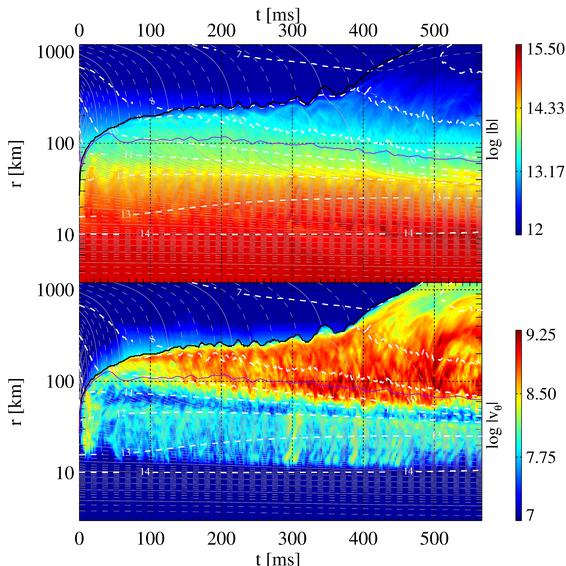
A large quadrupolar vortex develops outside the stable core at radii between 15 and 50 km immediately after bounce. We show this pattern in Panels (a) and (b) of Fig. 13, displaying the Alfvén number of the flow and the magnetic field lines at and , respectively. While this transient still lasts, a sustained convective flow develops. During the entire evolution, the outer boundary of the convection zone contracts at a rate very similar to Model B10 (see Fig. 14). Because the magnetic energy is much less than the thermal energy, the thermal structure of the core (density, entropy, electron fraction) is hardly modified by the presence of the field.
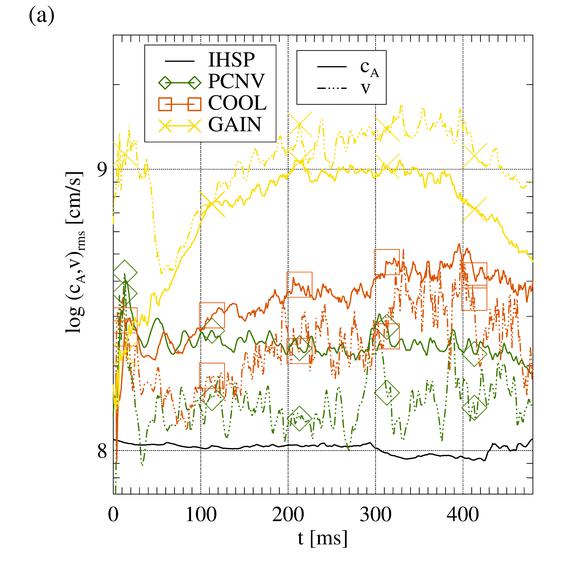
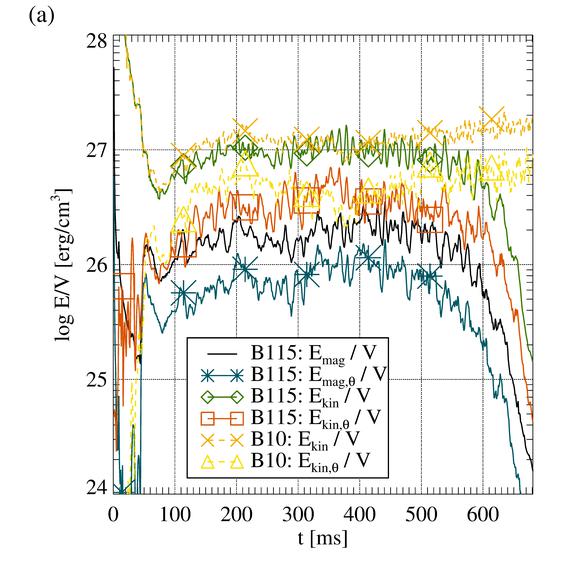
The velocity and the magnetic field, on the other hand, differ strongly from those in Model B10. We show the evolution of the angular averages of the Alfvén and the flow speed in the post-shock regions of the core in Panel (a) of Fig. 15. Except for the innermost stable core, where the velocity is essentially zero, the kinetic and magnetic energies are near equipartition. In the PCNV region (green lines), the flow of the strong-field model is slower than the Alfvén speed by a factor of around 2. Furthermore, it is also slower than the convective flow in the PNS of Model B10, which can also be seen in the lower halves of Fig. 3 and Fig. 14.
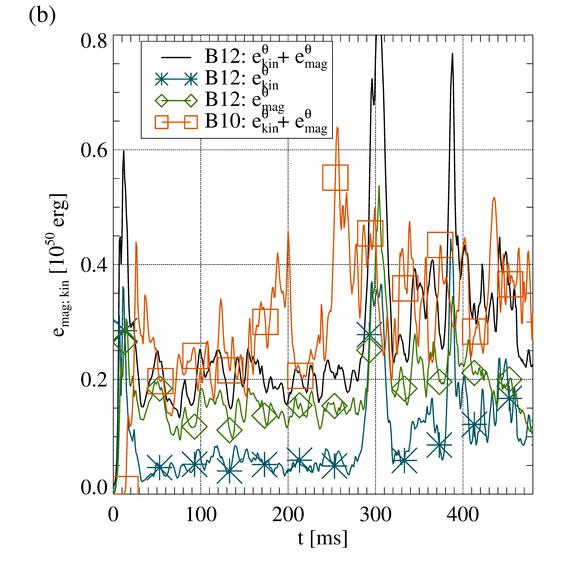
In Model B12, where the magnetic field cannot be neglected, we expect to find a reduction of the kinetic energy w.r.t. Model B10, for which very little of the kinetic energy of this model is used to amplify the seed magnetic field, allowing convection to run at the maximum kinetic energy that can be attained given the thermal structure of the core. The reduction is caused by the conversion of kinetic to magnetic energy and due to the suppression of turnover motions by the tension of a magnetic field close to equipartition. The sum of the kinetic and magnetic energies generated by the instability, on the other hand, should be roughly the same. Panel (b) of Fig. 15 compares the time evolution of the energies of the -components of the velocity and the magnetic field in the PCNV region of Model B12 to Model B10. The total convective energies (black line and red line with squares) are approximately equal, though with a wide range of fluctuations, but for the strong-field model, the convective region is magnetically rather than kinetically dominated. We note that we get somewhat different values if we include the radial components. Even without additional convective amplification, the radial field is very strong, in particular along the -axis, and thus the total magnetic field in the PCNV region is considerably stronger than the total convective energy of Model B10.
The ratio between kinetic and magnetic energies is reflected in the large sub-Alfvénic regions in the PCNV region at all times (red colours in Fig. 13). In particular, the magnetic field dominates over the flow in a wide column parallel to the symmetry axis. Magnetic tension is sufficiently strong to suppress turnover motions in this region to a high degree. Closer to the equator, the magnetic field is weaker, and a certain amount of convective activity is possible. At , we still find the imprints of the early quadrupolar vortex, but later, it is replaced by smaller overturns.
Later (), the magnetic field is concentrated into several narrow radial flows, between which the field is rather weak and the flow is super-Alfvénic. Angular energy spectra of the velocity and the magnetic field show that the lateral magnetic field is close to equipartition throughout the entire spectrum and exceeds the lateral kinetic energy near the dissipation range. Both spectra are flat up to . Up to , the velocity spectra show a power-law scaling close to Kolmogorov, and the magnetic field is slightly less steep.
During the subsequent evolution, larger weakly magnetised bubbles develop transiently, e.g. around (Panel (d) of Fig. 13). At later times, they tend to last for longer times than in the early post-bounce phase. Since the strong radial field suppresses them at the pole, they appear in the equatorial region only. The bubbles are filled by gas of an electron fraction exceeding the angular average and surrounded by sheets of strong magnetic fields (bottom panel of Fig. 13). In the angular averages of the lateral velocity (lower half of Fig. 14), the bubbles appear as phases during which is enhanced to the same level as in Model B10 (the yellow features starting to become visible for ). The most intense of these features show up in the evolution of the magnetic field strength since they lead to a temporary growth of the magnetic energy and a redistribution of the field towards larger radii.
Because of the weak turnover motions, radial profiles of the magnetic field strength (Panel (c) of Fig. 15) show relatively little variation during the post-bounce evolution. In contrast to Model B10, only little field amplification beyond that provided by radial compression takes place, as can be seen in the comparison of the angular averages of the field strength as a function of enclosed mass in Panel (b) of Fig. 18. As in Model B10, overturning eddies can expel the magnetic flux from the convective cells at later times, as can be seen in the last time step shown in Fig. 13, Panel (e). However, because of the smaller convective velocities and because these eddies are only present intermittently, the expulsion is less pronounced: the last time step displayed in Panel (c) of Fig. 15 (yellow line) is only moderately below the profile generated by pure field compression in the infall.
With less flux expulsion, the increased field strength in the stable layers below and above the convection zone is less pronounced than in Model B10–though not entirely absent (in Panel (c) of Fig. 15, see the maximum at at ). The angular average of the magnetic field strength (top half of Fig. 14) does not show the enhancement of the field strength along the upper boundary of the PCNV region that is present in Fig. 3. Radial fields connect the inner core to the hot-bubble region in a wide cone surrounding the polar axis. Closer to the equator, the field has a stronger -component and forms a sheet around the PNS (Panels (d,e) of Fig. 13). In contrast to the weak-field model (Panel (d) of Fig. 5), for which this layer is composed of a stack of thin sheets of opposite polarity, it contains only a lateral field of positive sign.
4.3.2 The post-shock layer
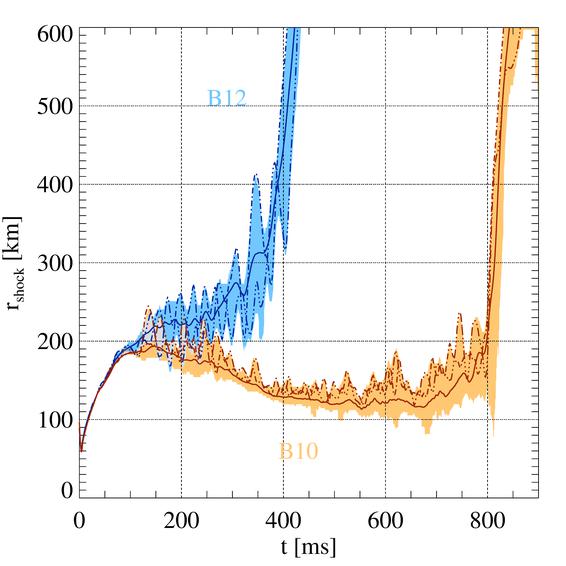
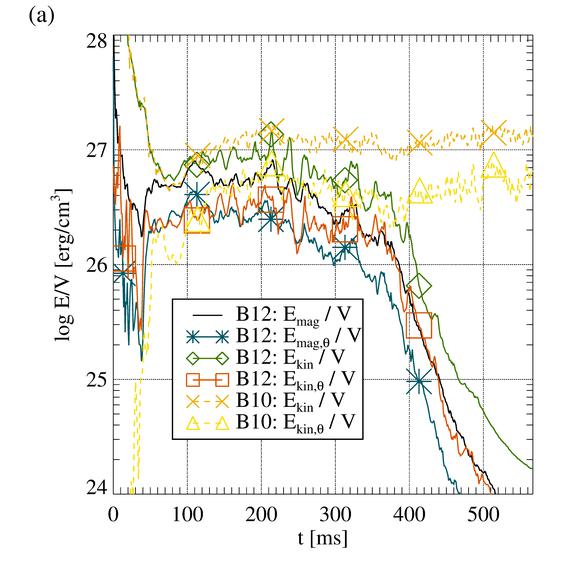
The shock wave of Model B12 begins to deviate from the evolution of Model B10 already earlier than , as shown in Fig. 17. Instead of slowly contracting, the average radius passing an intermediate plateau of before it starts to expand, reaching at . Afterwards, the expansion quickly gains speed, and the average shock radius exceeds after . After the brief period of shock stagnation at , the shock surface becomes highly aspherical, highlighted by the wide blue band displaying the range of shock radii in the model.
The non-radial components of the magnetic field and the velocity have almost the same energy until the shock starts to expand, whereas the mean accretion flow leads to an excess of the radial kinetic energy over the radial magnetic energy, albeit only by a small factor (see Panel (a) of Fig. 18). Compared to Model B10, the lateral energy densities in the gain layer are greater until and on the same level afterwards, and the total (kinetic plus magnetic) energy densities are similar. We note, however, that the post-shock volume of Model B12 is greater than that of Model B10 after . Accounting for this effect, the energies of flow and field in Model B12 are considerably greater.
These data demonstrate that the magnetic field in the gain layer of Model B12 reaches equipartition with the kinetic energy globally (and locally can exceed this level by far). Furthermore, the fact that both energies combined are on the same level as in the weakly magnetised case indicates that the basic mechanisms behind the generation of turbulent velocity and magnetic fields are the same for both models, and that the strong field does not lead to, e.g. an alternative instability tapping into additional reservoirs of energy. Similarly, values of the total stress tensor components are similar in both models, but the distribution between (hydrodynamic) Reynolds stress and (magnetic) Maxwell stress is different. Compared to the internal energy, the magnetic energy is globally weak (a few ), though in the most intense flux sheets the magnetic energy density is closer to equipartition with the internal energy density.
Since the seed magnetic field is already close to equipartition with the flow, the post-shock flow contributes only little to further field amplification. Following the evolution of an angularly averaged mass element as it falls through the shock onto the PNS (Panel (b) of Fig. 18), we find only a modest growth above the estimate for a purely radial infall and a less efficient creation of a -component by the shock and the post-shock flow than in Model B10.
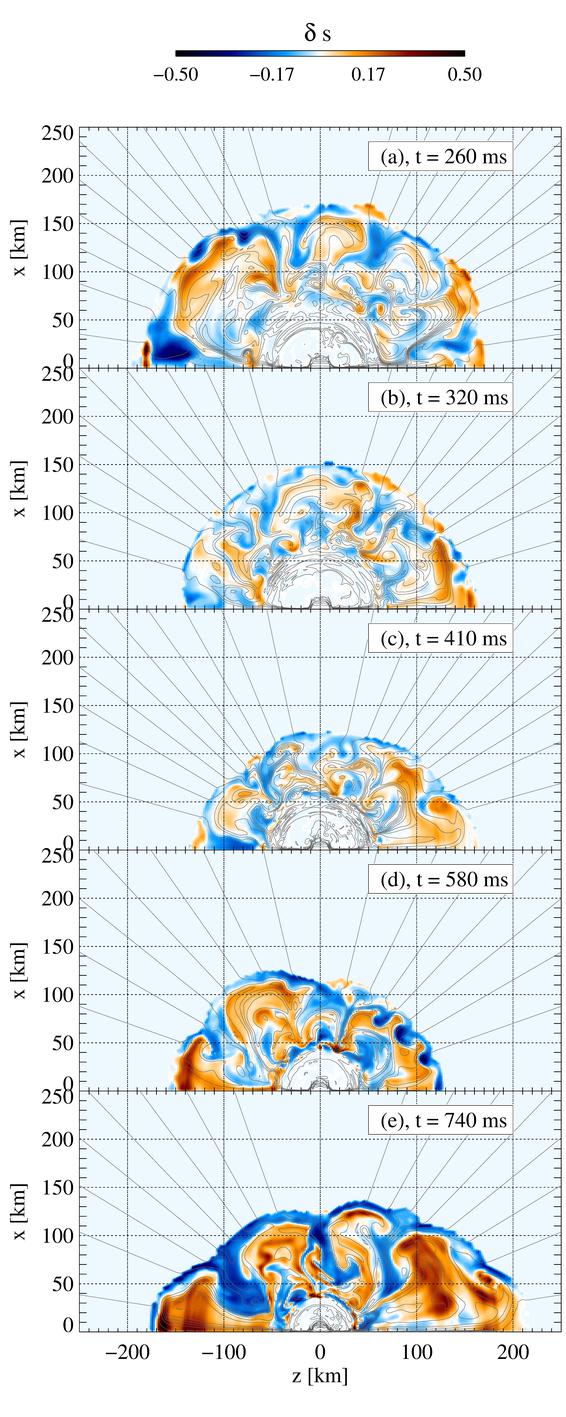
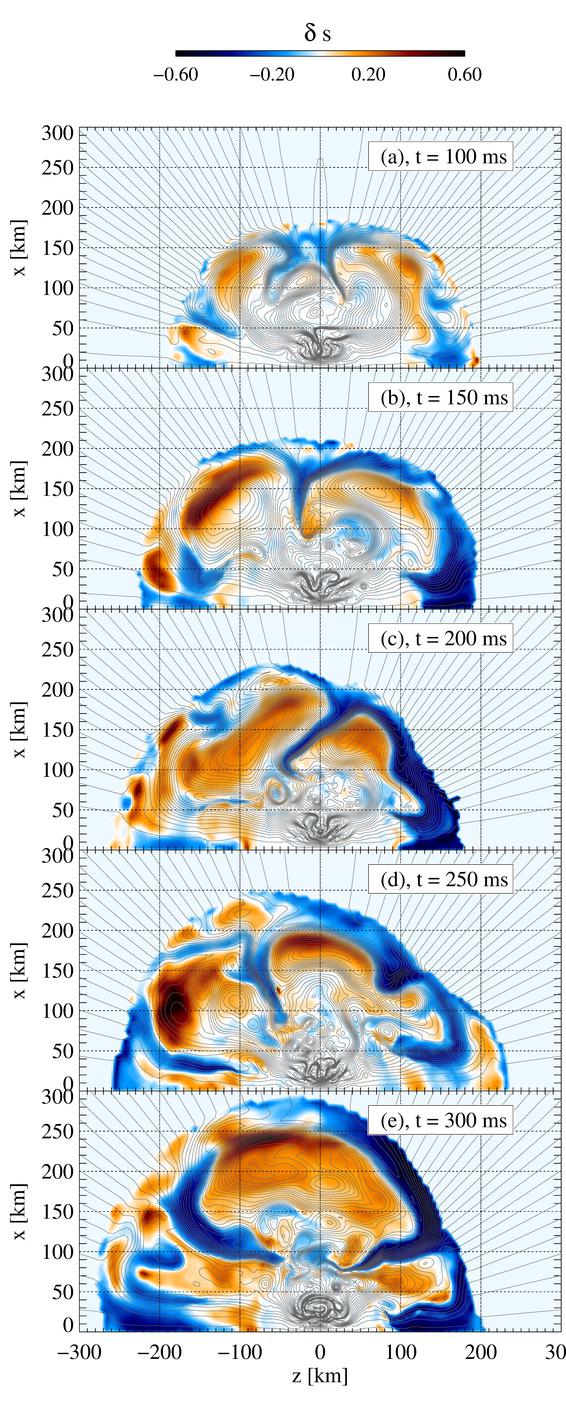
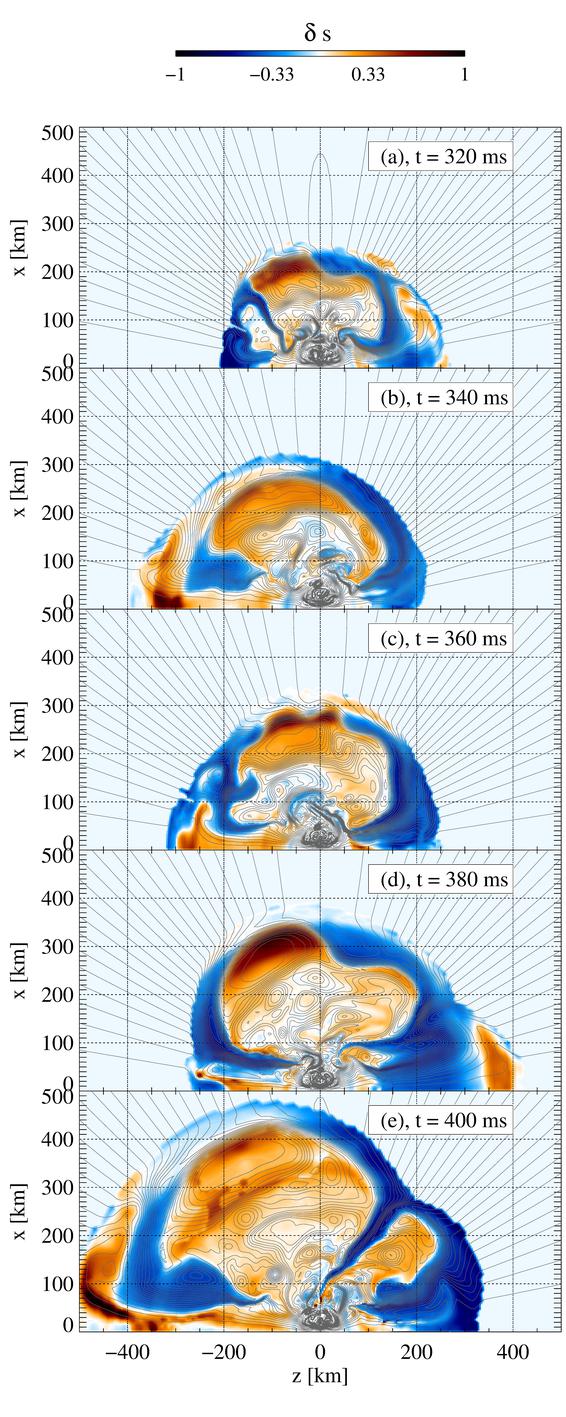
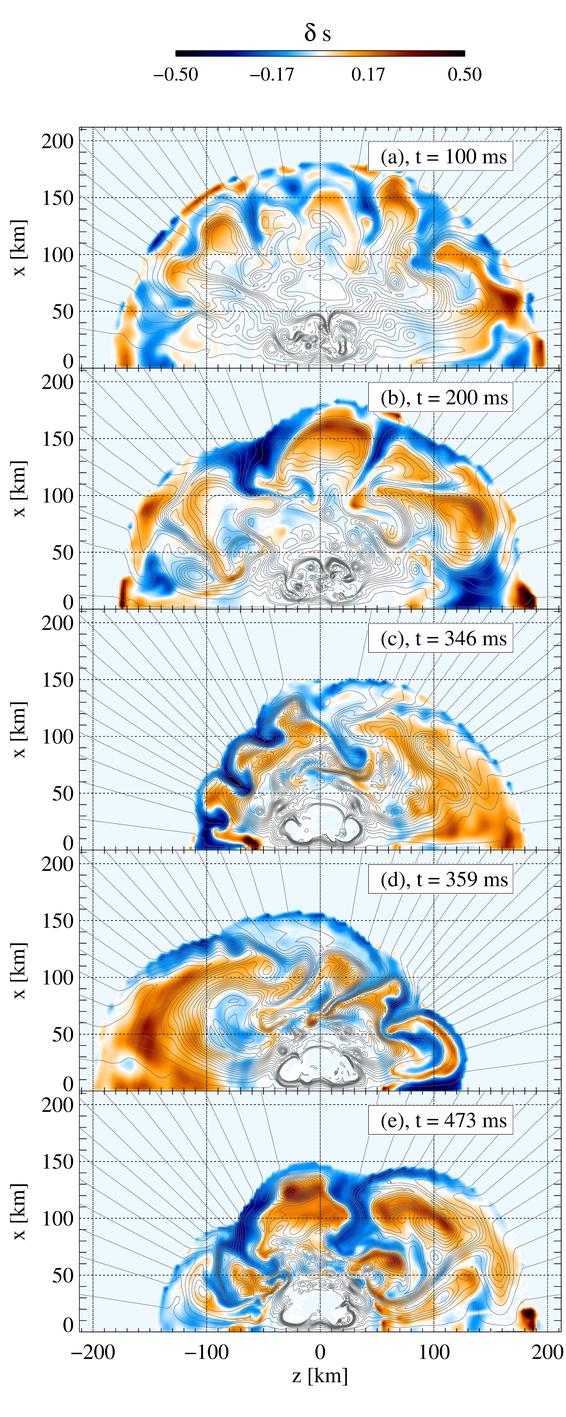
For a detailed discussion of the evolution of the model, we refer to Fig. 14 (time evolution of angularly averaged profiles of magnetic field strength, lateral velocity, and isodensity contours and radii of enclosed mass of the angularly averaged model) and to Fig. 19 presenting a time series of maps of the entropy contrast, i.e. the relative deviation of the entropy from the angular mean,
| (18) |
where the angular average is computed only from post-shock zones.
Similarly to the PNS, the GAIN region right after bounce is dominated by a large quadrupolar vortex resulting from the small imbalance between the pressure profiles at the poles and the equator generated by the magnetic tension during collapse. These flows decay later, and convection and the SASI establish a new pattern of non-spherical flows after . While caused by a different mechanism, these flows show a similar geometry, viz. predominantly large-scale bubbles characterised by an entropy exceeding the angular average. In a visualisation of the entropy contrast, , (Fig. 19) these regions show up in red. The gas inside these bubbles has a small mean radial velocity and, thus, remains trapped for a long time, whereas accretion proceeds mainly through a few narrow downflows at the poles and close to the equator. Sheets of a strong magnetic field with a magnetic energy density exceeding the kinetic energy density of the flow surround the hot bubbles. Directing the matter that falls through the shock wave towards the downflows, these flux sheets shield the bubbles against the infall and suppress their disruption by small-scale turbulence. Consequently, they are responsible for the persistence of the bubbles over long times and the slow, regular shock oscillation.
The accretion flows can be the site of additional field amplification by a mechanism not discussed so far. Along the polar axis, an Alfvén point forms separating super-Alfvénic () accretion at large radii from sub-Alfvénic () accretion at smaller radii. Thus, Alfven waves generated closer to the PNS can travel against the accretion flow up to this point, where they accumulate. Guilet et al. (2011) have suggested that an instability will amplify the waves there, and their dissipation contributes to the transport of thermal energy into the gain layer. We note that our models may only show this effect for an already strong initial field because only then the Alfvén point is located sufficiently far outside the PNS. We find indications for the accumulation of Alfvén waves at this point in the evolution of patterns of the curvature radius of magnetic field lines. Perturbations propagate from the PNS convection zone along the radial field lines close to the poles, until they accumulate at the Alfvén point, leading to an enhanced field strength. We are, however, not able to clearly identify the contribution of this mechanism to field amplification or heating because the field is already very strong there. Thus, we leave this issue open for further study.
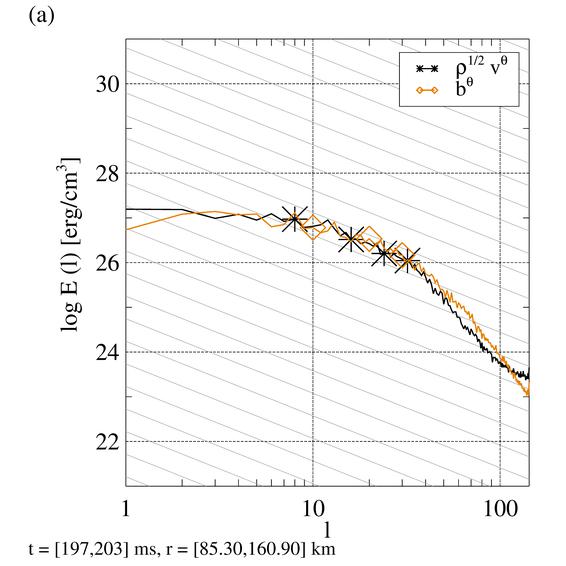
To explore the dynamics of the gain layer of Model B12 in spectral space, we compare the coefficients of the expansion of the transverse components of the magnetic field and of the flow velocity into spherical harmonics in the lower GAIN region in Fig. 20. These variables show an extended flat spectrum up to and a Kolmogorov scaling up to a higher mode number . The energy spectra of the lateral components of velocity and magnetic field are close to equipartition across the entire range of wave numbers. Besides a roughly equal energy between field and flow, this indicates that the components of the stress tensor due to advection and the Lorentz force acting on structures corresponding to a spectral mode of degree balance each other. In particular, the magnetic tension force resisting the bending of field lines is of the same order as the hydrodynamic forces and limits the kinetic energy of the turbulence.
4.4 Intermediate magnetic fields
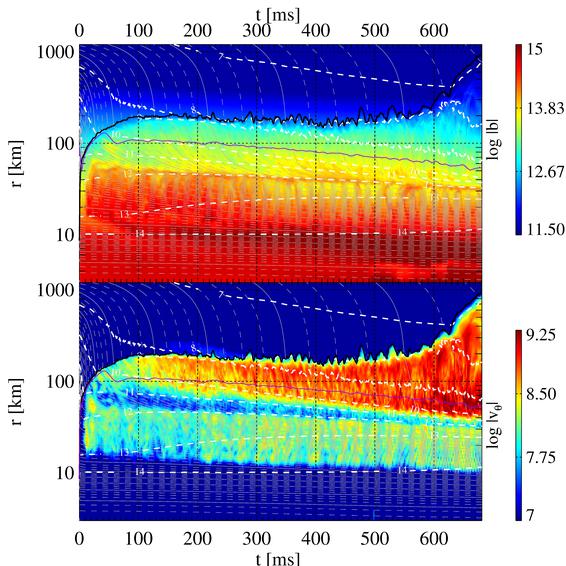
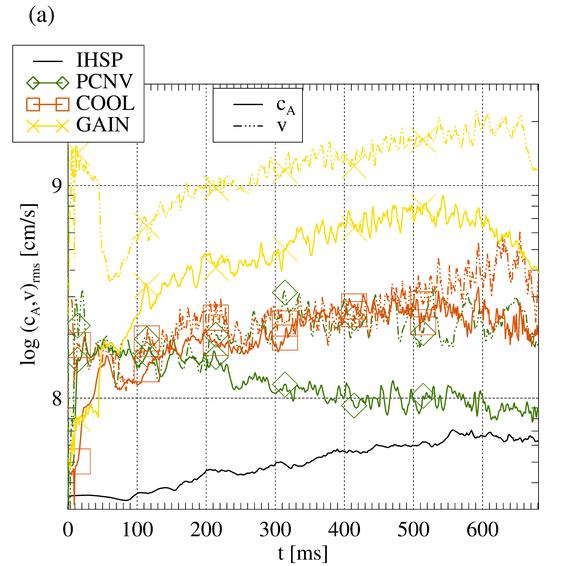
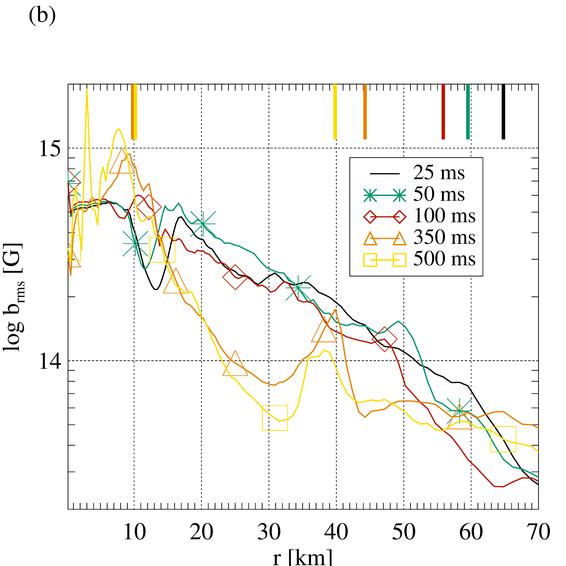
An initial field strength of (Model B11.5; space-time plot shown in Fig. 21) does not modify the dynamics of the PNS significantly. We refer to Panel (a) of Fig. 22 for the time evolution of the mean flow speed and Alfvén velocity across the different regions of the core. Convection develops in the same region as in Model B10. During the first of post-bounce time, the flow and the magnetic field are close to equipartition in the PCNV layer (green lines), but afterwards expulsion of the magnetic flux leads to a decrease of the magnetic energy, whereas the kinetic energy grows and achieves an energy comparable to the weakly magnetised case. As a consequence of flux expulsion, the PNS at late times exhibits two layers of enhanced field strength at the bottom and top of the PCNV; see the profiles for in Panel (b) of Fig. 22 and the upper half of Fig. 21. The layer at the outer boundary of the PNS contains a mostly lateral field, except for high latitudes, where it is dominated by an intense radial field strong enough to locally suppress convection.
The evolution of the post-shock region combines elements from models with weak and models with strong fields. Unlike in Model B12, the magnetic field is below equipartition during the entire evolution, in terms of both the modulus and the component, though only by a factor of roughly four, as we show in the overview of the time evolution of the partial energies in the GAIN layer in Panel (a) of Fig. 23. Thus, the field interferes less with the development of hydrodynamic instabilities than in Model B12, and the kinetic energy reaches, on average, the same level as in Model B10 (dashed lines in the figure). We examine the resulting field amplification in Panel (b) of Fig. 23, which follows the mean field strength of mass elements falling at different times through the shock onto the PNS. While the shock wave enhances the -component, but does little to the total field strength, both components of the field grow in the overturning vortices behind the shock. The properties of these flows are similar to the weakly magnetised case, leading to a similar amplification factor.
Snapshots of the 2D structure of the model (Fig. 24) show elements both from Models B10 and B12. The early flow is characterised by small-scale features (Panels (a) and (b)) in the flow as well as in the field, similar to the weak-field case. Later (Panels (d) and (e)), larger bubbles reminiscent of the ones in Model B12 (cf. Fig. 19) develop, surrounded by narrow downflows and shielded by strongly magnetised sheets, and the shock assumes a strongly non-spherical shape.
4.5 Comparison between models
4.5.1 Magnetic properties
We list important parameters of our models in Tab. 1: apart from the initial field strength, , we present time averages (over ) of the mean field strength in the four regions defined above. Moreover, time-averaged (over ) ratios of magnetic energy to internal energy and to kinetic energy in the same regions, and , respectively, are listed. We have selected this interval since none of the models is close to an explosion at that time.
The distribution of the magnetic field strength summarises the patterns discussed in the previous sections. The innermost stable region has a dynamically negligible magnetisation with reaching for Model B12, corresponding to an average field strength of . In this region, the velocity is essentially zero after bounce, suppressing all mechanisms of field amplification except for compression during collapse. Hence, the field has almost the same geometry as in its initial state, and the mean field strength is roughly proportional to .
Models with weak initial field (B08, B10, B11) develop a PNS convection zone (PCNV) in which the field is at first amplified passively (Model B11 reaches only a magnetic energy of of the convective kinetic energy), but later expelled from the PCNV layer and accumulated at its lower and upper radial boundaries as well as at the symmetry axis. In the limit of a passive field, which does not react back onto the flow, the evolution of the field strength depends only on the properties of the flow such as eddy sizes and turnover times. Hence, the factor by which these processes change the magnetic field strength should be independent of the seed field. The proportionality is violated in our models: stronger fields (B11) are amplified less than weaker ones. This violation occurs mostly at the polar axis, where the assumed axisymmetry leads to the formation of an artificially strongly magnetised column. The stronger the initial field, the more the field amplification is limited by the suppression of convection by magnetic tension.
If we take the values in the COOL region as approximations to the surface field of the PNS, we get values that are compatible with most pulsars (weak-field models) or on the upper end of the field distribution with magnetar fields of order (strong-field models).
In the GAIN layer, we find similar trends as in the PCNV region. Weak fields are amplified by a constant factor, while strong fields reach energies close to the kinetic energy and, thus, are limited by dynamic feedback. The artificial effect of the axis on the field amplification affecting the results in the PNS is less of an issue here (the mean field and the parameters are closer to proportionality to ) since the combination of advection, SASI, and convection does not favour the development of stationary convective cells similar to those found in the convective layer of the PNS.
| Model | B08 | B10 | B11 | B11.5 | B12 |
|---|---|---|---|---|---|
| [G] | |||||
| 0.000225 | 1.08 | 9105.42 | 1149.13 | 677.40 | |
| [G] | |||||
| 0.00614 | 0.0476 | 0.32 | 1.42 | ||
| [G] | |||||
| 0.00435 | 0.15 | 0.64 | 2.97 | ||
| [G] | |||||
| 0.000626 | 0.0411 | 0.15 | 0.59 |
4.5.2 Neutrino emission
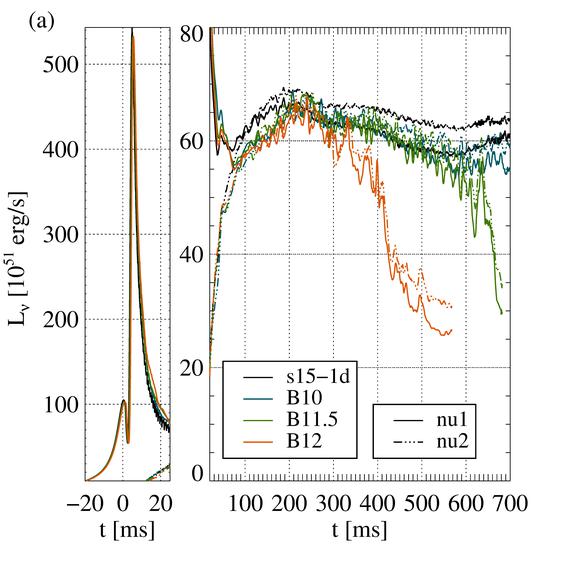
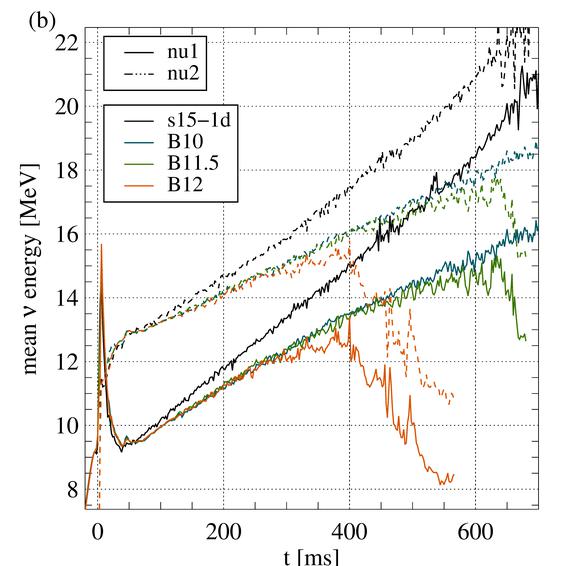
The total neutrino luminosities emitted by the core of three of the magnetised and the spherically symmetric models are presented in Panel (a) of Fig. 25. For all models, increases gradually during collapse. At prompt shock breakout, we observe the well-known prominent burst of the electron neutrino luminosity. The burst in the figure is located not right at bounce but at a somewhat later time, ; this is the consequence of the finite propagation time from the inner core where the burst is produced to the radius where we measure the luminosity, . After the short burst, lasting for about five milliseconds (full width at half maximum), the total ( plus ) neutrino luminosity settles to a roughly constant value of the order of . In this phase, electron anti-neutrinos contribute about half of the total luminosity.
All axisymmetric models emit slightly lower luminosities than Model s15-1d during the first after the neutrino burst. This reduction, representing the contribution of PNS convection to the total energy transport out of the PNS (Buras et al., 2006), does not depend on the magnetic field strength. The curves representing the different initial fields lie almost on top of each other for long parts of the evolution until the onset of an explosion causes a decrease of the mass accretion rate onto the PNS and hence a drop of the luminosity, which occurs earlier for models with stronger initial fields since, as we will describe below, the explosion time is correlated to the magnetic field strength.
The average energies (Panel (b) of Fig. 25) of electron neutrinos and anti-neutrinos increase in this phase to values of and MeV at , respectively. Because of their weaker interaction with the surrounding matter, the anti-neutrinos have the tendency to decouple from the gas slightly deeper on average than the electron neutrinos and, therefore, have a mean energy exceeding that of the electron neutrinos by about early on. The mean energies of both flavours increase strongly in spherical symmetry as the neutron star becomes more massive to evolve to collapse (Sumiyoshi et al., 2007, 2008; Fischer et al., 2009). Similarly to the luminosities, the mean energies of the axisymmetric models deviate from the spherical case, but show little difference among each other, except different times of explosion, which are marked by a steep drop of the mean energies.
4.5.3 Explosion in dependence of the magnetic field
Model B10.
The previous discussion of the field amplification was focused mostly on the accretion phase characterised by a steady or slowly receding shock wave. In the following, we will briefly outline the most important features of the final transition to shock expansion and, eventually, explosion.
Discussions of the physics of the onset of explosions very often focus on global quantities such as the total energy in the gain layer and the competition of the heating time scale of matter by neutrinos and its advection onto the PNS (e.g. Thompson, 2000; Scheck et al., 2008; Thompson & Murray, 2001; Buras et al., 2006) or local conditions such as the antesonic condition (Pejcha & Thompson, 2012) connecting sound and escape velocity in the gain layer. The resulting explosion criteria can be translated into a critical curve in the space of the luminosity of neutrinos and the accretion rate of mass onto the PNS, above which explosions occur (Burrows & Goshy, 1993). A steady-state solution for the accretion flow is possible only for a luminosity below the critical one, and the lack of such a solution for higher luminosity leads to shock expansion and explosion (see Fernández, 2012, for a detailed study). These models work best in spherical symmetry or for the spherical () mode of the shock surface in multi-dimensional cores. Non-spherical mass motions due to e.g. convection and the SASI lead to a reduction of the critical luminosity (see, e.g. Janka & Müller, 1996; Herant et al., 1992; Nordhaus et al., 2010; Hanke et al., 2012; Couch, 2013).
Recently, Dolence et al. (2013), and subsequently Fernández et al. (2014), have studied multi-dimensional explosions dominated either by convection or the SASI in the post-shock region. High-entropy bubbles can be generated and destroyed by both instabilities on a wide range of eddy sizes. These bubbles, in turn, can affect the evolution of the SASI and the oscillations of the shock wave. The onset of the explosion is characterised by large bubbles persisting for many eddy turnover times.
We will characterise the explosion of Model B10 along these lines. This will allow us to find features that distinguish this model from the ones with stronger initial fields to be discussed afterwards.
As shown in Fig. 7, the shock wave is mostly spherical as it expands to a radius of 180 km at , although aspherical flows are already present (see Panel (a) of Fig. 9 and Panels 10a,10b,10c,10d of Fig. 26). During the next , strong asymmetries develop while the shock contracts. To quantify these asymmetries, we present the time evolution of the normalised amplitude of the coefficient, , of the spherical harmonics expansion of the shock radius in the top left panel of Fig. 27. The top right panel contains a spectrogram of this variable, i.e. the spectral amplitude at time computed from a Fourier transform of .
We try to connect the deformations of the shock surface to the structure of the post-shock flow. The bottom left panel of Fig. 27 shows histograms of the entropy contrast (see Eq. (18)), i.e. the variable for which two-dimensional maps are shown in Fig. 9, for all post-bounce times. We constructed a linear grid in covering the range between -1 and 4 with 1600 equidistant bins, each attributed with the volume filling factor of all zones in the region between the PNS and the shock wave that possess a certain value of . Typically, the distribution is peaked around because most zones have an entropy close to the mean value. It gradually broadens as bubbles of increasing size develop. Very large bubbles of high entropy surrounded by cold downflows are reflected in a broader distribution with a less pronounced peak.
After , increases, and the bubbles persist for a longer time. The oscillations of break down, and the spectrum exhibits a strong low-frequency component. At this point, the distribution of is very broad, no longer exhibiting a strong peak at . The weakening of this peak correlates with the onset of an increasingly rapid outward motion of the shock radii (Fig. 7).
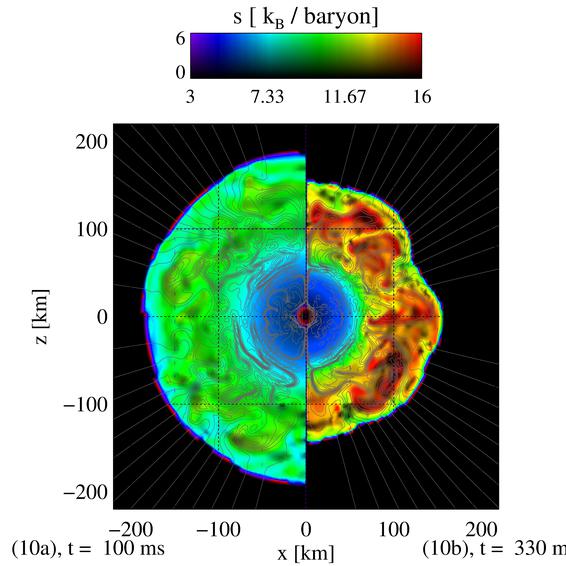
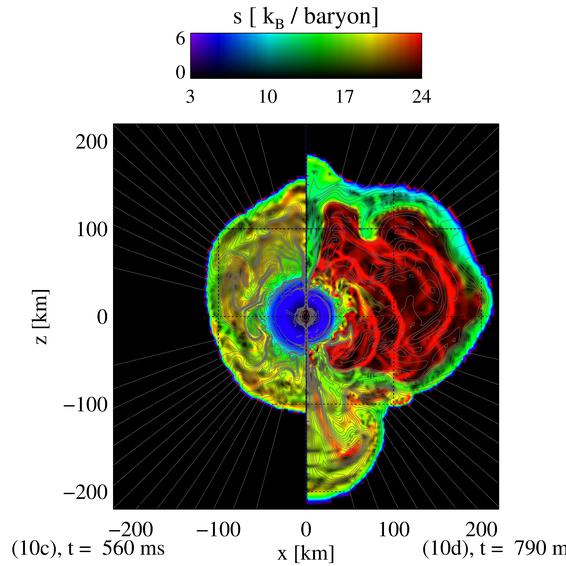
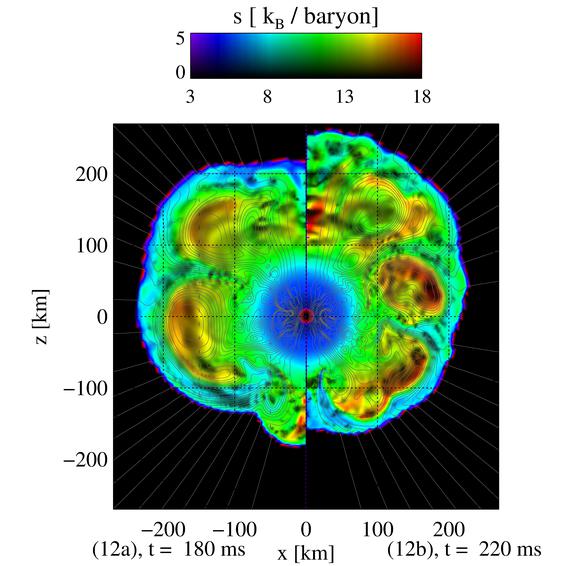
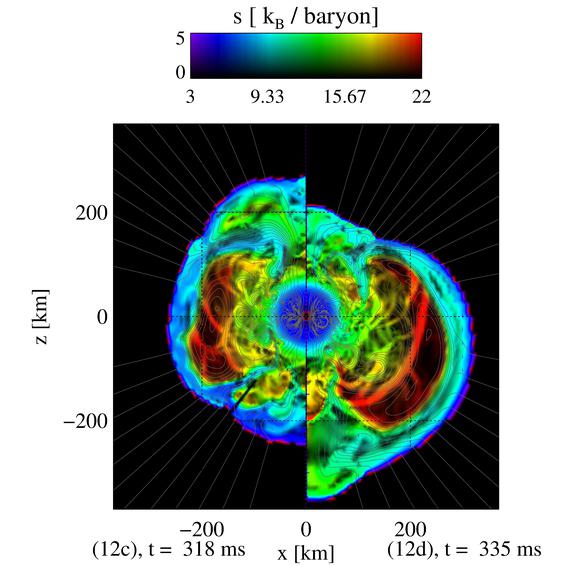
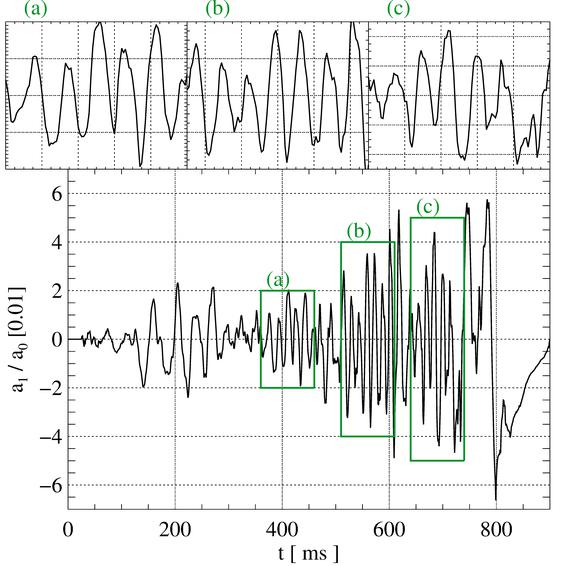
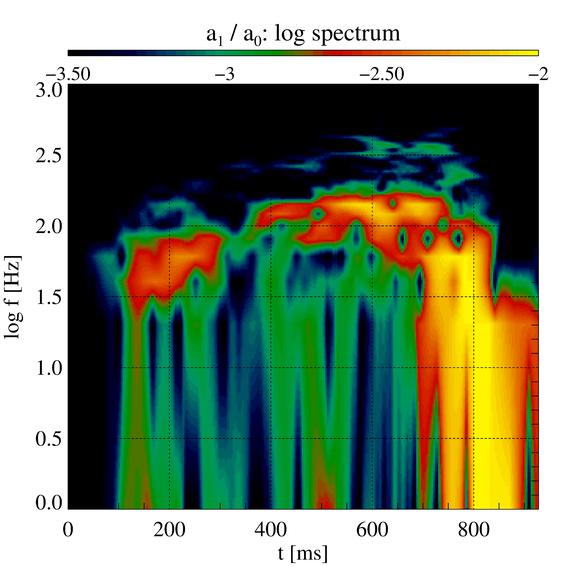
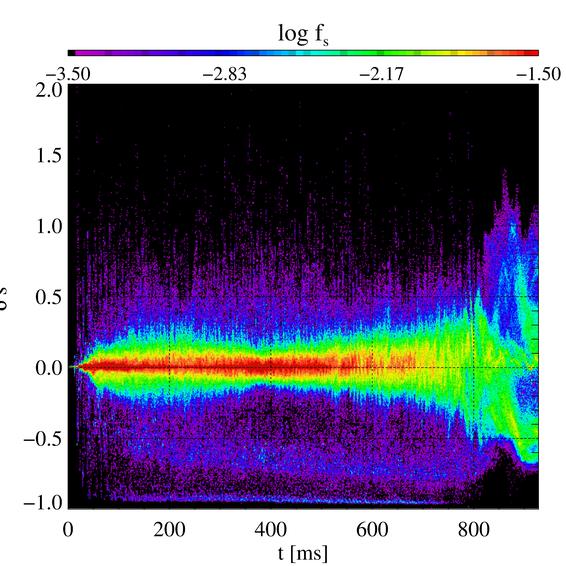
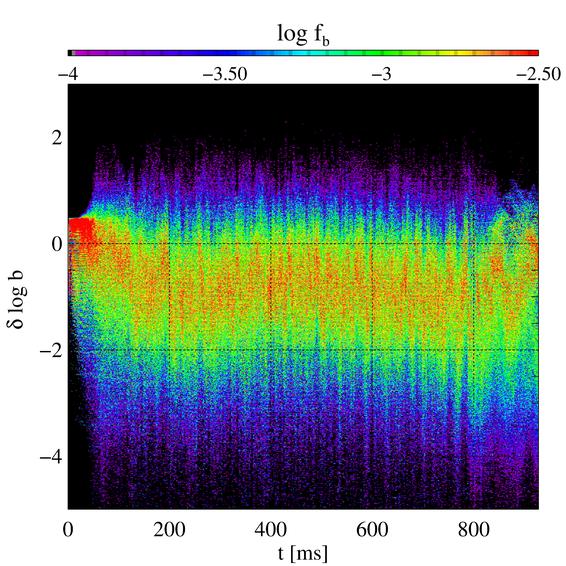
The dynamics observed agrees well with those described by Dolence et al. (2013) and Fernández et al. (2014). Compared to the models presented there, Model B10 shows a very extended post-bounce phase and the shock motion as well as the generation and disappearance of large-scale structures undergoes several phases during which the shock mode oscillates either in a more regular, SASI-like, or a more complex, convection-like, pattern.
The magnetic field is mostly organised in fairly thin filaments. Thus, the volume filling factor of the magnetic field is small, and most zones have a low magnetisation. This can be seen in the volume filling factor of the logarithm of the magnetic field strength, , obtained, similarly to , based on a logarithmic grid in the deviation of from its angular average, . We display in the bottom right panel of Fig. 27. The predominance of thin structures of strong field lead to a negative displacement of the maximum of the histograms from . The location of this maximum exhibits a variability on time scales of a few tens of ms, i.e. similar to the most prominent frequencies of the oscillations of Besides this variability, we find little imprint of the overall dynamics, in particular of the transition to explosion.
Neutrino heating is crucial for the dynamics of the GAIN layer. The dashed lines in Panel (a) of Fig. 28 display the volume-integrated heating rates, , of all magnetised models as functions of time (dashed lines). They exceed a level of for 200 ms around after bounce and decrease afterwards by a factor of 2. In the same panel, we show for comparison the volume-integrated source terms of the magnetic energy (r.h.s. of Eq. (16)) (solid lines). Their positive sign during most of the evolution indicates the generation of magnetic energy by the flow due to compression and stretching of field lines. Since this quantity scales with the square of the field strength, it is several orders of magnitude below in Model B10, a further sign of the negligible level of dynamic feedback of the field onto the flow in this model.
Finally, we discuss the evolution of the mass in the GAIN layer, , presented for the magnetised models in Panel (b) of Fig. 28. After reaching a maximum value of after bounce, the mass decreases to a few thousandths of a solar mass, until the onset of explosion leads to its extremely steep increase at late times.
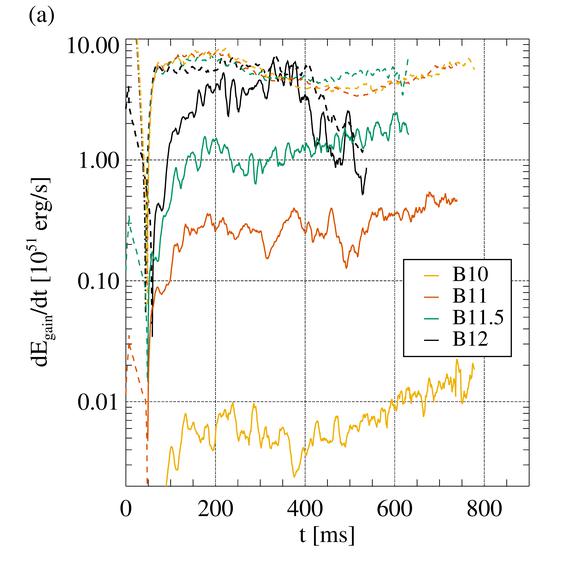
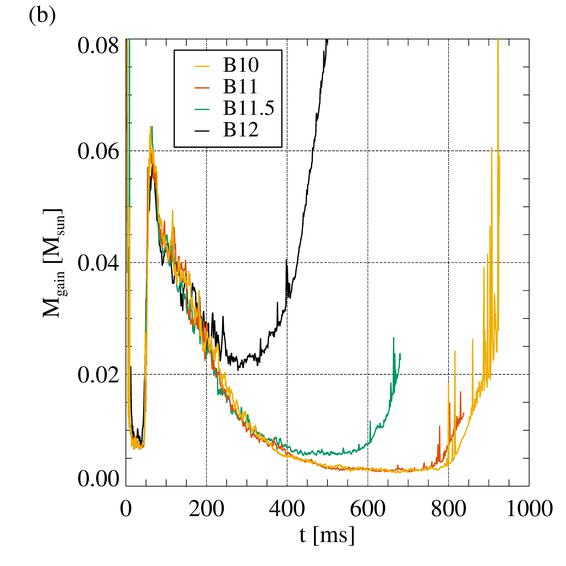
Model B12.
Similar to our analysis of Model B10, we can convert the spectral energy into turnover times for eddies and Alfvén waves. For weak fields (cf. Fig. 11), the eddy turnover time is comparable to the advection time of fluid elements in the GAIN layer, allowing for dynamically relevant effects of the non-spherical motions. For Model B12, both eddy turnover and lateral Alfvén crossing times are comparable to the advection time. Thus, the post-shock structure is dominated in equal parts by the hydrodynamic instabilities and the field. In particular, the largest structures and bubbles are in force balance between Reynolds and Maxwell stresses.
These findings point towards an important role of the magnetic field in establishing and maintaining large-scale flow patterns. To further explore the magnetic effects on the development of the SASI, we discuss the pattern of magnetosonic waves, which can be identified in the normalised length scale of variations of the total pressure, , shown as variations of the lightness superimposed on the colour scale representing the specific entropy in the two-dimensional snapshots of Fig. 26 (Panels 12a,12b,12c,12d). These variations reveal a geometry characterised by only few wave fronts extending over large ranges of latitude. Since the magnetic field restricts the advection to narrow downflows, magnetosonic waves are emitted from the deceleration region only at a few locations, which evolve only slowly in time. Emitted into all directions in the lower section of a downflow, the waves travel mostly radially in the accretion channels, in particular at the poles, and in an oblique direction across the bubbles in between. Arriving at the shock wave, they can couple back to the infall and close the advective-acoustic cycle fostering the SASI.
The magnetic field suppresses the disruption of the large bubbles by convective turbulence observed in Model B10. The quadrupolar topology of the field, constituted by a large field vortex in each hemisphere (see left panels of Fig. 19 and Panel (12a) of Fig. 26), acts as an additional stabilising factor. The formation of one large bubble, which could interrupt the SASI cycle, requires that one of these vortices be disrupted or pushed aside towards the axis. This process is inhibited by the super-equipartition magnetic tension.
Consequently, the SASI generates a fairly regular, pattern of slow shock oscillations for a long period. The dipole mode of the shock deformation (bottom panel of Fig. 29) shows fairly regular oscillations of a high amplitude in this stage. The period of these oscillations, around , is greater than in Model B10 and remains rather stable until the onset of rapid shock expansion. The evolution of the shock is a response to the post-shock structure.
Shock sloshings tend to occur via the development of new large bubbles at one pole, the displacement of the existing (usually two) equatorial bubbles towards the other pole, and, finally, mergers between bubbles, and less via the disruption of bubbles by secondary instabilities. Panel (12b) of Fig. 26 shows an intermediate stage during the oscillations. Three vortices of the field are present, and the entropy is rising in the downflow at the north pole. The bubbles will later merge, and the shock will oscillate towards the south pole. Panels (c) and (d) show the model at a later phase. They correspond to subsequent positive and negative peaks in . By this time, we find only one predominant hot bubble near the equator and two polar downflows (see also Fig. 19, right column of panels). This bubble is not disrupted as the shock oscillates between the two hemispheres, but retains its coherence. The oscillations of the shock are mostly due to alternating intensities of the polar downflows.
Eventually, a runaway of the shock radius and an explosion develop from these large bubbles. In this last phase of the evolution, the model remains dominated by the equatorial bubble that persists until the end of the simulation while smaller ones may develop transiently near the poles (Fig. 19, right column of panels).
The transition to the explosion is heralded by the broadening of the distribution of the volume filling factor of the entropy contrast (Fig. 30). After , the red band at weakens, and significant fractions of the gas deviate from the mean entropy by at least a third. During the subsequent evolution, the pulsations of the large, high-entropy bubbles appear as a series of more pronounced maxima at (red knots in the figure). After , the maximum of the distribution is very wide, pointing towards a dichotomy between increasingly hot bubbles (high ) and cool downflows (low ). This broadening precedes the actual shock expansion slightly and, thus serves as an early indicator for the subsequent explosion.
Not only the evolution of the distribution of the entropy is different from that of Model B10 (in particular w.r.t. the mechanism behind the development of large bubbles), but also the volume filling factor of the magnetic field strength is rather different. The maxima of the histograms are at , not at a lower value as in Model B10. The flux sheets comprising most of the magnetic energy are thicker. Thus, a larger volume fraction of the gas possesses a high magnetisation. We note that the important role of the field for the explosion is not imprinted into these distributions in a way similar to the ones of . This is, on the other hand, not too surprising, since the magnetic field does not undergo strong amplification in the post-bounce flow and, thus, changes to its structure are limited only.
We compare our model to the results of Fernández et al. (2014) in the regime dominated by large bubbles. They point out that the SASI cycle can be interrupted as large-scale bubbles form and force the accretion flow into (typically) one narrow downflow. In contrast, regular shock oscillations coexist with large, magnetically stabilised bubbles in our model. This difference might be due to the presence of wide polar accretion channels, which can close the advective-acoustic cycle. These channels lead to a rather spherical explosion geometry instead of the bipolar geometry of the model of Fernández et al. (2014) (cf. e.g. our Fig. 19 to their Fig. 3).
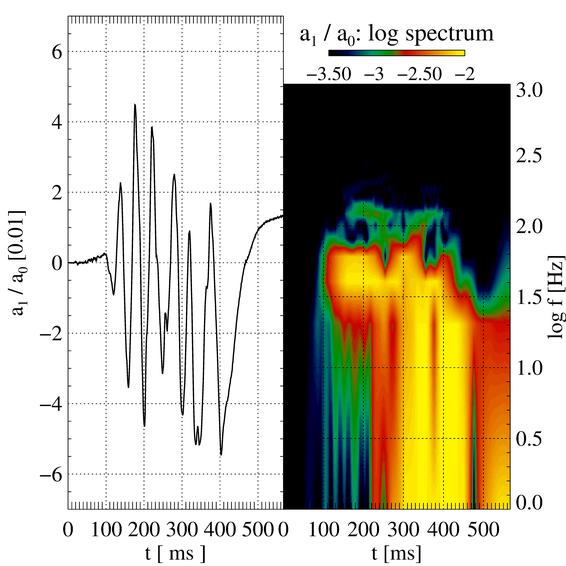
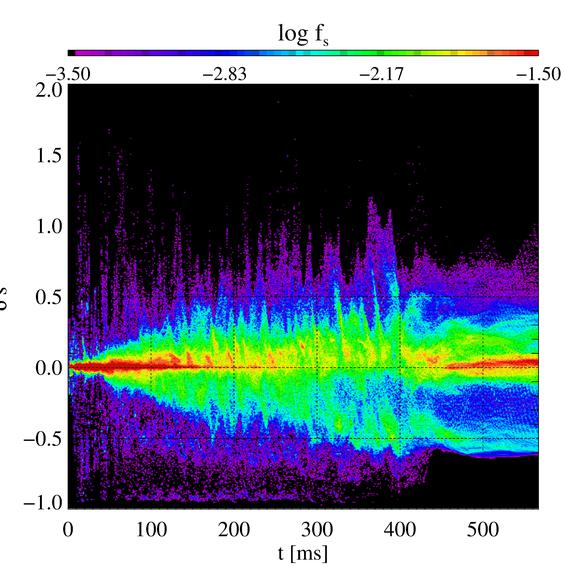
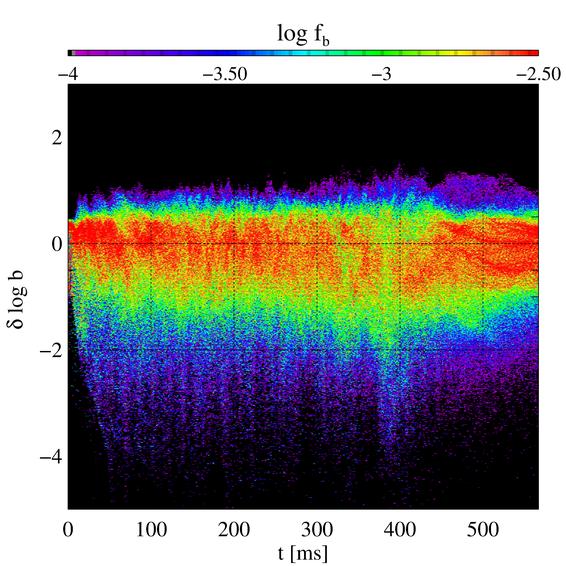
The total rate of neutrino heating, , differs somewhat from that of Model B10 (Panel (a) of Fig. 28) despite little differences in the neutrino luminosity and the mean neutrino energies between the two models (see Fig. 25). It is lower early on and does not exhibit the extended plateau up to . This difference is caused by the different structures of the GAIN layer. In a comparison of the 2D structure of the models, we find that the lower boundary of the regions where neutrino heating exceeds neutrino cooling lies at larger radius, hence lower density, for the model with stronger field, leading to a slightly reduced neutrino optical depth in the heating region. We note that the rate at which magnetic energy is generated (solid line) has the same order of magnitude as , and at late times even comes close to it. Around , both terms balance each other approximately, before they drop roughly in parallel when the explosion develops.
The total mass of the GAIN layer (Panel (b) of Fig. 28) is hardly affected by the strong field early on, but due to the large shock radius after and the early explosion, it does not drop to the same low values as in Model B10 later, but, instead, remains above at all times.
Model B11.5.
The radius of the shock wave begins to stop receding and deviate from that of Model B10 after , i.e. about 200 ms later than in Model B12 (see Fig. 21). After , the shock expands, gradually at first, then at a very fast rate once its mean radius exceeds 200 km at .
The dipole mode of the shock surface shows weak and irregular oscillations until . The amplitude is of the same order as in Model B10 early on. This stage is succeeded by a rather long phase of regular, large-amplitude oscillations, indicative of a strong SASI mode. Their frequency is slightly lower (periods around 12 ms) than during similar epochs in Model B10, which is consistent with its slightly larger shock radius. Finally, the power shifts to a broader range of lower frequencies as the average shock radius starts to increase.
Despite the high energy of the non-spherical flow, the magnetic field strength reaches local kinetic equipartition, in particular in a wide column along the polar axis. Similar to the situation in Model B12, this allows for the development of very persistent polar accretion flows in addition to the more variable ones at lower latitudes. In the maps of the entropy contrast given in Fig. 24, these show up as blue, i.e. cool regions, threaded by mostly radial field lines.
High-entropy bubbles surrounded by strong magnetic flux sheets develop between the accretion channels. Though their number, position, and size vary with time, the strong field acts to preserve, on average, the balance between the two hemispheres for a long time, analogous to Model B12. Besides the presence of the polar accretion flows, this leads to the long phase of regular SASI oscillations with a dipole mode that corresponds to the alternating expansion and compression of the bubbles on either side of the equator. Panels (c) and (d) of Fig. 24 show the model during subsequent peak amplitudes of . The large-scale topology of the field is conserved, and the two time steps show an approximate mirror symmetry with reversed positions of large high-entropy bubbles and cool (polar) downflows.
This pattern, stabilised by the magnetic field, is repeated until, finally, the symmetry is lost and one bubble expands strongly at the cost of the others. Afterwards, the shock starts to expand rapidly, leading to an explosion.
For this model, both the energy generation rates (Panel (a) of Fig. 28) and the mass in the GAIN (Panel (b) of Fig. 28) are intermediate between Models B10 and B12. Though is less than that of Model B10, it significantly exceeds the source term of the magnetic energy at all times. drops to almost the same values as for Model B10, but the earlier onset of the explosion translates into a minimum higher value around .
Onset of explosions.
The extended presentation of our results demonstrates that the transition to explosions can be well described within the framework of Dolence et al. (2013) and Fernández et al. (2014). High-entropy bubbles are formed and disrupted in the turbulent flows dominated to varying extent by convection or the SASI. During most of the post-bounce time, bubbles have small spatial scales and short coherence time scales, whereas the onset of the explosion is characterised by the development of large bubbles that persist for several dynamical time scales. For Models B08, B10, and B11, the influence of the magnetic field on the evolution is negligible.
Similarly, large-scale bubbles initiate the explosion of Model B12. The strong magnetic fields, however, affect the development of an explosion indirectly by modifying the dynamics of high-entropy bubbles in the gain layer rather than in a more direct manner, e.g. by adding magnetic pressure to the thermal pressure. Strong magnetic sheets couple large regions as the Alfvén speed is comparable to the flow speed, thus favouring the development of large structures, and magnetic tension resists their disruption, making the bubbles very persistent. Such an evolution leads to conditions favouring an explosion much earlier than in a model with a weak magnetic field. Model B11.5 presents an intermediate case, where the flow is affected by magnetic fields less and large-scale bubbles develop somewhat later than in Model B12.
5 Summary and conclusions
We have studied (some of) the processes leading to the amplification of the magnetic field in a non-rotating stellar core during the collapse and post-bounce accretion phases of a supernova. In non-rotating stars, a variety of amplification mechanisms considered in previous works, e.g. winding of the field by differential rotation or the MRI, are not viable. Instead, compression amplified the field during infall and convection and the SASI may constitute (small-scale) dynamos. Additionally, Alfvén waves travelling against the gas flow may be amplified once they reach an Alfvén point where the (co-moving) Alfvén velocity equals the gas velocity, a condition that could be fulfilled in the accretion flow onto the PNS. If efficient amplification occurs, the field may be able to affect the dynamics of the core, e.g. by altering the geometry of SASI flows or by energy dissipation through Alfvén waves in the upper layers of the hot-bubble region.
Reducing the complexity of the problem, simplified models, e.g. one-dimensional simulations with assumptions for the excitation, propagation and dissipation of Alfvén waves (Suzuki et al., 2008), toy models of Alfvén waves in decelerating flows (Guilet et al., 2011), and 2D and 3D MHD simulations without neutrino transport (Endeve et al., 2010, 2012) have demonstrated that these effects could, in principle, be relevant. On the other hand, to study their evolution under less idealised conditions, in particular their interplay with a highly dynamical background, more calculations of self-consistent models are required, i.e. multi-dimensional MHD including a treatment of neutrino transfer through the stellar core.
To this end, we have performed axisymmetric simulations of the collapse and the post-bounce evolution of the core of a non-rotating star of 15 solar masses possessing a purely poloidal initial field. Using a new code for neutrino-magnetohydrodynamics, we have solved the MHD equations coupled to the system of two-moment equations for the neutrino transport; the closure for the moment equations was provided by an analytic variable Eddington factor. We included descriptions for the most important reactions between electron neutrinos and antineutrinos and the stellar matter, viz. nucleonic, nuclear, and leptonic emission and absorption and scattering off nucleons and nuclei. Our current approach ignores muon and tau neutrinos and is not as accurate in treating neutrino-matter interactions as the most sophisticated existing transport schemes (e.g. Buras et al., 2006; Lentz et al., 2012), but possesses full two-dimensionality including velocity effects. Hence, our models allow for a fairly reliable assessment of the main MHD effects in self-consistent SN core models in the presence of all basic dynamical features found in supernova simulations, e.g. the stagnation of the prompt shock wave, PNS and hot-bubble convection, and the SASI activity. We will discuss remaining major limitations below.
The principal results of our simulations and the main conclusions to be drawn from them are:
-
1.
Non-magnetic and weakly magnetised models were followed for a post-bounce evolution of about 800 ms, during which the shock exhibits different phases of more or less regular oscillations of its dipole mode, corresponding to post-shock flows dominated by the SASI or convection. The mean shock radius contracts to values slightly above 100 km, until it starts to expand again and, finally, reaches more than 1000 km, at which point we stopped the simulations. Similar to the results of Dolence et al. (2013) and Fernández et al. (2014), this transition to explosion can be characterised by the development of one large bubble of high entropy. In agreement with Fernández et al. (2014), we find that this corresponds to a pronounced widening of the distribution of volume-filling factors of the relative entropy contrast.
-
2.
The magnetic field is amplified kinematically by the turbulent flows developing due to convection and the SASI. The amplification factor does not depend on the initial field unless it reaches, starting from a high initial value, equipartition with the kinetic energy and thus the maximum possible energy that can be attained. The maximum field we observe locally is a few times at the base of the PNS convection layer. In the PNS convection zone, the magnetic field is transiently amplified by the overturning flow, but suffers losses due to the expulsion of magnetic flux from convection cells. As a consequence, the PNS is surrounded by a layer of strong field mostly parallel to its surface. If no changes of the magnetic topology occur as the PNS cools and our 2D results can be confirmed by 3D simulations, the neutron star formed in the explosion will be magnetically shielded, in contrast to what is usually assumed in models of structure, cooling, and evolution of neutron stars (e.g. Geppert & Rheinhardt, 2006; Ciolfi et al., 2009). Such a geometry might have important consequences for accretion on the PNS and it might open up the possibility of powering explosive events in the magnetosphere triggered by impulsive reconnection. Furthermore, it is similar to the field configurations used by by Viganò et al. (2013) to explain the thermal luminosity of isolated neutron stars.
-
3.
When falling through the non-spherical accretion shock, the magnetic field is bent by lateral flows, creating a component parallel to the shock. These structures are advected towards the PNS convection zone. The field accumulates there, leading to a layer of strong magnetic fields. Since the structures are associated with a strong lateral component of the field, this layer is dominated by the -component of the field. We find that the field amplification achieved by the turbulent flows is the result of the competition between the radial advection and the overturning flows and, hence, the growth of the field is connected to the ratio of the advection time scale to the time scale of eddy turnover. The field carried by a fluid element can only be amplified as long as the fluid parcel is inside the region of vortex motion. Hence, fast turbulent flows in a slowly accreting layer are most conducive to field amplification. This effect, rather than the feedback of a magnetic field amplified to equipartition with the flow, sets the maximum to the field strength that our models with weak initial fields can reach. In fact, the final fields remain far below the kinetic energy across the entire spectrum of modes.
-
4.
Due to the non-radial field geometry, Alfvén waves propagate at constant radius rather than upwards. Therefore, we do not find an Alfvén surface in the accretion flow, although there are sub- as well as superalfvénic regions in this layer. This limits the efficiency of the amplification mechanism proposed by Guilet et al. (2011). Conditions for the latter effect are more favourable if accretion occurs through a sufficiently steady columns. In our axisymmetric models, this is the case mostly along the polar axis where the geometry enforces radial fields and flows. An Alfvén surface forms in the radial field of the accretion column at a radius depending on the initial field strength. For fields of initially, we observe that perturbations created in the PNS convection zone propagate along the field upwards into the accretion column, but a clear identification of their contribution to the amplification of the field and the energy transport was not possible.
-
5.
For the strongest initial field, , the combined kinetic and magnetic energies and stresses in the post-shock layer are similar to the ones for weak initial fields, but the contributions of magnetic and kinetic terms are now roughly equal. Consequently, the field is able to shape the post-shock flow. The Alfvén speed equals the flow speed, and thus magnetic forces couple large volumes and favour the formation of a flow dominated by low-order multipole modes, viz. a quadrupolar pattern of accretion columns at the poles and near the equator. Furthermore, magnetic tension suppresses the disruption of these flow structures. Consequently, the shock oscillations of this model show an extraordinary regularity, large amplitudes, and a low frequency. In this model with its special flow topology, we find the most pronounced shock expansion of all models, setting in earlier than for weak fields. Similar to non-magnetic models, the explosion geometry is dominated by large high-entropy bubbles, but in contrast to the weak-field case, these bubbles are seeded by the low-order modes enforced by the magnetic field rather than slowly developing from the convective/SASI modes. Strong initial fields in the progenitor core of thus favour an earlier onset of the explosion.
Though limited to non-rotating models in axisymmetry, our study is similar in scope to that of Endeve et al. (2010, 2012), and our main results are in agreement with theirs. We find, consistent with their results, efficient amplification of the magnetic field in the unstable regions of the hot bubble and the PNS, and, in particular, along the symmetry axis, where the flow is forced into stable, narrow accretion columns. Furthermore, all pre-collapse initial fields weaker than are amplified by roughly the same average factor in our models, while dynamic backreaction limits the amplification of stronger initial fields to smaller average factors. This threshold of the pre-collapse field strength above which the amplification is limited by feedback corresponds to field strength at the surface of the PNS similar to the one reported by Endeve et al. (2010) (cf. their Fig. 5). Having in mind the dependence of the field growth rate on the ratio between advection and eddy-turnover times, we may speculate that the different factors of magnetic field growth in their and our models are caused by strongly different sizes of the gain layers and different accretion profiles.
Besides many similar aspects, we have to note a striking difference between our results and the ones by Endeve et al. (2010): they find a complete suppression of the SASI by their strongest magnetic field, while in our models, the SASI is able to operate even for the strongest initial fields, albeit with a modified geometry. Among the differences in the setup of the two sets of simulations, the one most likely cause of such a strong discrepancy may be the chosen initial geometry of the magnetic field. While Endeve et al. (2010) start with a strictly radial field (split monopole), our initial fields are generated by an off-centre dipole and, thus, have strong non-radial components. Studies of the evolution of the SASI in a magnetised medium by Guilet & Foglizzo (2010) and Guilet et al. (2010) show that the interaction between the magnetic field and the SASI modes entails stabilising as well as destabilising effects, but their relative importance depends on the field geometry. The destabilising effects are strongest for a non-radial field and absent for a radial field. This indicates a possible origin of the differences between our simulations and those by Endeve et al. (2008), although this issue requires a closer investigation.
In summary, our results suggest that magnetic field amplification to interesting strengths can efficiently take place during stellar core collapse even in the absence of rotation. In addition to an enhancement due to compression by the radial collapse, we find that non-radial fluid flows associated with convection and SASI activity, and the interaction of Alfvén waves in the accretion funnels can amplify the initial iron-core fields. Present stellar evolution models (Heger et al., 2005) predict a field strength in slowly rotating pre-collapse iron cores of the order of – G and a predominantly toroidal field geometry. Because a large-scale dynamo is less likely to operate inside a non-rotating core, cores should generically possess even weaker and less ordered fields in the limit of very slow rotation than for rapid rotation. Starting with fields of the mentioned strength as an upper limit, field strengths of typical pulsars (– G) can be reached. Magnetar fields of – G result when the progenitor core is assumed to posses a pre-collapse field between a few G and G. Only in the latter case, the fields around the nascent neutron star obtain dynamical importance and might have an influence on the supernova explosion mechanism.
Though offering some insight into the magnetic-field evolution in non-rotating magnetised cores, our study has several important shortcomings:
-
1.
We have used a new solver for the neutrino transport with simplified neutrino-matter interactions, constraining ourselves to electron neutrinos and antineutrinos. While the accuracy of such a simplification in comparison to more complete neutrino treatments will have to be assessed in a separate study, we do not deem this a problem for the presented investigation because we are able to capture the most important dynamical effects in a supernova core.
-
2.
To save computational costs, we have restricted ourselves to axisymmetric simulations. In the light of the anti-dynamo theorems, this is a severe limitation leading to a wrong, possibly too low, level of amplification of the field in the turbulent regions. Furthermore, our models do not allow for the development of shear layers associated with non-axisymmetric spiral modes of the SASI, which may also be a site of efficient amplification of the magnetic field (see also Endeve et al., 2010).
-
3.
Axisymmetry may also affect the amount to which the magnetic flux is expelled from the PNS convection zone.
-
4.
Moreover, axisymmetry restricts the dynamics of the accretion flows, favouring the development of very stable accretion columns along the poles. As we have described, field amplification shows very distinct features in and below these columns. We presume that the dynamics in three dimensions is more similar to what we have seen in off-axis accretion flows, i.e. less stable Alfvén surfaces and less efficient amplification of Alfvén waves. Very strong initial fields of the order of lead to high field strengths that are able to dominate the post-shock accretion flow. This might establish coherent, stable accretion columns even in 3D. For such fields, our axisymmetric results may hence be a reasonable approximation.
-
5.
Turbulent field amplification may be very sensitive to dissipation effects, physical and numerical. Our models, based on ideal MHD, neglect dissipation by physical viscosity and resistivity, but are computed on relatively coarse numerical grids, corresponding to excessive numerical dissipation. This is at least partially confirmed by a resimulation of one of our weak-field models on a grid with twice the standard resolution, which shows a magnetic energy in the gain layer twice as large as in the standard model, whereas most other variables change only weakly.
-
6.
Therefore, we are not able to fully resolve the turbulent (inverse) cascades of magnetic and kinetic energy and helicity covering many orders of magnitude in wave number in a supernova core. The effect of insufficient resolution on Alfvén waves is probably less serious although their wave number should increase as they approach the Alfvén point, requiring enhanced resolution. Simulations of cores at a resolution corresponding to numerical viscosity and resistivity below the physical scales of these dissipative effects are by far too expensive today, and will remain so for a long time. To tackle this difficulty, a combination of different approaches would be desirable, viz. global direct numerical simulations of the core with drastically enhanced physical transport coefficients, and simple sub-grid models for MHD turbulence based on idealised local simulations neglecting most aspects of, e.g. neutrino physics. We are, however, aware of the lack of reliable sub-grid models for MHD at present, obstructing further progress in this direction.
Apart from these methodological shortcomings, open physical questions are, e.g. the influence of the progenitor on the establishment of certain patterns in the accretion flow, effects of different initial field geometry, and the influence of slow rotation of the core on our findings. In particular the last issue may prove interesting as it would enable a large-scale dynamo. We defer these questions as well as the more technical problems listed above to future investigations.
6 Acknowledgements
We thank Jérôme Guilet, Thierry Foglizzo, Jeremiah Murphy, Adam Burrows, and Oliver Just for interesting and educative discussions and Andreas Marek for providing us with the EOS table. We thank the anonymous referee for their careful revision of the manuscript and their helpful comments. M.O. and M.Á.A. acknowledge support by the European Research Council (grant CAMAP-259276), and from the Spanish Ministerio de Ciencia e Innovación (grant AYA2010-21097-C03-01 Astrofísica Relativista Computacional). Furthermore, at Garching this work was supported by the European Research Council through grant ERC-AdG No. 341157-COCO2CASA and by the Deutsche Forschungsgemeinschaft through the Transregional Collaborative Research Center SFB/TR 7 “Gravitational Wave Astronomy”, the Cluster of Excellence EXC 153 “Origin and Structure of the Universe” (http://www.universe-cluster.de), and the Max-Planck-Princeton Center for Fusion and Astro Plasma Physics. The simulations were performed using the clusters Lluisvives and Tirant of the Universitat de València.
References
- Akiyama et al. (2003) Akiyama, S., Wheeler, J. C., Meier, D. L., & Lichtenstadt, I. 2003, ApJ, 584, 954
- Audit et al. (2002) Audit, E., Charrier, P., Chièze, J., & Dubroca, B. 2002, ArXiv Astrophysics e-prints, arXiv:astro-ph/0206281
- Balbus & Hawley (1998) Balbus, S. A. & Hawley, J. F. 1998, Reviews of Modern Physics, 70, 1
- Bisnovatyi-Kogan et al. (1976) Bisnovatyi-Kogan, G. S., Popov, I. P., & Samokhin, A. A. 1976, Ap&SS, 41, 287
- Blondin et al. (2003) Blondin, J. M., Mezzacappa, A., & DeMarino, C. 2003, ApJ, 584, 971
- Braithwaite & Nordlund (2006) Braithwaite, J. & Nordlund, Å. 2006, A&A, 450, 1077
- Brandenburg & Subramanian (2005) Brandenburg, A. & Subramanian, K. 2005, Astronomische Nachrichten, 326, 400
- Buras et al. (2006) Buras, R., Rampp, M., Janka, H.-T., & Kifonidis, K. 2006, A&A, 447, 1049
- Burrows et al. (2007) Burrows, A., Dessart, L., Livne, E., Ott, C. D., & Murphy, J. 2007, ApJ, 664, 416
- Burrows et al. (2012) Burrows, A., Dolence, J. C., & Murphy, J. W. 2012, ApJ, 759, 5
- Burrows & Goshy (1993) Burrows, A. & Goshy, J. 1993, ApJ, 416, L75
- Cerdá-Durán et al. (2008) Cerdá-Durán, P., Font, J. A., Antón, L., & Müller, E. 2008, A&A, 492, 937
- Cerdá-Durán et al. (2007) Cerdá-Durán, P., Font, J. A., & Dimmelmeier, H. 2007, A&A, 474, 169
- Cernohorsky & Bludman (1994) Cernohorsky, J. & Bludman, S. A. 1994, ApJ, 433, 250
- Cernohorsky & van Weert (1992) Cernohorsky, J. & van Weert, C. G. 1992, ApJ, 398, 190
- Ciolfi et al. (2009) Ciolfi, R., Ferrari, V., Gualtieri, L., & Pons, J. A. 2009, MNRAS, 397, 913
- Couch (2013) Couch, S. M. 2013, ApJ, 765, 29
- Dessart et al. (2006) Dessart, L., Burrows, A., Livne, E., & Ott, C. D. 2006, ApJ, 645, 534
- Dessart et al. (2007) Dessart, L., Burrows, A., Livne, E., & Ott, C. D. 2007, ApJ, 669, 585
- Dolence et al. (2013) Dolence, J. C., Burrows, A., Murphy, J. W., & Nordhaus, J. 2013, ApJ, 765, 110
- Endeve et al. (2012) Endeve, E., Cardall, C. Y., Budiardja, R. D., et al. 2012, ApJ, 751, 26
- Endeve et al. (2008) Endeve, E., Cardall, C. Y., Budiardja, R. D., & Mezzacappa, A. 2008, Journal of Physics Conference Series, 125, 012006
- Endeve et al. (2010) Endeve, E., Cardall, C. Y., Budiardja, R. D., & Mezzacappa, A. 2010, ApJ, 713, 1219
- Fernández (2012) Fernández, R. 2012, ApJ, 749, 142
- Fernández et al. (2014) Fernández, R., Müller, B., Foglizzo, T., & Janka, H.-T. 2014, MNRAS, 440, 2763
- Fischer et al. (2009) Fischer, T., Whitehouse, S. C., Mezzacappa, A., Thielemann, F.-K., & Liebendörfer, M. 2009, A&A, 499, 1
- Foglizzo (2001) Foglizzo, T. 2001, A&A, 368, 311
- Foglizzo (2002) Foglizzo, T. 2002, A&A, 392, 353
- Foglizzo et al. (2007) Foglizzo, T., Galletti, P., Scheck, L., & Janka, H.-T. 2007, ApJ, 654, 1006
- Foglizzo et al. (2006) Foglizzo, T., Scheck, L., & Janka, H. 2006, ApJ, 652, 1436
- Geppert & Rheinhardt (2006) Geppert, U. & Rheinhardt, M. 2006, A&A, 456, 639
- Guilet & Foglizzo (2010) Guilet, J. & Foglizzo, T. 2010, ApJ, 711, 99
- Guilet & Foglizzo (2012) Guilet, J. & Foglizzo, T. 2012, MNRAS, 421, 546
- Guilet et al. (2010) Guilet, J., Foglizzo, T., & Fromang, S. 2010, in SF2A-2010: Proceedings of the Annual meeting of the French Society of Astronomy and Astrophysics, ed. S. Boissier, M. Heydari-Malayeri, R. Samadi, & D. Valls-Gabaud, 173
- Guilet et al. (2011) Guilet, J., Foglizzo, T., & Fromang, S. 2011, ApJ, 729, 71
- Hanke et al. (2012) Hanke, F., Marek, A., Müller, B., & Janka, H.-T. 2012, ApJ, 755, 138
- Hanke et al. (2013) Hanke, F., Müller, B., Wongwathanarat, A., Marek, A., & Janka, H.-T. 2013, ApJ, 770, 66
- Heger et al. (2005) Heger, A., Woosley, S. E., & Spruit, H. C. 2005, ApJ, 626, 350
- Herant et al. (1992) Herant, M., Benz, W., & Colgate, S. 1992, ApJ, 395, 642
- Janka (2012) Janka, H.-T. 2012, Annual Review of Nuclear and Particle Science, 62, 407
- Janka & Müller (1996) Janka, H.-T. & Müller, E. 1996, A&A, 306, 167
- Kaspi (2010) Kaspi, V. M. 2010, Proceedings of the National Academy of Science, 107, 7147
- Kotake et al. (2004) Kotake, K., Sawai, H., Yamada, S., & Sato, K. 2004, ApJ, 608, 391
- Kuroda et al. (2012) Kuroda, T., Kotake, K., & Takiwaki, T. 2012, ApJ, 755, 11
- Lattimer & Swesty (1991) Lattimer, J. M. & Swesty, F. D. 1991, Nuclear Physics A, 535, 331
- Lentz et al. (2012) Lentz, E. J., Mezzacappa, A., Bronson Messer, O. E., Hix, W. R., & Bruenn, S. W. 2012, ApJ, 760, 94
- Liebendörfer et al. (2005) Liebendörfer, M., Rampp, M., Janka, H., & Mezzacappa, A. 2005, ApJ, 620, 840
- Liebendörfer et al. (2009) Liebendörfer, M., Whitehouse, S. C., & Fischer, T. 2009, ApJ, 698, 1174
- Marek et al. (2006) Marek, A., Dimmelmeier, H., Janka, H.-T., Müller, E., & Buras, R. 2006, A&A, 445, 273
- Marek & Janka (2009) Marek, A. & Janka, H. 2009, ApJ, 694, 664
- Masada et al. (2012) Masada, Y., Takiwaki, T., Kotake, K., & Sano, T. 2012, ApJ, 759, 110
- McIntosh et al. (2011) McIntosh, S. W., de Pontieu, B., Carlsson, M., et al. 2011, Nature, 475, 477
- Meier et al. (1976) Meier, D. L., Epstein, R. I., Arnett, W. D., & Schramm, D. N. 1976, ApJ, 204, 869
- Mestel (1999) Mestel, L. 1999, Stellar magnetism, International series of monographs on physics No. 99 (Oxford: Clarendon)
- Meynet et al. (2011) Meynet, G., Eggenberger, P., & Maeder, A. 2011, A&A, 525, L11
- Mikami et al. (2008) Mikami, H., Sato, Y., Matsumoto, T., & Hanawa, T. 2008, ApJ, 683, 357
- Moiseenko et al. (2006) Moiseenko, S. G., Bisnovatyi-Kogan, G. S., & Ardeljan, N. V. 2006, MNRAS, 370, 501
- Mösta et al. (2014) Mösta, P., Richers, S., Ott, C. D., et al. 2014, ApJ, 785, L29
- Müller et al. (2010) Müller, B., Janka, H., & Dimmelmeier, H. 2010, ApJS, 189, 104
- Müller et al. (2012) Müller, B., Janka, H.-T., & Heger, A. 2012, ApJ, 761, 72
- Nordhaus et al. (2010) Nordhaus, J., Burrows, A., Almgren, A., & Bell, J. 2010, ApJ, 720, 694
- Obergaulinger et al. (2006) Obergaulinger, M., Aloy, M. A., & Müller, E. 2006, A&A, 450, 1107
- Obergaulinger et al. (2009) Obergaulinger, M., Cerdá-Durán, P., Müller, E., & Aloy, M. A. 2009, A&A, 498, 241
- Obergaulinger & Janka (2011) Obergaulinger, M. & Janka, H.-T. 2011, ArXiv e-prints, arXiv:astro-ph/1101.1198
- O’Connor & Ott (2013) O’Connor, E. & Ott, C. D. 2013, ApJ, 762, 126
- Pejcha & Thompson (2012) Pejcha, O. & Thompson, T. A. 2012, ApJ, 746, 106
- Pons et al. (2000) Pons, J. A., Ibáñez, J. M., & Miralles, J. A. 2000, MNRAS, 317, 550
- Rampp & Janka (2002) Rampp, M. & Janka, H.-T. 2002, A&A, 396, 361
- Sawai et al. (2013) Sawai, H., Yamada, S., & Suzuki, H. 2013, ApJ, 770, L19
- Scheck et al. (2008) Scheck, L., Janka, H., Foglizzo, T., & Kifonidis, K. 2008, A&A, 477, 931
- Scheidegger et al. (2008) Scheidegger, S., Fischer, T., Whitehouse, S. C., & Liebendörfer, M. 2008, A&A, 490, 231
- Shibata et al. (2011) Shibata, M., Kiuchi, K., Sekiguchi, Y., & Suwa, Y. 2011, Progress of Theoretical Physics, 125, 1255
- Shibata & Sekiguchi (2012) Shibata, M. & Sekiguchi, Y. 2012, Progress of Theoretical Physics, 127, 535
- Sumiyoshi et al. (2007) Sumiyoshi, K., Yamada, S., & Suzuki, H. 2007, ApJ, 667, 382
- Sumiyoshi et al. (2008) Sumiyoshi, K., Yamada, S., & Suzuki, H. 2008, ApJ, 688, 1176
- Suresh & Huynh (1997) Suresh, A. & Huynh, H. 1997, \jcop, 136, 83
- Suwa et al. (2013) Suwa, Y., Takiwaki, T., Kotake, K., et al. 2013, ApJ, 764, 99
- Suwa et al. (2007) Suwa, Y., Takiwaki, T., Kotake, K., & Sato, K. 2007, PASJ, 59, 771
- Suzuki et al. (2008) Suzuki, T. K., Sumiyoshi, K., & Yamada, S. 2008, ApJ, 678, 1200
- Symbalisty (1984) Symbalisty, E. M. D. 1984, ApJ, 285, 729
- Thompson (2000) Thompson, C. 2000, ApJ, 534, 915
- Thompson & Duncan (1993) Thompson, C. & Duncan, R. C. 1993, ApJ, 408, 194
- Thompson & Murray (2001) Thompson, C. & Murray, N. 2001, ApJ, 560, 339
- Thompson et al. (2005) Thompson, T. A., Quataert, E., & Burrows, A. 2005, ApJ, 620, 861
- Toro & Titarev (2006) Toro, E. F. & Titarev, V. A. 2006, \jcop, 216, 403
- Viganò et al. (2013) Viganò, D., Rea, N., Pons, J. A., et al. 2013, MNRAS, 434, 123
- Wickramasinghe & Ferrario (2000) Wickramasinghe, D. T. & Ferrario, L. 2000, PASP, 112, 873
- Winteler et al. (2012) Winteler, C., Käppeli, R., Perego, A., et al. 2012, ApJ, 750, L22
- Woosley et al. (2002) Woosley, S. E., Heger, A., & Weaver, T. A. 2002, Reviews of Modern Physics, 74, 1015