11email: plagos@astro.up.pt 22institutetext: Instituto de Astrofísica de La Plata (CCT La Plata, CONICET, UNLP), Paseo del Bosque, B1900FWA La Plata, Argentina 33institutetext: Facultad de Ciencias Astronómicas y Geofísicas, Universidad Nacional de La Plata, Paseo del Bosque, B1900FWA La Plata, Argentina 44institutetext: Observatorio Astronómico de Córdoba, Laprida 854, Córdoba, 5000, Argentina
On the properties of the interstellar medium in extremely metal-poor blue compact dwarf galaxies:
Abstract
Aims. The main goal of this study is to carry out a spatially resolved investigation of the warm interstellar medium (ISM) in the extremely metal-poor Blue Compact Dwarf (BCD) galaxy HS 2236+1344. Special emphasis is laid on the analysis of the spatial distribution of chemical abundances, emission-line ratios and kinematics of the ISM, and to the recent star-forming (SF) activity in this galaxy.
Methods. This study is based on optical integral field unit spectroscopy data from Gemini Multi-Object Spectrograph (GMOS) at the Gemini North telescope and archival Sloan Digital Sky Survey (SDSS) images. The galaxy has been observed at medium spectral resolution () over the spectral range from 4300 to 6800 . The data were obtained in two different positions across the galaxy, obtaining a total 4″8″ field which encompasses most of its ISM.
Results. Emission-line maps and broad-band images obtained in this study indicate that HS 2236+1344 hosts three Giant H ii regions (GH iiRs). Our data also reveal some faint curved features in the BCD periphery that might be due to tidal perturbations or expanding ionized-gas shells. The ISM velocity field shows systematic gradients along the major axis of the BCD, with its south-eastern and north-western half differing by 80 km/s in their recessional velocity. The H and H equivalent width distribution in the central part of HS 2236+1344 is consistent with a very young (3 Myr) burst. Our surface photometry analysis indicates that the ongoing starburst provides 50% of the total optical emission, similar to other BCDs. It also reveals an underlying lower-surface brightness component with moderately red colors, which suggest that the galaxy has undergone previous star formation. We derive an integrated oxygen abundance of 12+log(O/H)=7.530.06 and a nitrogen-to-oxygen ratio of log(N/O)=-1.570.19. Our results are consistent, within the uncertainties, with a homogeneous distribution of oxygen and nitrogen within the ISM of the galaxy. The high-ionization He ii 4686 emission line is detected only in the central part of HS 2236+1344. Similar to many BCDs with He ii 4686 emission, HS 2236+1344 shows no Wolf-Rayet (WR) bump.
Key Words.:
Galaxies: individual: HS 2236+1344 – Galaxies: dwarf – Galaxies: abundances – Galaxies: ISM – Galaxies: star formation – Galaxies: photometry1 Introduction
Low-mass galaxies undergoing a violent burst of star formation, such as BCD galaxies (Thuan & Martin ThuanMartin1981 (1981), Loose & Thuan LT86 (1986)) in the local Universe, and analogous objects at higher redshift (e.g., compact narrow emission-line galaxies and green peas, Guzmán et al. Guzman1998 (1998), Cardamone et al. Cardamone2009 (2009), Amorín et al. Amorin2012 (2012)) are important testbeds of galaxy evolution. In particular, the most metal-poor of these systems (e.g., Papaderos et al. P08 (2008) and references therein) are of special importance, as they are the closest analogs of the low-mass galaxy building blocks that are thought to have formed in the early Universe.
BCDs, the low-mass, high-compactness members of the broader class of H ii galaxies (Terlevich et al. Terlevich1991 (1991), Telles et al. T97 (1997)), span a wide range in morphology and gas-phase metallicity (Kunth & Sargent KS83 (1983), Izotov & Thuan IT99 (1999)). In their majority, these systems have subsolar oxygen abundance 7.912+log(O/H)8.4 (Terlevich et al. Terlevich1991 (1991), Izotov & Thuan IT99 (1999), Kunth & Östlin KO00 (2000)) and fall into the iE– or nE type of the classification scheme by Loose & Thuan (LT86 (1986)), due to the presence of one or several luminous SF regions in the central part of an old, more extended stellar low-surface brightness (LSB) host (Papaderos et al. 1996a , Telles & Terlevich TT97 (1997), Cairós et al. C01 (2001), Bergvall & Östlin BO02 (2002), Gil de Paz Gil03 (2003), Amorín et al. Amorin09 (2009), see Bergvall Bergvall12 (2012) for a review). A smaller fraction (10%) of BCDs exhibit cometary morphology (iI,C in the Loose & Thuan (LT86 (1986)) classification) that is owing to strong ongoing SF activity at the one tip of an elongated stellar LSB ‘tail’.
The lowest-metallicity BCDs (XBCDs), or extremely metal-poor (XMP) BCDs, defined as systems with an oxygen abundance 12+log(O/H)7.6 (Izotov & Thuan IT99 (1999)), are the least chemically evolved emission-line galaxies currently known. These systems are very scarce in the nearby Universe (Izotov & Thuan IT07 (2007), Kniazev et al. Kniazev04 (2004), Papaderos et al. P08 (2008), Guseva et al. G09 (2009), see also Skillman Skillman12-JENAM (2012)) with only about 100 of them currently known (see Morales-Luis et al. ML11 (2011), Filho et al. Filho13 (2013) for recent compilations of literature data). The most metal-poor ones are SBS 0335-052 W (12+log(O/H)6.9…7.12, Izotov et al. I05 (2005), Papaderos et al. P06a (2006), Izotov et al. I09 (2009)), SBS 0335-052 E (12+log(O/H)=7.2…7.3, Izotov et al. 1997a , Papaderos et al. P06a (2006)) and I Zw 18 (12+log(O/H)=7.2, Izotov et al. 1997b ). As pointed out by Papaderos et al. (P08 (2008)), BCDs/XBCDs show an intriguing connection between gas-phase metallicity, morphology and evolutionary status, with cometary morphology being a typical characteristic of the most metal-poor systems. This, together with the low (1 Gyr) luminosity-weighted age of XBCDs suggests that most of their stellar mass has formed in the past 1–3 Gyr (Papaderos et al. P08 (2008)). Interestingly, a significant fraction (10%) of unevolved, high-redshift galaxies in the Hubble Deep Field also show cometary (also referred to as ‘tadpole’) morphology (van den Bergh et al. v96 (1996), Elmegreen et al. Elmegreen05 (2005), Straughn et al. Straughn06 (2006), Windhorst et al. Windhorst06 (2006), Elmegreen et al. DME07 (2007)).
The formation process of cometary field galaxies near and far is unclear. Proposed hypotheses range from propagating SF, in the case of XBCDs (Papaderos et al. P98 (1998)), to interactions (Straughn et al. Straughn06 (2006)) and gas instabilities in forming disks (Elmegreen et al. Elmegreen05 (2005, 2012)) in the case of more massive galaxies. In fact, all these mechanisms may be at work at some level. For example, whereas H ii/BCDs are spatially well separated from normal (Hubble-type) galaxies (Telles & Maddox T00 (2000)), they usually have low-mass stellar and/or gaseous companions (e.g., Taylor et al. Taylor95 (1995), Noeske et al. Noeske01 (2001)). This also applies to many XBCDs, many of which are known to reside within loose galaxy groups (Pustilnik et al. 2001a ) or in galaxy pairs with a linear separation between 2 kpc and 100 kpc (Papaderos P12 (2012), hereafter P12). Examples of such binary dwarf galaxies are, e.g. I Zw 18 (Lequeux & Viallefond LV80 (1980)) and SBS 0335-052 (Papaderos et al. P98 (1998), Pustilnik et al. 2001b ). Recently, P12 pointed out the intriguing similarity of some XBCDs with their low-mass companions in their structural properties and evolutionary status, and interpreted this as manifestation of synchronization in the assembly history of such binary galaxies. He proposed, based on heuristic arguments, that the delayed formation of some present-day XBCDs in pairs or groups can qualitatively be explained as the result of their co-evolution within a common dark matter (DM) halo: The cumulative effect of recurrent mild interactions between co-evolving dwarfs is, according to P12, a quasi-continuous heating of their gas component and the delay of the dominant phase of their formation, in agreement with the observed low chemical abundances and young luminosity-weighted ages of XBCDs.
On sub-galactic scales, observations of H ii/BCDs also hint at a synchronous star formation history (SFH). For example, near-IR photometry and optical spectroscopy studies of UM~461 and Mrk~36 by Lagos et al. (L11 (2011)) and UM 408 by Lagos et al. (L09 (2009, 2011)) reveal that Young Stellar Clusters (YSCs) in these galaxies have a similar age over a spatial scale of 1 kpc (see, e.g., Telles Telles10 (2010)). Evidence for coeval star formation on scales of several hundred pc has also been found through photometric studies of high-luminosity BCDs with the Hubble Space Telescope (e.g., Östlin et al. Ostlin03 (2003), Adamo et al. Adamo11 (2011)) and surface photometry studies. For example, the subtraction of the underlying LSB host emission from surface brightness profiles of the BCD Mrk~178 yields almost flat color gradients within the starburst component, in agreement with the picture of a nearly coevally triggered SF episode on spatial scales of 1 kpc (Papaderos et al. Papaderos02 (2002)).
With regard to the chemical abundance patterns of H ii/BCDs, the available data suggest that the metals from previous SF events are homogeneously distributed and mixed over the ISM, while freshly produced elements by massive stars remain unmixed with the warm ISM and reside in the hot gas phase (Tenorio-Tagle TT96 (1996), Kobulnicky & Skillman KS97 (1997)). The spatial constancy of the N/O ratio, observed in these galaxies, might also be attributed to efficient transport and mixing of metals (e.g., Pérez-Montero et al. PM11 (2011), Lagos et al. L09 (2009, 2012)) by hydrodynamical processes (e.g., starburst-driven flows, infall of gas), so keeping the N/O ratio constant through the ISM of the galaxies on large scales. Locally enhanced N/O ratios in some BCDs are probably explained by nitrogen enrichment through WR winds (Walsh & Roy WR89 (1989), Kobulnicky et al. K97 (1997)), resulting in an N overabundance at the location of YSCs, in agreement with the detection of small, yet statistically significant oxygen abundance variations, attributable to chemical self-enrichment (Kunth & Sargent KS86 (1986)) even in some XBCDs (Papaderos et al. P06a (2006)).
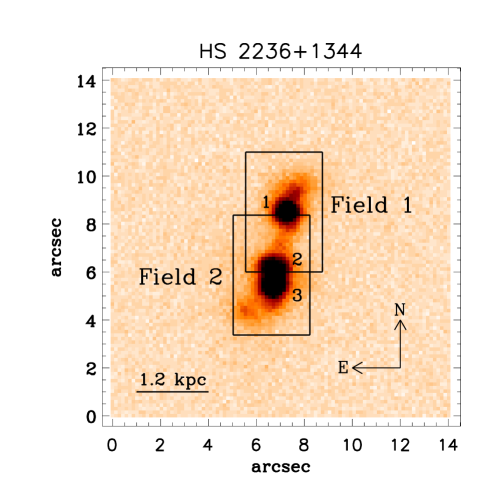
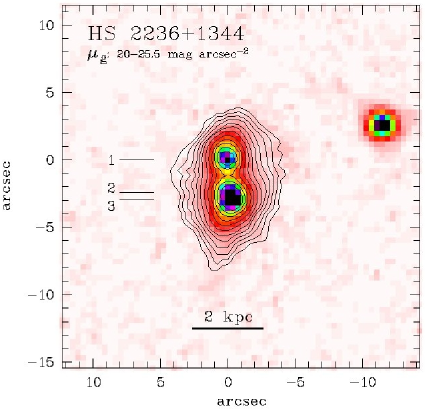
Integral field unit (IFU) spectroscopy offers a powerful tool to study all above topical issues in BCD/XBCD research in spatial detail (an overview of all H ii/BCD galaxies studied thus far with IFU spectroscopy is shown in Lagos & Papaderos LP13 (2013)). Our main objective in this paper is to carry out a spatially resolved investigation of the chemical abundance patterns and kinematics of the warm ISM in the nearby (80 Mpc) XBCD galaxy HS 2236+1344. For this, we use medium-resolution IFU data obtained with the Gemini North telescope. In Fig. 1 we show the -band acquisition image of the galaxy (see Table 1 for a summary of its general properties). It can be seen that HS 2236+1344 contains three compact (regions 1, 2 and 3) high-surface brightness knots or GH iiRs, and some faint arm-like features departing from its central body. These may be attributed to starburst-driven shells and/or tidally induced features, perhaps connected with an ongoing merger.
| parameter | value | reference |
|---|---|---|
| (J2000) | 22h38m31.1s | (a) |
| (J2000) | +14o00m30s | (a) |
| D (3K CMB) | 79.7 Mpc | (a) |
| 1″(3K CMB) | 386 pc | (a) |
| z | 0.020628 | (b) |
| 12+log(O/H) | 7.53 | (b) |
| Log(M(H i)) M⊙ | 8.35 | (c) |
| Other name | SDSS J223831.12+140029.7 |
2 Observations and Data reduction
The observations discussed in this paper were performed using the Gemini GMOS (Hook et al. Hook04 (2004)) and the IFU unit, hereafter GMOS–IFU (Allington et al. Allington02 (2002)), at Gemini North telescope, using the grating R600G5304 (R600) in one-slit mode with a spectral resolution of R4000. The GMOS-IFU in one slit mode composes a pattern of 500 hexagonal elements, each with a projected diameter of 02, covering a total field of view (FoV) of 355, plus 250 elements sampling the sky. The data were obtained at low airmass during the same night but in two different positions across the galaxy as indicated in Fig. 1 (cf Table 2).
| Name | Date | Exp. time | Airmass2221 |
|---|---|---|---|
| (s) | |||
| Field 1 | 2010-09-08 | 31285 | 1.068 |
| Field 2 | 2010-09-08 | 31285 | 1.013 |
The data reduction was carried out using the Gemini software package version 1.9 within IRAF444IRAF is distributed by NOAO, which is operated by the Association of Universities for Research in Astronomy Inc., under cooperative agreement with the National Science Foundation.. This includes bias subtraction, flat-field correction, wavelength calibration and sky subtraction. The flux calibration was performed using the sensitivity function derived from observation of the spectrophotometric standard star BD+28d4211. The 2D data images were transformed into 3D data cubes, resampled to a 02 spatial resolution, and corrected for differential atmospheric refraction using the gfcube routine. Finally, the two data cubes obtained with the grating R600 were combined into a final data cube that covers a spectral range from 4300 to 6800 and a FoV of 4″8″(2040 spaxels). More details about the data reduction can be found in Lagos et al. (L09 (2009, 2012)).


Figure 2 shows the integrated spectrum of the galaxy (over the whole FoV) and the spectra of regions 1, 2 and 3, summed up over all spaxels within the areas indicated in Sect. 3.1. In this figure we label the strongest emission lines detected and used in our study. The most remarkable finding from our data is the localized He ii 4686 emission in region 3 only (also visible on the integrated spectrum of HS 2236+1344) and a broad component in the base of some emission lines, such as H and [O iii] 5007. Finally, the emission line fluxes were measured using the IRAF task fitprofs by fitting Gaussian profiles. Since most of the emission lines were measured using an automatic procedure, we assigned the value 0.0 to all spaxels with signal to noise ratio (S/N) 3.
3 Results and discussion
3.1 Emission lines, continuum and extinction structure
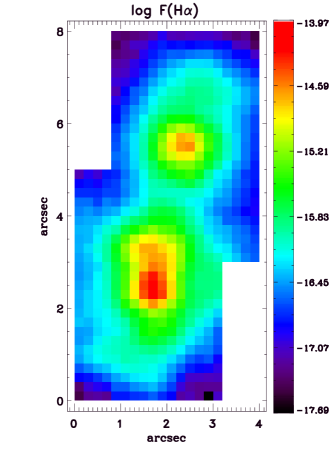
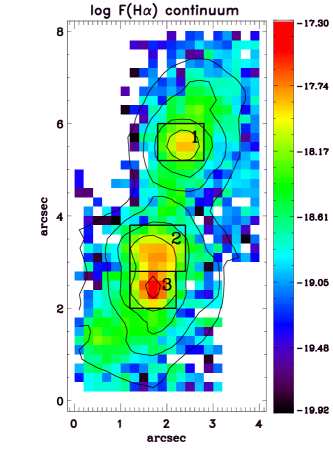
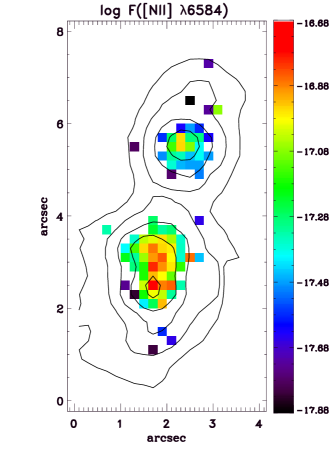
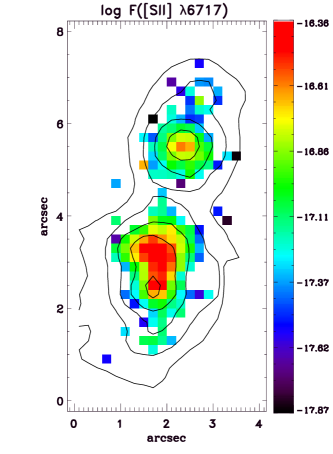
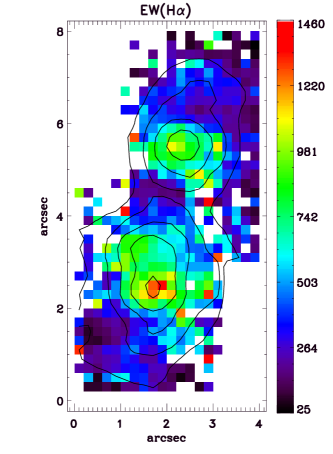
We used the flux measurement procedure described previously in Sect. 2 to construct emission line maps (e.g., [S ii] 6731, [S ii] 6717, [N ii] 6584, H, [O iii] 5007, [O iii] 4959, H, [O iii] 4363, H) within the combined FoV of 4″8″. In Fig. 3 we show the H, H continuum, [N ii] 6584, [S ii] 6717, EW(H) and the extinction c(H) maps of the galaxy. The H continuum map shows that HS 2236+1344 is composed of three GH iiRs. We designate the GH iiR that is centered on the field 1 (see Fig. 1) as region 1, while the GH iiR in the field 2 is resolved into a double peak that we labeled as regions 2 and 3. These three GH iiRs are also resolved on the acquisition image of the galaxy (Fig. 1). We see that the structure of the ionized gas, as traced by the emission lines and the H and H equivalent widths are similar, without any offset compared with the distribution of the stellar continuum (see Figure 3).
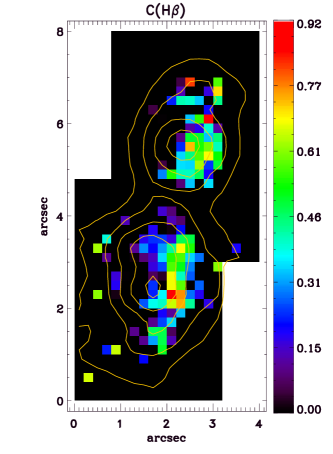
The extinction was calculated from the emission line ratio F(H)/F(H)=2.76, assuming case B recombination (Osterbrock & Ferland O06 (2006)) at T = 2 104 K (see Table 5). The c(H) values in Fig. 3 ranges between 0 and 0.92 and shows an inhomogeneous pattern, with its peak value being slightly offset from that of the H emission. Most of the spaxels in the outer part of the galaxy show a F(H)/F(H) ratio that is close to the theoretical value, so we assumed that these regions do not suffer from intrinsic extinction. Our results support the conclusion by Cairós et al. (C09 (2009)) and Lagos et al. (L09 (2009)) that a constant correction term for the extinction over the whole galaxy may in some cases lead to large errors in the derivation of properties of individual regions in Hii and BCD galaxies.
Finally, the observed emission line fluxes, for all the spaxels in our FoV, have been corrected for extinction using the observed Balmer decrement and the Cardelli et al. (C98 (1989)) reddening curve f() as . The observed F() and corrected emission line fluxes I() relative to the H and their errors, multiplied by a factor of 100, the observed flux of the H emission line, the EW(H) and EW(H), and the extinction coefficient c(H) for the integrated galaxy are tabulated in Table 3. In Table 4 we list the same quantities for the three SF regions in the BCD. We note that the mean extinction c(H)0.20 we derive over HS 2236+1344 is in good agreement with the value of 0.157 derived by Thuan & Izotov (TI05 (2005)). Determinations for individual regions differ, however, from the values of 0.49 and 0.27 obtained by Izotov & Thuan (IT07 (2007)) from the H/H ratio for their regions 1 and 2, respectively.
| Integrated | ||
| F()/F(H) | I()/I(H) | |
| H4340 | 46.123.88 | 49.217.31 |
| 4363 | 14.750.95 | 15.691.36 |
| HeI 4471 | 4.300.39 | 4.510.59 |
| HeII 4686 | 1.200.20 | 1.220.29 |
| HeI+4711 | 3.800.53 | 3.870.76 |
| 4740 | 2.700.14 | 2.740.20 |
| H4861 | 100.002.71 | 100.003.83 |
| 4959 | 169.965.02 | 168.617.05 |
| 5007 | 507.7512.70 | 499.8717.68 |
| HeI 5876 | 11.920.68 | 10.960.88 |
| 6300 | 1.030.20 | 0.920.25 |
| 6312 | 1.100.12 | 0.990.14 |
| 6363 | 0.320.03 | 0.290.04 |
| 6548 | 0.610.10 | 0.540.16 |
| H6563 | 317.836.25 | 280.957.81 |
| 6584 | 2.050.14 | 1.810.17 |
| HeI 6678 | 3.430.45 | 3.010.56 |
| 6717 | 4.940.30 | 4.330.37 |
| 6731 | 2.130.38 | 1.860.47 |
| F(H)555In units of 10-14 erg cm-2 s-1 | 5.160.07 | |
| EW(H)666In units of | 834 | |
| EW(H)b | 157 | |
| c(H) | 0.18 | |
| Region 1 | Region 2 | Region 3 | ||||
| F()/F(H) | I()/I(H) | F()/F(H) | I()/I(H) | F()/F(H) | I()/I(H) | |
| H4340 | 45.152.27 | 48.703.46 | 46.702.93 | 50.014.44 | 47.802.89 | 49.564.24 |
| 4363 | 16.290.86 | 17.511.31 | 13.760.89 | 14.691.34 | 17.430.64 | 18.040.94 |
| HeI 4471 | 4.300.39 | 4.420.57 | ||||
| HeII 4686 | 1.200.20 | 1.220.29 | ||||
| HeI+4711 | 3.800.53 | 3.840.76 | ||||
| 4740 | 2.700.14 | 2.720.20 | ||||
| H4861 | 100.001.22 | 100.001.73 | 100.003.69 | 100.005.22 | 100.003.14 | 100.004.44 |
| 4959 | 179.607.18 | 177.3810.03 | 143.123.54 | 141.524.95 | 186.386.07 | 185.288.53 |
| 5007 | 547.949.42 | 538.0313.08 | 431.199.75 | 424.1313.56 | 554.9719.19 | 550.1726.90 |
| HeI 5876 | 116.591.32 | 105.681.69 | 10.920.38 | 9.990.49 | 12.980.67 | 12.390.90 |
| 6300 | 1.100.13 | 0.970.16 | 1.580.12 | 1.410.15 | 0.530.02 | 0.500.03 |
| 6312 | 1.220.16 | 1.070.20 | 1.050.12 | 0.930.15 | 0.540.02 | 0.510.03 |
| 6363 | 0.410.06 | 0.360.07 | 0.520.05 | 0.460.06 | 0.170.03 | 0.160.04 |
| 6548 | 0.400.10 | 0.350.14 | 0.710.09 | 0.620.19 | 0.260.06 | 0.240.08 |
| H6563 | 324.203.49 | 280.754.27 | 321.106.81 | 281.908.45 | 298.955.22 | 279.156.89 |
| 6584 | 1.480.11 | 1.280.13 | 2.390.13 | 2.100.16 | 0.870.02 | 0.810.03 |
| HeI 6678 | 3.320.34 | 2.850.41 | 3.150.25 | 2.750.31 | 3.470.15 | 3.230.20 |
| 6717 | 3.880.21 | 3.330.25 | 6.290.35 | 5.470.43 | 1.640.07 | 1.520.09 |
| 6731 | 1.670.28 | 1.430.34 | 2.920.25 | 2.540.31 | 0.700.07 | 0.650.09 |
| F(H)777In units of 10-14 erg cm-2 s-1 | 0.660.01 | 1.090.02 | 1.910.03 | |||
| EW(H)888In units of | 970 | 829 | 1311 | |||
| EW(H)b | 272 | 233 | 300 | |||
| c(H) | 0.21 | 0.19 | 0.10 | |||
3.2 Velocity field
We have obtained the spatial distribution of radial velocities vr in the ISM by fitting a single Gaussian to the H emission line profiles. The velocity field of HS 2236+1344 is displayed in Fig. 4. The vr displays a variation of 80 km s-1 over the FoV, while in the central part of the BCD it varies by about 45 km s-1. Additionally, the velocity field, in our FoV, close to the galaxy’s center shows some rotation, with its upper part (northwest; region 1) being redshifted and its lower part (southeast; regions 2 and 3) blueshifted with respect to the systemic galaxy velocity. The relatively small measured variation in vr is in the range of values determined for other BCDs (e.g., van Zee et al. v01 (2001), Cairós et al. Cairos12 (2012)) yet significantly larger than for the intrinsically faint BCD UM 408 (Lagos et al. L09 (2009)).
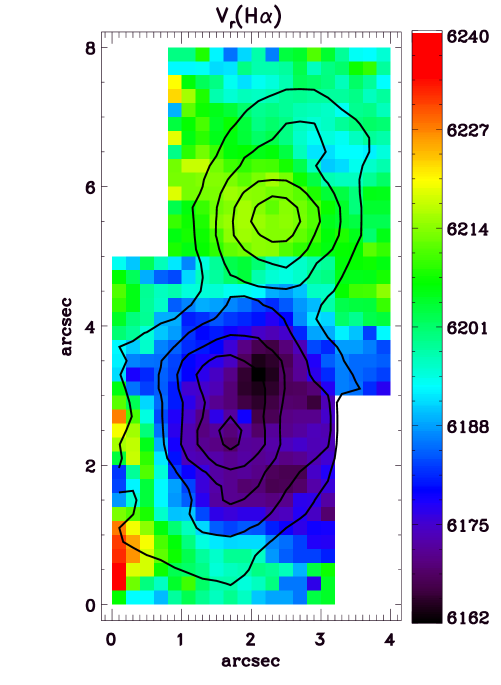
Moiseev et al. (M10 (2010)) studied the H velocity field of HS 2236+1344 using the multi-mode Fabry-Perot instrument SCORPIO. They concluded that, most likely, this galaxy is a strongly interacting pair of dwarf galaxies of comparable mass, possibly undergoing final stages of merging. Additionally, they argue that the observed kinematics can not be explained by giant ionized shells in a single rotating disc, and, to the contrary, there is evidence for two independently rotating discs. Our H velocity field is similar to the one these authors determine, yet our data show no clear evidence for two kinematically distinct gas disks, or kinematical perturbations indicative of a strongly interacting system.


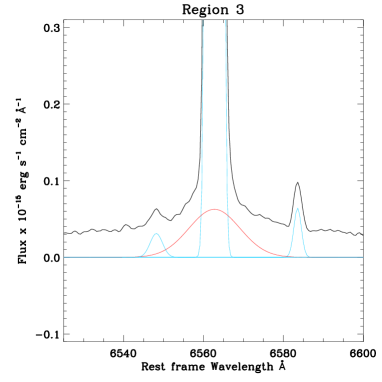
We checked for the presence of a broad low-intensity component in the H emission line profiles (Fig. 5) using the integrated spectrum of the galaxy, as well as that extracted from regions 1–3. For this, we have followed a similar procedure as that described in Lagos et al. (L12 (2012)): We used the pan999http://www.ncnr.nist.gov/staff/dimeo/panweb/pan.html routine (Peak ANalysis) in idl to fit two components to these profiles. Note that in different regions of the galaxy the H emission line profile is relatively symmetric and well represented by a single Gaussian. Although we use, in our study, the medium resolution grating R600, a detailed inspection of the base of the H emission line profile (and other emission lines, such as [O iii] 5007) in regions 2 and 3 reveals a broad component at low intensity levels similar to the ones observed in other BCD galaxies (e.g., Izotov et al. Izotov1996 (1996), Pustilnik et al. Pustilnik04 (2004), Izotov & Thuan IT09 (2009)). We fit the narrow component of the H, [N ii] 6548 and [N ii] 6584 by a single Gaussians (see Fig. 5). Then, simultaneously, we fit the broad component by a single Gaussian obtaining a FWHM of 100. A detailed analysis of this component is beyond the scope of this paper but its presence, in the inner part of region 3, appears to be consistent with stellar winds due by massive stars, e.g., from Luminous Blue Variables (LBV).
3.3 The He ii 4686 emission line
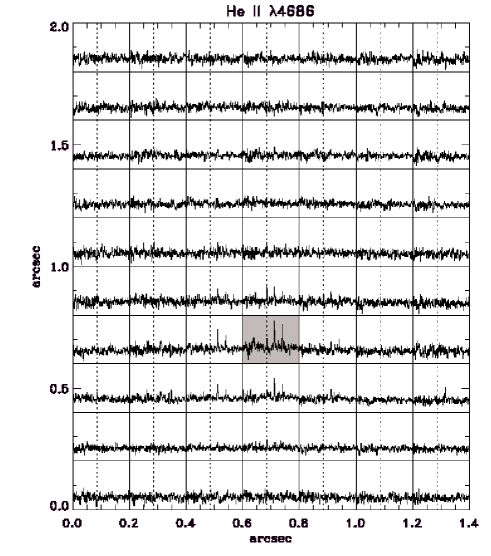
In Fig. 6 we show the integrated spectrum of region 3 in the wavelength range from 4600 to 4900 , which reveals the presence of a narrow He ii 4686 emission. Figure 7, encompassing regions 2 and 3, allows a study of the spatial distribution of that line. Squares represent the area on the sky that is covered by individual spaxels and are overlaid with the respective observed spectrum in the wavelength range 4600 – 4800 . The rest-frame wavelength of the emission line He ii 4686 is marked by dotted vertical lines, and the dark square indicates the location of the peak H intensity.

It is apparent from Fig. 7 that the high-ionization He ii 4686 emission is not extended as, e.g., in the compact H ii/BCD galaxies Tol~2146-391 (Lagos et al. L12 (2012)) and Mrk 178 (Kehrig et al. Kehrig13 (2013)). On the contrary, we find that most of the He ii 4686 emission in HS 2236+1344 is confined within region 3 (see Fig. 7), near the peak of H emission. This is presumably due to the low S/N in the blue part of our GMOS spectra, which likely prevents detection of extended low-surface brightness in He ii emission that may be present. This also suggested by the fact that previous high-S/N long slit spectroscopy (Izotov & Thuan IT07 (2007)) has revealed He ii emission in region #1 as well. In any case, the spatial association of He ii 4686 with region #3 suggests that its excitation is due to the ongoing burst. We note that the intensity I(He ii 4686)/I(H) = 0.01220.0029 in region 3 agrees within the errors with I(He ii 4686)/I(H)=0.01050.0008 and 0.01120.0013 obtained by Izotov & Thuan (IT07 (2007)) for their regions 1 and 2, respectively.
One of the most likely explanations101010See, e.g., Thuan & Izotov (TI05 (2005)) and references therein for other candidate sources for He ii 4686 ionization. for the high ionization emission lines in BCD galaxies is the presence of fast radiative shocks (Dopita & Sutherland DS96 (1996)) in the ISM of these galaxies (e.g., Thuan & Izotov TI05 (2005), Izotov et al. 2006a , Lagos et al. L12 (2012)). As noted above, we do not detect the He ii 4686 emission line at the arm-like structures in HS 2236+1344 or within any other extended morphological feature. On the other hand, at ages of 3-6 Myr the WR phase is still ongoing (Leitherer et al. L99 (1999)), so we expect a significant amount of these stars in the young regions (with ages of 3 Myr; see Sect. 3.7 for more details) found in this galaxy. But, we did not detect clear WR features at 4686 neither in the integrated spectrum of the galaxy nor in the different regions resolved in HS 2236+1344. Although, in the case of WR stars the He ii 4686 emission line and the blue WR bump are mainly linked to WN stars, the non-detection of this stellar emission suggests the existence of WR stars in an early evolutionary stage (e.g., LBV stars). In fact, a large fraction of galaxies with oxygen abundances lower than 12+log(O/H)=8.2 do not show WR features (Guseva et al. Guseva00 (2000), Brinchmann et al. Brinchmann08 (2008), Shirazi & Brinchmann SB12 (2012)). It is also known, that in several H ii/BCDs (e.g., II Zw 70 and Mrk 178; Kehrig et al. K08 (2008, 2013)) He ii 4686 emission does not strictly coincide with the location of the WR bumps. In this sense, He ii emission without associated WR features does not completely rule out a contribution of WR stars to the He ii ionization, even though other excitation sources are likely dominating.
In summary, various ionization sources may appear consistent with the observed morphology of the He ii 4686 emission in HS 2236+1344, whereas from the present data this seems to be an unresolved issue.
3.4 Emission Line Ratios
Using the information derived in the previous sections it is possible to attempt distinguishing among different ionization mechanisms using BPT (Baldwin, Phillips and Terlevich; Baldwin et al. B81 (1981)) diagrams. To do this, we adopt the following emission line ratios: [O iii] 5007/H, [N ii] 6584/H, [S ii] 6717, 6731/H and [O i] 6300/H. The [O iii] 5007/H emission line ratio is an excitation indicator and provides information about the available fraction of hard ionizing photons in an H ii region. On the other hand, [N ii] 6584, [S ii] 6717, 6731 and [O i] 6300 are low-ionization emission lines, usually weak in H ii regions. So, the emission line ratios [N ii] λ6584/H, [S ii] 6717, 6731/H and [O i] 6300/H can effectively disentangle between photoionization under physical conditions that are typical for H ii regions and other excitation mechanisms (e.g., AGN or shocks).
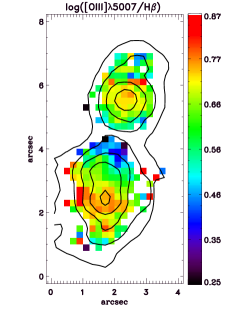
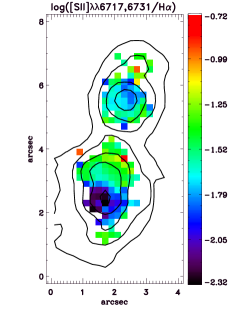
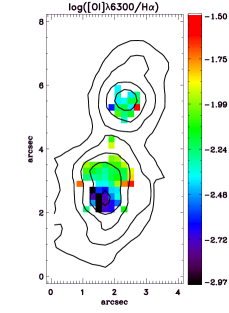
In Fig. 8 we show the emission line ratio maps [O iii] 5007/H, [N ii] 6584/H, [S ii] 6717,6731/H and [O i] 6300/H, respectively. In this figure, the ionization structure in the central part of regions 1, and 3 of HS 2236+1344 is rather uniform for all emission line ratios, while the emission line ratio [O iii] 5007/H decreases slightly, in region 2, with distance. The opposite is observed for the [S ii] 6717,6731/H, [N ii] 6584/H and [O i] 6300/H ratios.
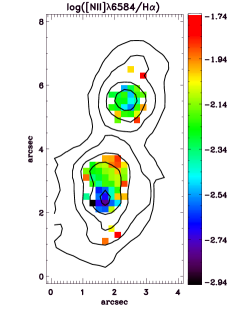
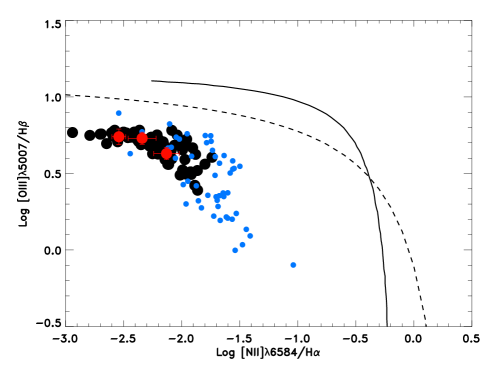
In Figure 9 we show the BPT diagram comparing [O iii]5007/H versus [N ii] 6584/H. In this figure, the solid line (adapted from Osterbrock & Ferland O06 (2006)) shows the demarcation between H ii regions photoionized by massive stars and regions dominated by other excitation sources. The dotted line represents the same as the solid line but using the models given by Kewley et al. (K01 (2001)). Black dots correspond to the values of individual spaxels in Fig. 8. Red dots show the integrated values of regions 1, 2 and 3, while the blue ones are several low metallicity (12+log(O/H)7.6) SF regions from Izotov et al. (I12 (2012)). It can be seen from Fig. 9 that the data points of HS 2236+1344 occupy the left region of the BPT diagram, showing smaller [N ii] 6584/H ratios, while the [O iii] 5007/H ratio increases. Therefore, the data points of HS 2236+1344 occupy the same region of the diagram, the left part of the BPT diagram, than other XMP galaxies found in the literature (Izotov et al. I12 (2012)).
3.5 Chemical abundances
In order to determine the chemical abundance pattern in the ISM of HS 2236+1344, we used the five level atomic model FIVEL (De Robertis et al. D87 (1987)), implemented in the IRAF STSDAS package . We first calculated the electron temperature Te(O iii) from the ratio [O iii] 4959,5007/[O iii] 4363 and the electron density from the ratio [S ii] 6717/[S ii] 6731. The latter is typically 1, which indicates a low electron density ne (Osterbrock & Ferland O06 (2006)). Large [S ii] 6717/[S ii] 6731 ratios were already observed in other studies (e.g., Lagos et al. L09 (2009), López-Hernández et al. LH13 (2013), Krabbe et al. Krabbe14 (2014)). These nonphysical values could be partly due to associated with uncertainties in the measurements of these emission lines, due to the placement of the continuum or, more likely, because the spectrum was not corrected for night sky absorption lines. Therefore, intensities of [S ii] 6717 and [S ii] 6731 (Tables 3 and 4) lines are, likely, affected by the night sky absorption. In any case, we compare our results with the SDSS spectrum of the same galaxy obtaining [S ii] 6717/[S ii] 6731 1.6, which is about 20% larger than the value obtained by Thuan & Izotov (TI05 (2005)) of 1.31 (110 cm-3). Therefore, it is reasonable to assume a value of 100 cm-3 for all apertures in our calculations.
The oxygen and nitrogen abundances were calculated as
| (1) |
and
| (2) |
with the ionic abundances O+, O+2 and N+ obtained from the nebular output file. Nitrogen abundances were calculated using an ionization correction factor (ICF) ICF(N)=(O++O+2)/O+. We assumed that the Te(O ii) temperature is given by Te(O ii) = 2/(T(O iii)+0.8) (Pagel et al. P92 (1992)) and Te(O ii) = Te(N ii). Since the [O ii] 3727 doublet is not within the spectral range of our data, we have to rely on published fluxes. We therefore adopted ratios of F(O ii 3727)/F(H)=54.67 (Thuan & Izotov TI05 (2005)) for the integrated spectrum, 40.330.69 for region 1 and 25.390.41 for regions 2 and 3 (Izotov & Thuan IT07 (2007)), respectively. The fluxes are relative to F(H)=100. We checked our results with an alternative method for deriving abundances in which a constant F(O ii 3727)/F(H) value is assumed (Thuan & Izotov TI05 (2005)). We found that values derived using a constant F(O ii 3727)/F(H) ratio yield oxygen abundances 0.03 dex higher and nitrogen abundances 0.23 dex lower than the ones obtained using the values of Izotov & Thuan (IT07 (2007)). In Fig. 10 we show the variation of the 12+log(O/H) abundance in the integrated galaxy as a function of the adopted F([Oii] 3727)/F(H) ratio. From this figure we can see that very small changes were found by adopting the values by Thuan & Izotov (TI05 (2005)) and Izotov & Thuan (IT07 (2007)), since the oxygen abundance do not vary strongly with F(O ii 3727)/F(H) within the errors. So, the adoption of [O ii] 3727 fluxes from the literature introduces only minor uncertainties in the analysis of 12+log(O/H), while the N/O abundance ratio is highly uncertain.

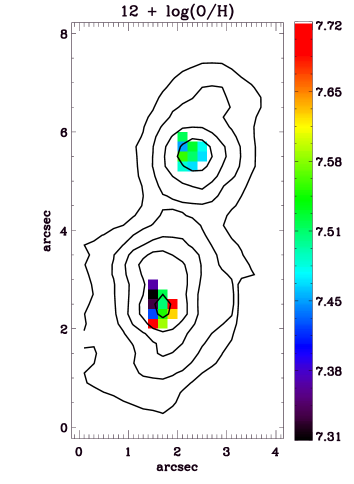
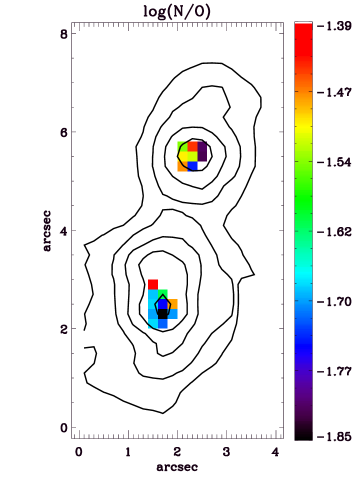
In Table 5 we show the electron density, electron temperature and abundances calculated for each one of the integrated apertures considered in this work. Figure 11 (left panel) shows the spatial distribution of the oxygen abundances in spaxels with detected [O iii] 4363 emission, and in the right panel of the same figure we show the spatial distribution of log(N/O) calculated using the oxygen and nitrogen maps in the spaxels with detected [N ii] 6584 emission.
| Integrated | Region 1 | Region 2 | Region 3 | |
| Te(O iii) K | 19442443 | 19925635 | 20665584 | 19951333 |
| Ne(S ii) cm-3 | 100 | 100 | 100 | 100 |
| O+/H105 | 0.510.02 | 0.370.02 | 0.220.01 | 0.210.01 |
| O++/H105 | 2.920.20 | 2.970.28 | 2.180.17 | 3.050.15 |
| O/H 105 | 3.430.22 | 3.350.30 | 2.400.19 | 3.260.15 |
| 12+log(O/H) | 7.530.06 | 7.520.09 | 7.380.08 | 7.510.05 |
| N+/H106 | 0.140.01 | 0.090.01 | 0.150.01 | 0.060.01 |
| ICF(N) | 6.770.69 | 9.021.28 | 10.901.34 | 15.201.14 |
| N/H 106 | 0.930.12 | 0.860.15 | 1.650.26 | 0.920.08 |
| 12+log(N/H) | 5.970.13 | 5.930.18 | 6.220.15 | 5.960.09 |
| log(N/O) | -1.570.19 | -1.590.27 | -1.160.23 | -1.550.14 |
| He ii 4686/H | 0.01220.0029 | |||
| log(5007/H) | 0.700.03 | 0.730.02 | 0.630.03 | 0.740.05 |
| log(6584/H) | -2.190.12 | -2.340.12 | -2.130.11 | -2.540.06 |
| log(6717,6731/H) | -1.660.16 | -1.770.14 | -1.550.12 | -2.110.12 |
| log(6300/H) | -2.480.30 | -2.460.18 | -2.300.14 | -2.750.08 |
| Region 1 | Region 3 | |||||
|---|---|---|---|---|---|---|
| Mean | SDEV111111Standard deviation of the spaxels. | 121212Difference between minimum and maximum values. | Mean | SDEV | ||
| O+/H+ ( 105) | 0.36 | 0.06 | 0.19 | 0.23 | 0.05 | 0.15 |
| O++/H+ ( 105) | 2.83 | 0.31 | 0.90 | 3.37 | 1.09 | 3.16 |
| 12 + log (O/H) | 7.50 | 0.04 | 0.11 | 7.54 | 0.14 | 0.41 |
| N+/H+ ( 106) | 0.09 | 0.02 | 0.06 | 0.05 | 0.02 | 0.05 |
| 12 + log (N/H) | 5.90 | 0.19 | 0.46 | 5.86 | 0.19 | 0.63 |
| log (N/O) | -1.60 | 0.16 | 0.39 | -1.68 | 0.10 | 0.38 |
The oxygen abundance in the galaxy varies from 7.31 to 7.72 (see Figure 11). The integrated and mean values are almost equal for regions 1 and 3, with values of 12+log(O/H)=7.520.09 and 7.510.05, respectively. While, in region 2, we found an oxygen abundance of 12+log(O/H)=7.380.08. The integrated abundance 12+log(O/H)=7.530.06 determined here agrees, within the errors, with the value reported by Thuan & Izotov (TI05 (2005)) of 7.4730.012. Our oxygen abundance determination for region 1, 2 and 3 agrees, within the errors, with the ones found by Izotov & Thuan (IT07 (2007)) with 12+log(O/H)=7.4500.012 and 7.5620.013, for their regions 1 and 2, respectively. With regard to the nitrogen abundance, we derive an integrated value of 12+log(N/H)=5.970.13, which is consistent, within the errors, with the values in individual regions (5.930.18, 6.220.15 and 5.960.09, for regions 1, 2 and 3, respectively). The log(N/O) ratio (Fig. 11) ranges from -1.85 to -1.39 with a mean value of -1.600.16 and -1.680.10 in regions 1 and 3, respectively. Finally, we found an integrated value of log(N/O)=-1.570.19 and log(N/O) = -1.590.27 and -1.550.14 for regions 1 and 3, while the region 2 has a value of log(N/O)=-1.160.23, respectively.
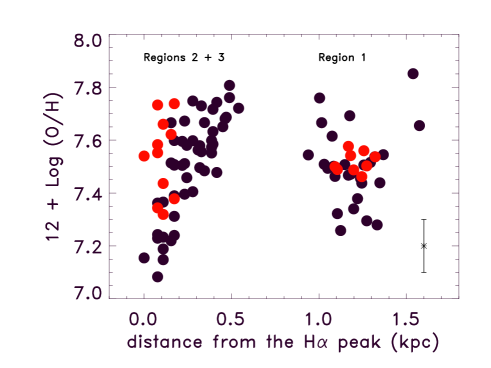
Figure 12 shows the radial distribution of the oxygen abundance with respect to the peak of H emission in the spaxels (red data points) where the [O iii] 4363 emission line was detected. We also include oxygen abundance determinations based on empirical calibrations (black data points in Figure 12) for spaxels where a reliable determination of Te(O iii) was not possible. In this case, the O/H abundance was derived by applying the relation between the line ratio of [N ii]6584/H with the oxygen abundance from Denicoló et al. (D02 (2002)), i.e. 12+log(O/H)=9.12(0.05)+0.73(0.10)N2, with N2=log([N ii] 6584/H). The average oxygen abundance based on Te(O iii) was determined to be 12+log(O/H)=7.50 and 7.54 for regions 1 and 3, respectively, slightly above the value from the Denicoló’s relation (7.48), having a typical uncertainty of 0.18 dex. However, the values based on the empirical calibration are, in some cases, by 0.4 dex lower than those relying on Te(O iii), at least in the peak of H emission. Therefore, this empirical calibration method provides a useful mean value for the oxygen abundance in the ISM but is less suited for a detailed study of possible spatial variations (e.g., López-Sánchez et al. LS11 (2011)).
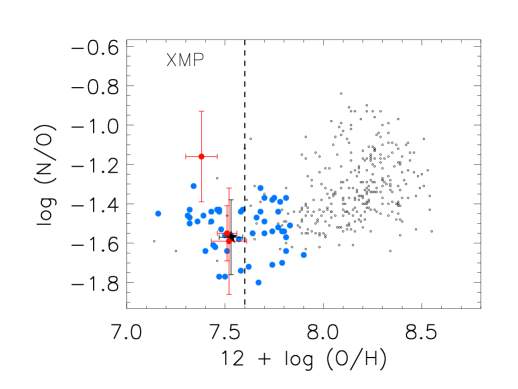
In Fig. 13 we show the relation between log(N/O) and 12+log(O/H), which includes the values of the three GH iiRs resolved in HS 2236+1344 (red points). In the same figure, the black star indicates the integrated value of our analyzed galaxy. The small black open dots correspond to values published by Izotov et al. (2006b ) for a large sample of SDSS starburst galaxies, while the blue data points are values from Izotov et al. (I12 (2012)) for a sample of XBCDs. It is interesting to note that the integrated N/O value of the galaxy is similar, within the errors, to the ones obtained in regions 1, 2 and 3, and those of other BCD galaxies of similar metallicity (see Fig. 13). Indeed, the O/H and N/O abundances from the integrated spectrum is in excellent agreement, within the errors, with the mean value of the spaxels for regions 1 and 3. Therefore, our results appear normal for XBCDs, which are characterized by a plateau at log(N/O)-1.6 (e.g., Edmunds & Pagel EP78 (1978), Alloin et al. A79 (1979), Izotov & Thuan IT99 (1999)).
XBCDs are found to fall off the mass/luminosity – metallicity relation compiled from literature data in Filho et al. (Filho13 (2013)), which is consistent with the presence of chemically unpolluted gas in these systems. It is worth remarking in this context that Sánchez almeida et al. (S14 (2014)) studied, using long-slit spectroscopy, the oxygen abundance along the major axis of seven SF galaxies, including HS 2236+1344. In that study, they find that the latter shows a central metallicity decrease by 0.5 dex, which they ascribe to accretion of metal-poor gas from the halo. It is long known (e.g., Thuan et al. T05 (2005)) that the gas in the halos of H ii/BCD galaxies is very metal poor, a fact making infall and mixing with gas from the halo a plausible explanation for the reported local decrease in the metallicity of the ionized gas phase. From the present data, however, given the uncertainties associated with our determinations of O and N, we consider these chemical species to be well mixed and homogeneously distributed over the ISM of the galaxy (e.g., Lagos et al. L09 (2009, 2012)), albeit a slightly, and uncertain, decreased oxygen abundance was found in the faintest GH iiR studied (12+log(O/H)=7.380.08).
3.6 The surface brightness profile of HS 2236+1344
The surface brightness profile of HS 2236+1344 agrees with the detection of an underlying more evolved stellar host with a luminosity-weighted age of 0.5…2 Gyr in most XBCDs studied as yet (Papaderos et al. P08 (2008)), even though the estimated ages will depend, besides the poorly constrained SFH, also on the importance of radial stellar migration and the associated radial mass filtering effect described in Papaderos et al. (Papaderos02 (2002)).
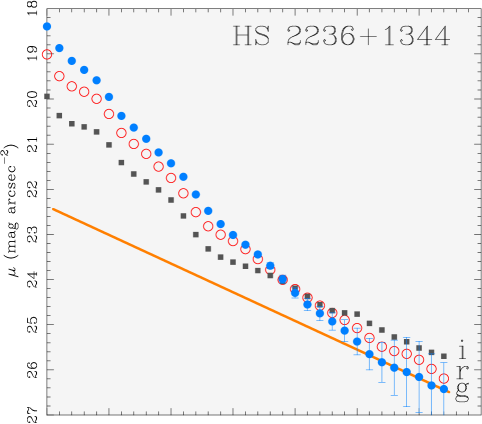
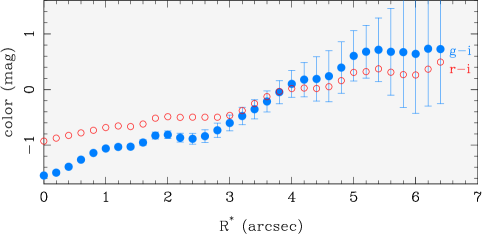
From the SDSS -band contour map in Fig. 14 it is apparent that the three GH iiRs in HS 2236+1344 are hosted by a more extended underlying LSB component with a moderately smooth morphology. This LSB host dominates the light for surface brightness levels mag arcsec-2 and can be studied using SDSS data down to mag arcsec-2. The surface brightness profiles of the XBCD in , and (Fig. 15, upper panel) were derived with method iv by Papaderos et al. (Papaderos02 (2002)) (also referred to as LAZY by Noeske et al. Noeske06 (2006)). They show the typically complex radial intensity distribution of BCDs/XBCDs which is characterized by an outer exponential component, corresponding to the LSB host, and a steep luminosity increase at smaller radii that is due to the young stellar population and nebular emission in the starburst component (e.g., Papaderos et al. 1996a ; hereafter P96a). A fit to the band profile for 5″, i.e. beyond the transition radius (P96a), where color profiles of BCDs level off to a nearly constant value, yields an exponential scale length of 1701 (66040 pc) and a total absolute magnitude of –15.3 mag for the LSB host. The latter contributes only about 15% of the total luminosity, i.e. significantly less than the average value for normal-metallicity BCDs (50%; Papaderos et al. 1996b ). With regard to its effective radius of 22 (860 pc), HS 2236+1344 does not appear exceptional among BCDs/XBCDs.
The very blue – color (–1.4 mag …–0.3 mag) of the galaxy in its central part (out to 1.5) is only reproducible by a strong nebular emission contribution in the visual passband by the [O iii] 4959,5007 forbidden lines (Papaderos et al. P98 (1998)). This is in good agreement with the large measured H EWs (230 …300 ; Table 4) and previous spectroscopic and evolutionary synthesis studies by Guseva et al. (Guseva07 (2007)) which clearly reveal a strong nebular continuum contribution in the region around the Balmer jump.
The mean – color in the LSB component of HS 2236+1344 (of mag; Fig. 15, lower panel) corresponds to an age between 1 and 3.3 Gyr for a SFH approximated, respectively, by an instantaneous burst and an exponentially decreasing star formation rate (SFR) with an e-folding time of 1 Gyr (cf, e.g. Fig. 6 of Papaderos et al. P08 (2008)). Judging from our IFU data, extended ionized gas emission, in this galaxy, does not dominate in the LSB periphery of HS 2236+1344, contrary to the case of I Zw 18 (Papaderos et al. Papaderos02 (2002), Papaderos & Östlin PapaderosOstlin12 (2012)), thus the broadband colours of the LSB need not be corrected for this effect.
If the exponential LSB host of BCDs/XBCDs forms in an inside-out manner through radial migration of stars, then the associated stellar mass filtering effect (Papaderos et al. Papaderos02 (2002)) will result into a stellar age overestimate, if colors are interpreted in terms of extended SFHs. In fact, a consequence of galaxy build-up through stellar migration is that instantaneous star formation models yield a better approximation to the true stellar age of the LSB host than the usually adopted continuous star formation SFH models (see for an update and a further discussion Papaderos & Östlin PapaderosOstlin12 (2012)).
3.7 Star formation and the age of the current burst in HS 2236+1344
The H flux in Table 3 translate by the adopted distance and the Kennicutt (K98 (1998)) conversion formula after correction for a Kroupa IMF (Calzetti et al. C07 (2007)), SFR(M⊙ yr-1) = 5.3 10-42 L(H) ergs s-1, to an integrated SFR of 0.587 M⊙ yr-1. The SFRs in regions 1, 2 and 3 are estimated to be 0.075, 0.124 and 0.216 M⊙ yr-1, respectively. The corresponding SFR per unit of area () is then 0.629, 0.695 and 1.810 M⊙ yr-1 kpc-2, by some factors larger than the integrated value for the galaxy (0.145 M⊙ yr-1 kpc-2). Note that the in individual regions are comparable with values determined for higher-metallicity starburst galaxies (0.1 M⊙ yr-1 kpc-2; Daddi et al. D10 (2010)) and larger than typical values for normal spirals (0.1 M⊙ yr-1 kpc-2; Kennicutt K98 (1998)). The integrated in HS 2236+1344 is also larger than the ones found in other BCD galaxies, such as Mrk 36 and UM 461 0.039 and 0.052 M⊙ yr-1 kpc-2 (Lagos et al. L11 (2011)), respectively, and local cometary/tadpole SF galaxies (0.01 M⊙ yr-1 kpc-2; Elmegreen et al. ED12 (2012)), yet comparable with the SFR in 30 Doradus (0.36 M⊙ yr-1 kpc-2; Chen et al. C05 (2005)).
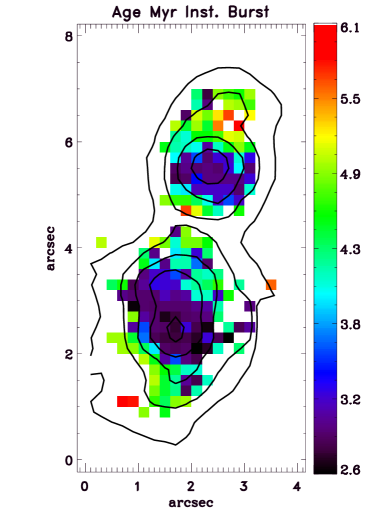
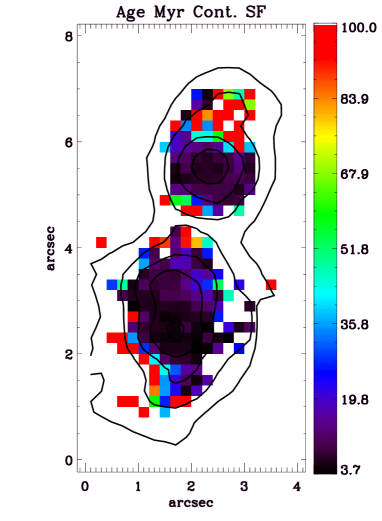
Following common practice, an estimate on the starburst age in HS 2236+1344 can be obtained from comparison of the observed EW(H) and EW(H) distribution with predictions from zero-dimensional evolutionary synthesis models. For this, we use Starburst99 models (Leitherer et al. L99 (1999)) for a metallicity Z=0.004, Geneva evolutionary stellar tracks, and a Kroupa initial mass function (M-1) with =1.3 for stellar masses between 0.1 to 0.5M⊙ and =2.3 between 0.5 and 100M⊙. For the SFH we consider the limiting cases of a single burst and continuous star formation with a constant SFR of 0.075 and 0.170 M⊙yr-1 for regions 1 and 2+3, respectively. The stellar age, in the FoV, obtained from Starburst99 models for these two SFHs (Fig. 16) is very low (3 … 6 Myr) for the instantaneous burst model, and between 4 and 100 Myr for continuous star formation. We note that the assumed metallicity (Z=0.004) does not significantly affect the derived age, given that we obtain nearly the same age pattern when we assume a metallicity of Z=0.001. Figure 16 suggests that regions 1 and 2+3 were formed almost coevally some 3 Myr ago, assuming an instantaneous burst, whereas their surroundings and the arm-like features appear to be slightly older. It should be born in mind that the EW maximum of nebular emission lines in starburst galaxies does not necessarily spatially coincide with the location of ionizing YSCs (e.g., Papaderos et al. P98 (1998, 2002), Guseva et al. Guseva04 (2004), Lagos et al. L07 (2007), Papaderos & Östlin PapaderosOstlin12 (2012)), consequently EW maps are not always convertible into stellar age maps via standard evolutionary synthesis models (e.g., Starburst99). The unknown SFH is another important source of uncertainty in converting H luminosities into SFRs for starburst galaxies (e.g., Weilbacher & Fritze von Alvensleben Weilbacher01 (2001)), just like the fraction of ionizing Lyman continuum photons leaking out of SF regions and galaxies (e.g., see also Guseva et al. Guseva07 (2007), Relaño et al. Relano12 (2012), Papaderos et al. P13 (2013), Bergvall et al. Bergvall13 (2013)). Therefore, the estimates above are indicative only, and are merely provided for the sake of comparison with other studies of local SF galaxies.
We re-iterate that several studies point to similar physical conditions across the ISM of XBCD (P12), H ii/BCDs (e.g., UM 408, and Tol 0104-388 and Tol 2146-391; Lagos et al. L09 (2009, 2012)) and to nearly coeval SF activity in these systems on spatial scales of 1 kpc (e.g., Lagos et al. L11 (2011)). Whereas most low-luminosity BCDs show a smooth morphology in their LSB host, luminous ( mag) ones often show tidal distortions on deep images (e.g., Bergvall & Östlin BO02 (2002), Lagos et al. L07 (2007)), suggesting strong interactions or merging as the primary triggering agent of their starburst activity (e.g., Taylor et al. Taylor95 (1995), Pustilnik et al. 2001a , Brosch et al. B04 (2004), Ekta et al. E08 (2008)). If SF activity in HS 2236+1344 is due to a recent or ongoing merger, as suggested by Moiseev et al. (M10 (2010)), a flatter metallicity distribution may be evolve through transport and mixing of metals (e.g., Rupke et al. R10 (2010), Montuori et al. Mo10 (2010)) following tidal tail formation. Thus far, in most studies on chemical abundances in SF dwarf galaxies (e.g., Lee & Skillman LS04 (2004), Kehrig K08 (2008), Lagos et al. L09 (2009, 2012)) there are no clear evidences of abundance variations. Therefore, the overall chemical homogeneity of the warm ISM in HS 2236+1344 suggests an efficient dispersal and mixing of heavy elements. In any case, we emphasize that given the uncertainties, in this study, we must consider the abundances across the galaxy as fairly homogeneous. On the other hand, the estimated age of the GH iiRs, found in this galaxy, suggests that the current, large-scale, burst started recently and likely simultaneously. Therefore, the triggering mechanism (i.e., minor interactions or infall of gas from the halo) may be related to the overall physical conditions of the ISM, particularly the gas surface density, in conjunction with small stochastic effects.
Clearly, detailed studies of the ISM with IFU spectroscopy (see, e.g., Lagos & Papaderos LP13 (2013)) have the potential of greatly improving our understanding of the evolution of chemical abundance patterns and star formation in H ii/BCD galaxies.
4 Summary
Our spatially resolved study of the warm ISM in the XBCD galaxy HS 2236+1344 by means of IFU spectroscopy yields the following conclusions:
-
1.
HS 2236+1344 contains three GH iiRs with an H luminosity in the range 1 4 1040 erg/s. The high-angular resolution acquisition image of the galaxy additionally shows some faint arm-like structures in the close vicinity of the northern and southern GH iiR, which might be of tidal origin or due to expanding gas shells. The structure of the ionized gas, as traced both by the emission lines and the continuum are fairly similar.
-
2.
The H velocity field vr(H) of the galaxy shows a smooth gradient along its major axis, with a difference of about 80 km s-1 between its receding northwestern and approaching southeastern half. The observed velocity range is comparable to values determined for other BCDs (e.g., van Zee et al. v01 (2001)).
-
3.
A comparison of EW(H) and EW(H) maps with predictions from the evolutionary synthesis code Starburst99 suggests that the three GH iiRs in HS 2236+1344 were formed almost coevally less than 3 Myr ago. The estimated SFR surface density of 0.2 M⊙ yr-1 kpc-2 is larger than the ones found in other low-luminosity H ii/BCD galaxies (Lagos et al. L11 (2011)) and local cometary/tadpole SF galaxies (Elmegreen et al. 2012). Surface brightness profiles, derived from SDSS data, reveal a compact underlying stellar host, which presumably indicates that HS 2236+1344 has undergone previous SF activity, as was found to be the case in most XMP BCDs studied as yet (e.g., Papaderos et al. P08 (2008)).
-
4.
The high-ionization He ii 4686 emission line is detected in HS 2236+1344. Similar to many BCDs with He ii 4686 emission, HS 2236+1344 shows no WR bump. The spatial distribution of this high-ionization emission, observed in this study, suggests that H ii 4686 in HS 2236+1344 is associated with the current burst of star formation.
-
5.
We calculated the spatial distribution of oxygen and nitrogen, and their ratio, based on spaxels with reliable Te(O iii) determinations. The oxygen abundance in the three resolved GH iiRs is consistent, within uncertainties, with the integrated value of 12+log(O/H)=7.530.06, suggesting a nearly constant metallicity across the ISM of HS 2236+1344. With regard to the nitrogen-to-oxygen abundance ratio, we derive a value of log(O/N)=-1.570.19 for the integrated spectrum, in good agreement with N/O determinations for other XBCDs (log(N/O)-1.6). The overall chemical homogeneity of the warm ISM in HS 2236+1344 suggests, in line with previous studies, an efficient dispersal and mixing of heavy elements in the lowest-metallicity H ii/BCD galaxies.
Acknowledgements.
We would like thank the anonymous referee for his/her comments and suggestions which substantially improved the paper. P.L. is supported by a Post-Doctoral grant SFRH/BPD/72308/2010, funded by Fundação para a Ciência e a Tecnologia (FCT). P.P. is supported by Ciencia 2008 Contract, funded by FCT/MCTES (Portugal) and POPH/FSE (EC). J.M.G. is supported by a Post-Doctoral grant SFRH/BPD/66958/2009, funded by FCT (Portugal). P.L., P.P. and J.M.G. acknowledge support by the FCT under project FCOMP-01-0124-FEDER-029170 (Reference FCT PTDC/FIS-AST/3214/2012), funded by the FEDER program. A.V.S.C. acknowledge financial support from Consejo Nacional de Investigaciones Científicas y Técnicas, Agencia Nacional de Promoción Científica y Tecnológica (PICT 2010-0410), and Universidad Nacional de La Plata (Argentina). This research has made use of the NASA/IPAC Extragalactic Database (NED) which is operated by the Jet Propulsion Laboratory, California Institute of Technology, under contract with the National Aeronautics and Space Administration. Based on observations obtained at the Gemini Observatory (Program ID: GN-2010B-Q-69), which is operated by the Association of Universities for Research in Astronomy, Inc., under a cooperative agreement with the NSF on behalf of the Gemini partnership: the National Science Foundation (United States), the Science and Technology Facilities Council (United Kingdom), the National Research Council (Canada), CONICYT (Chile), the Australian Research Council (Australia), Ministério da Ciência e Tecnologia (Brazil) and Ministerio de Ciencia, Tecnología e Innovación Productiva (Argentina).References
- (1) Adamo, A., Östlin, G., Zackrisson, E. et al. 2011, MNRAS, 415, 2388
- (2) Allington-Smith, J., Graham, M., Content, R., Dodsworth, G., Davies, R., Miller, B. W., Jørgensen, I., Hook I., Crampton, D., & Murowinski, R. 2002, PASP, 114, 892
- (3) Alloin, D., Collin-Souffrin, S., Joly, M., & Vigroux, J. M., 1979, A&A, 78, 200
- (4) Amorín, R., Aguerri, J. A., Muñoz-Tuñón, C., Cairós, L. M. 2009, A&A, 501, 75
- (5) Amorín, R., Pérez-Montero, E., Vílchez, J.M., Papaderos, P. 2012, ApJ, 749, 185
- (6) Baldwin, J. A., Phillips, M. M., & Terlevich, R. 1981, PASP, 93, 5
- (7) Bergvall, N., & Östlin, G. 2002, A&A, 390, 891
- (8) Bergvall, N. 2012, in Dwarf Galaxies: Keys to Galaxy Formation and Evolution, proceedings of JENAM 2010 (Lisbon, September 2010), P. Papaderos, S. Recchi & G. Hensler (eds.), Springer Verlag, p. 175
- (9) Bergvall, N., Leitet, E., Zackrisson, E., Marquart, T. 2013, A&A, 554, 38
- (10) Brinchmann, J., Kunth, D., & Durret, F. 2008, A&A, 485, 657
- (11) Brosch, N., Almoznino, E., & Heller, A. B. 2004, MNRAS, 349, 357
- (12) Cairós, L. M., Caon, N., González-Pérez, J. N. et al. 2001, ApJS, 133, 321
- (13) Cairós, L. M., Caon, N., Zurita, C., Kehrig, C., Weilbacher, P., & Roth, M. 2009, A&A, 507, 1291
- (14) Cairós, L.M., Caon, N. García Lorenzo, B., Kelz1, A., Roth, M. M., Papaderos, P., & Streicher, O. 2012, A&A, 547, 24
- (15) Calzetti, D. et al. 2007, ApJ, 666, 870
- (16) Cardamone, C., Schawinski, K., Sarzi, M. et al. 2009, MNRAS, 399, 1191
- (17) Cardelli, J. A., Clayton, G. C., & Mathis, J. S., 1989, ApJ, 345, 245
- (18) Chen, C.-H. R., Chu, Y.-H., & Johnson, K. E. 2005, ApJ, 619, 779
- (19) Daddi, E., Elbaz, D., Wlater, F., Bournaud, F., Salmi, F., Carilli, C., Dannerbauer, H., Dickinson, M., Monaco, P., & Riechers, D. 2010, ApJL, 714, 118
- (20) Denicoló, G., Terlevich, R., & Terlevich, E. 2002, MNRAS, 330, 69
- (21) De Robertis, M. M., Dufour, R. J., & Hunt, R. W. 1987, JRASC, 81, 195
- (22) Dopita, M. A., & Sutherland R. S. 1996, ApJS, 102, 161
- (23) Edmunds, M. G. & Pagel, B. E. J. 1978, MNRAS, 185, 77
- (24) Ekta, B., Chengalur, J. N., & Pustilnik, S. A. 2008, MNRAS, 391, 881
- (25) Elmegreen, D. M., Elmegreen, B. G., Rubin, D. S. et al. 2005, ApJ, 631, 85
- (26) Elmegreen, D. M., Elmegreen, B. G., Ravindranath, S. et al. 2007, ApJ, 658, 763
- (27) Elmegreen, D. M., Elmegreen, B. G., Sánchez Almeida, J., Muñoz-Tuñón, C., Putko, J., & Dewberry, J. 2012, ApJ, 750, 95
- (28) Filho, M., Winkel, B., Sánchez Almeida, J. Aguerri, J. A., Amorín, R., Ascasibar, Y., Elmegreen, B. G., Elmegreen, D. M., Gomes, J. M., Humphrey, A., Lagos, P., Morales-Luis, A. B., Muñoz-Tuñón, C., Papaderos, P., Vílchez, J. M. 2013, A&A, 558, A18
- (29) Gil de Paz, A., Madore, B. F., & Pevunova, O. 2003, ApJS, 147, 29
- (30) Guseva, N. G., Izotov, Y. I., & Thuan, T. X. 2000, ApJ, 531, 776
- (31) Guseva, N. G., Papaderos, P., Izotov, Y. I., Noeske, K. G., & Fricke, K. J. 2004, A&A, 421, 519
- (32) Guseva, N. G., Izotov, Y. I., Papaderos, P., & Fricke, K. J. 2007, A&A, 464, 885
- (33) Guseva, N. G., Papaderos, P., Meyer, H. T., Izotov, Y. I., & Fricke, K. J. 2009, A&A, 505, 63
- (34) Guzmán, R., Jangren, A., Koo, D. C., Bershady, M. A., & Simard, L. 1998, ApJ, 495, L13
- (35) Hook I., Jrgensen I., Allington-Smith J. R., Davies R. L., Metcalfe N., Murowinski R. G., & Crampton D. 2004, PASP, 116, 425
- (36) Izotov, Y. I., Dyak, A. B., Chaffee, F. H. et al. 1996, ApJ, 458, 524
- (37) Izotov, Y. I., Lipovetsky, V. A., Chaffee, F. H., Foltz, C. B., Guseva, N. G., & Kniazev, A. Y. 1997a, ApJ, 476, 698
- (38) Izotov, Y. I., Foltz, C. B., Green, R. F., Guseva, N. G., & Thuan, T. X. 1997b, ApJ, 487, 37
- (39) Izotov, Y. I., & Thuan T. X. 1999, ApJ, 511, 639
- (40) Izotov, Y. I., Thuan, T. X., & Guseva, N. G. 2005, ApJ, 415, 87
- (41) Izotov, Y. I., Schaerer, D., Blecha, A., Royer, F., Guseva, N. G., & North, P. 2006a, A&A, 459, 71
- (42) Izotov, Y. I., Papaderos, P., Guseva, N. G., Fricke, K. J., & Thuan, T. X. 2006b, A&A, 454, 137
- (43) Izotov, Y. I., & Thuan T. X. 2007, AJ, 665, 1115
- (44) Izotov, Y. I., Guseva, N. G., Fricke, K. J., & Papaderos, P. 2009, A&A, 503, 61
- (45) Izotov, Y. I., & Thuan T. X. 2009, ApJ, 690, 1797
- (46) Izotov, Y. Y., Thuan, T. X., & Guseva, N. G. 2012, A&A, 546, 122
- (47) Kehrig, C., Vílchez, J. M., Sánchez, S. F., Telles, E., Pérez-Montero, E., & Martín-Gordón, D. 2008, A&A, 477, 813
- (48) Kehrig, C., Pérez-Montero, E., Vílchez, J. M., et al. 2013, MNRAS, 432, 2732
- (49) Kennicutt, R. C. 1998 ARA&A, 36, 189
- (50) Kewley, L. J., Dopita M. A., Sutherland R. S., Heisler C. A., & Trevena J. 2001, ApJ, 556, 121
- (51) Kniazev, A. Y., Pustilnik, S. A., Grebel, E. K., Lee, H., & Pramskij, A. G. 2004, ApJ Suppl. 153, 429
- (52) Kobulnicky, H. A., & Skillman, E. D. 1997, ApJ, 489, 636
- (53) Kobulnicky, H. A., Skillman, E. D., Roy, J.-R., Walsh, J. R., & Rosa M. R. 1997, ApJ, 477, 679
- (54) Krabbe, A. C., Rosa, D. A., Dors, O. L., Pastoriza, M. G., Winge, C., Hägele, G. F., Cardaci, M. V., & Rodrigues, I. 2014, MNRAS, 437, 1155
- (55) Kunth, D., & Sargent, W. L. W. 1983, ApJ, 273, 81
- (56) Kunth, D., & Sargent, W. L. W. 1986, ApJ, 300, 496
- (57) Kunth, D., & Östlin, G. 2000, ARA&A, 10, 1
- (58) Lagos, P., Telles, E., & Melnick, J. 2007, A&A, 476, 89
- (59) Lagos P., Telles E., Muñoz-Tuñón, C., Carrasco, E. R., Cuisinier F., & Tenorio-Tagle G. 2009, AJ, 137, 5068
- (60) Lagos, P., Telles, E., Nigoche-Netro, A., & Carrasco, E. R. 2011, AJ, 142, 162
- (61) Lagos, P., Telles, E., Nigoche-Netro, A., & Carrasco, E. R. 2012, MNRAS, 427, 740
- (62) Lagos, P., & Papaderos, P. 2013, AdAst, 2013, 20
- (63) Lee, H., & Skillman, E. D. 2004, ApJ, 614, 698
- (64) Leitherer, C., et al. 1999, ApJS, 123, 3
- (65) Lequeux, J., & Viallefond, F. 1980, A&A, 91, 269
- (66) Loose, H.-H., & Thuan, T. X. 1986, ApJ, 309, 59
- (67) López-Sánchez, A. R., Mesa-Delgado, A., López-Martín, L., & Esteban, C. 2011, MNRAS, 411, 2076
- (68) López-Hernández, J., Terlevich, E., Terlevich, R., Rosa-González, D., Díaz, A., García-Benito, R., Vílchez, J., & Hägele, G. 2013, MNRAS, 430, 472
- (69) Moiseev, A. V., Pustilnik, S. A., & Kniazev, A. Y. 2010, MNRAS, 405, 2453
- (70) Montuori, M., Di Matteo, P., Lehnert, M. D., Combes, F., & Semelin, B. 2010, A&A, 518, 56
- (71) Morales-Luis, A. B., Sánchez Almeida, J., Aguerri, J. A. L., & Muñoz-Tuñón, C. 2011, ApJ, 743, 77
- (72) Noeske, K. G., Iglesias-Páramo, J., Vílchez, J. M., Papaderos, P., & Fricke, K. J. 2001, A&A, 371, 806
- (73) Noeske, K. G., Koo. D. C. Phillips, A. C., et al. 2006, ApJ, 640, 143
- (74) Osterbrock, D. E., & Ferland, G. J. 2006, Astrophysics of gaseous nebulae and active galactic nuclei, 2nd. edn. (Sausalito, CA: University Science Books)
- (75) Östlin, G., Zackrisson, E., Bergvall, N., & Rönnback, J. 2003, A&A, 408, 887
- (76) Pagel, B. E. J., Simonson E. A., Terlevich R. J., & Edmunds, M. G. 1992, MNRAS, 255, 325
- (77) Papaderos, P., Loose, H.-H., Thuan, T. X., & Fricke, K. J. 1996a, A&AS, 120, 207
- (78) Papaderos, P., Loose, H.-H., Fricke, K. J., & Thuan, T. X. 1996b, A&A, 314, 59
- (79) Papaderos, P., Izotov, Y. I., Fricke, K. J., & Thuan, T. X., Guseva, N. G. 1998, A&A, 338, 43
- (80) Papaderos, P., Izotov, Y. I., Thuan, T. X., Noeske, K. G., Fricke, K. J., Guseva, N. G., & Green, R. F. 2002, A&A, 393, 461
- (81) Papaderos, P., Izotov, Y. I., Guseva, N.G., Thuan, T. X., & Fricke, K. J. 2006, A&A, 454, 119
- (82) Papaderos, P., Guseva, N. G., Izotov, Y. I., & Fricke, K. J. 2008, A&A, 491, 113
- (83) Papaderos, P. 2012, in Dwarf Galaxies: Keys to Galaxy Formation and Evolution, proceedings of JENAM 2010 (Lisbon, September 2010), P. Papaderos, S. Recchi & G. Hensler (eds.), Springer Verlag, p. 321
- (84) Papaderos, P., & Östlin, G. 2012, A&A, 537, A126
- (85) Papaderos, P., Gomes, J. M., Vílchez, J. M. et al. 2013, A&A Letters, 555, 1
- (86) Pérez-Montero, E., Vílchez, J. M., Cedrés, B., Hägele, G. F., Mollá, M., Kehrig, C., Díaz, A. I., García-Benito, R., & Martín-Gordón, D. 2011, A&A, 532, 141
- (87) Pustilnik, S. A., Kniazev, A. Y., Lipovetsky, V. A., & Ugryumov, A. V. 2001a, A&A, 373, 24
- (88) Pustilnik, S. A., Brinks, E., Thuan, T. X. Lipovetsky, V. A., & Izotov, Y.I. 2001b, AJ, 121, 1413
- (89) Pustilnik, S., Kniazev, A., Pramskij, A., Izotov, Y., Foltz, C., Brosch, N., Martin, J.-M., & Ugryumov, A. 2004, A&A, 419, 469
- (90) Pustilnik, S. A., & Martin, J.-M. 2007, A&A, 464, 859
- (91) Relaño, M., Kennicutt, R. C., Eldridge, J. J., Lee, J. C., & Verley, S. 2012, MNRAS, 423, 2933
- (92) Rupke, D. S. N., Kewley, L. J., & Barnes, J. E. 2010, ApJ, 710, 156
- (93) Sánchez Almeida, J., Morales-Luis, A. B., Muñoz-Tuñón, C., Elmegreen, D. M., Elmegreen, B. G., & Méndez-Abreu, J. 2014, ApJ, 783, 45
- (94) Shirazi, M., & Brinchmann, J. 2012, MNRAS, 421, 1043
- (95) Skillman, E. 2012, in Dwarf Galaxies: Keys to Galaxy Formation and Evolution, proceedings of JENAM 2010 (Lisbon, September 2010), P. Papaderos, S. Recchi & G. Hensler (eds.), Springer Verlag, p. 3
- (96) Straughn, A. N., Cohen, S. H., Ryan, R. E., et al. 2006, ApJ, 639, 724
- (97) Taylor, C. L., Brinks, E., Grashuis, R. M., & Skillman, E. D. 1995, ApJ Suppl. 99, 427
- (98) Telles, E., Melnick, J., & Terlevich, R. 1997, MNRAS, 288, 78
- (99) Telles, E., & Terlevich, R. 1997, MNRAS, 286, 183
- (100) Telles, E., & Maddox, S. 2000, MNRAS, 311, 307
- (101) Telles, E. 2010, ASPC, 423, 65
- (102) Tenorio-Tagle, G. 1996, AJ, 111, 1641
- (103) Terlevich, R., Melnick, J., Masegosa, J., Moles, M., & Copetti, M. V. F. 1991, A&A Suppl. 91, 285
- (104) Thuan, T. X. & Martin, G. E. 1981, ApJ, 247, 823
- (105) Thuan, T. X., & Izotov, Y. I. 2005, ApJS, 161, 240
- (106) Thuan, T. X., Lecavelier des Etangs, A.. & Izotov, Y. I. 2005, ApJ, 621, 269
- (107) van den Bergh, S., Abraham, R. G., & Ellis, R. S. et al. 1996, AJ, 112, 359
- (108) van Zee, L., Salzer, J. J., & Skillman, E. D. 2001, AJ, 122, 121
- (109) Walsh, J. R., & Roy, J. R. 1989, MNRAS, 239, 297
- (110) Weilbacher, P. M., & Fritze-v. Alvensleben, U. 2001, A&A, 373, L9
- (111) Windhorst, R. A., Cohen, S. H., Straughn, A. N., et al. 2006, New Astron. Rev., 50, 821