Structural and Magnetic Dynamics in the Magnetic Shape Memory Alloy Ni2MnGa
Abstract
Magnetic shape memory Heusler alloys are multiferroics stabilized by the correlations between electronic, magnetic and structural order. To study these correlations we use time resolved x-ray diffraction and magneto-optical Kerr effect experiments to measure the laser induced dynamics in a Heusler alloy Ni2MnGa film and reveal a set of timescales intrinsic to the system. We observe a coherent phonon which we identify as the amplitudon of the modulated structure and an ultrafast phase transition leading to a quenching of the incommensurate modulation within 300 fs with a recovery time of a few ps. The thermally driven martensitic transition to the high temperature cubic phase proceeds via nucleation within a few ps and domain growth limited by the speed of sound. The demagnetization time is 320 fs, which is comparable to the quenching of the structural modulation.
Multiferroic materials which exhibit large responses to electromagnetic and stress fields are of great interest for novel technical applications. To guide their rational design the microscopic origin of their functional properties must be understood which requires methods that can disentangle the interplay between electronic, magnetic and structural degrees of freedom. A prototypical example is the optimization of ferromagnetic X2YZ Heusler alloys, where one class shows novel functional properties such as magnetic shape memory and magnetocaloric effects due to the coexistence of ferromagnetism and a structural martensitic (MT) transition Planes2009, and another class is half-metallic and suitable for spintronic applications Graf2011. Ni2MnGa is the classical Heusler magnetic shape memory alloy with a magnetically induced strain of up to 10% arising from the interplay between magnetic and structural domains in the twinned low temperature MT phase Ullakko1996; Murray2000; Sozinov2002; Planes2009. The structure of the MT phase changes with alloy composition Lanska2004, but the modulated phases (commonly labelled 5M and 7M) Righi2007; Righi2008 displaying magnetic shape memory only exist if the MT transition temperature is lower than the Curie temperature Lanska2004; Mariager2014. In these structures the minimum in free energy is shifted such that the lattice constant ratio is in the splitting (tetragonal or orthorhombic) of the high temperature cubic austenite (AUS) phase, compared to the usual global minimum found at in the non-modulated tetragonal phase. Theoretical studies suggest that the modulation of the structure stabilizes this new minimum Bungaro2003; Zayak2004; Entel2013. In Ni2MnGa compounds, we then have a situation where the interplay between an incommensurate structural modulation, a splitting of the electronic states due to the tetragonal or orthorhombic distortion of the cubic lattice and the ferromagnetic order combine to stabilize a phase displaying a large magnetic shape memory effect.
In this letter we study this interplay by employing ultrafast time resolved x-ray and optical methods to separate the three types of order in time and to investigate the possible coupling between ferromagnetism and the modulated structure. We measure a satellite reflection sensitive to the modulated structure, a (202) Bragg reflection sensitive to the orthorhombic splitting, and optically, the change in the magnetization. This allows us to separate the fast electronic processes from thermally driven ones as we, upon photoexcitation, follow the evolution from the low temperature MT phase to the high temperature AUS phase. We quantify the relevant phonon modes and intrinsic time scales and show that while the modulation of the structure and the magnetization are quenched on the same timescale, they have different recovery times.
The 1 m thick Ni2.085Mn1.133Ga0.782 film was grown by dc-magnetron sputtering on a MgO(100) substrate with a 100 nm Chrom buffer layer Jakob2007; Eichhorn2011. The Curie temperature is = 368 K and the transition temperature measured as the average of onset and completion is 349 K upon cooling and 354 K upon heating. The crystal structure of the MT phase was measured at the Material Science beamline of the Swiss Light Source Willmott2013 to be orthorhombic with MT twinning leading to 12 different MT domains as observed in similar films Khachaturyan1983; Klaer2011; Eichhorn2012. The MT structure is modulated Zheludev1996; Righi2007; Mariager2014 but unlike the single modulation wavevector with of single crystal Ni2MnGa, the film has two modulation wavevectors with and in reciprocal lattice units of the orthorhombic lattice. The first wavevector is close to the found for the 7M structure Righi2008.
The time-resolved x-ray diffraction was performed at an x-ray energy of 5 keV using a synchrotron slicing source (200 ph/pulse, 2 kHz and 1.2 %bw) as probe and an 800 nm, 120 fs 1 kHz p-polarized laser pulse at incidence as pump (absorption length nm Zhou2002), giving a total time resolution of 200 fs Beaud2007. The x-ray spot was focused horizontally to 400m, vertically to 10m and the gracing incidence angle was set to (absorption length nm Henke1993) to match the penetration depth of the x-ray probe to the laser pump. The experiments were carried out at a sample temperature of 340 K.
The time resolved magneto-optical Kerr (tr-MOKE) effect was measured in a polar geometry with the pump laser at normal incidence (), the probe at and a 0.6 T magnetic field. The 80 fs 800 nm pump and probe beams were cross polarized to minimize pump scatter. The detection was done with two balanced photodiodes and the signal was enhanced by measuring at a small heterodyne angle. The MOKE signal is found as the difference between two opposite magnetic fields and is proportional to the out of plane magnetization if in-plane dynamics and second order terms are ignored You1996.
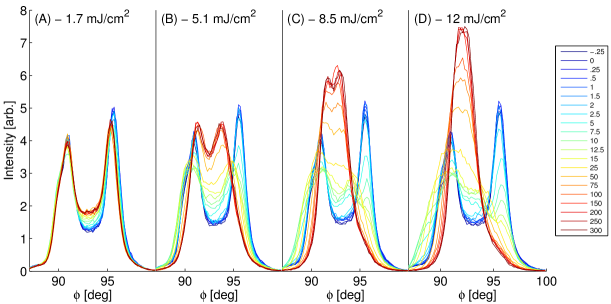
In Figure 1(a) we present the dynamics of the (20201) reflection, where the two extra indices label the first satellite of the (202) reflection, arising from the second modulation. At low laser pump fluences (0.9 mJ/cm2 absorbed) we observe a 1.2 THz oscillation caused by a coherent optical phonon. As the fluence is increased both the amplitude and damping of the oscillation increase, and a recovery of the intensity on a picosecond timescale is evident. At high fluence (12.2 mJ/cm2) a fast drop of the intensity occurs within fs which roughly corresponds to a quarter of the fastest measured phonon period. At these high fluences the disappearance of the peak is a clear sign that the structural modulation is gone and that an ultrafast phase transition resulting in an increase in crystal symmetry has occurred. The fact that the intensity does not drop completely to zero can be attributed to the finite x-ray and laser penetration depths.
A structural change solely due to a change in the modulation amplitude identifies the observed coherent phonon as the amplitudon, for which the corresponding phason mode has previously been observed by neutron scattering Shapiro2007. This interpretation is supported by the measurement of the MT (202) Bragg reflection shown in Figure 1(b). On short timescales the intensity of the (202) reflection increases, indicating an increase in orthorhombic order consistent with the suppression of the modulation. At low fluence (0.9 mJ/cm2) a very weak oscillation appears. The drop in intensity after 1.5 ps for the data taken at 12.2 mJ/cm2 is due to the thermal expansion and the MT to AUS transition.
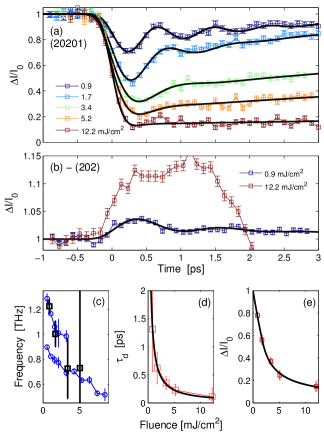
To quantify the observed oscillation the data of the (20201) peak was fitted with the function , convolved with a gaussian function accounting for the time resolution. This function with cosine phase describes a displacive excitation Zeiger1992 resulting in a damped () oscillation around a new equilibrium position (1-A). The second exponential accounts for the observed recovery (). This choice for I(t) assumes that the x-ray structure factor is proportional to the modulation amplitude and accounts for the intensity being proportional to the square of the structure factor.
In Figure 1(c) the frequencies obtained from the fits are plotted together with the frequencies obtained from time resolved optical reflectivity measurements. At low fluence the x-ray and optical data are in good agreement for one of the two observed optical phonon branches while frequencies cannot reliable be extracted from the x-ray data at higher fluences. In stoichiometric Ni2MnGa single crystals we observed only a single frequency in optical experiments Mariager2012a, in agreement with the existence of a single modulation wavevector Mariager2014. In the present film sample we observe two modulation wavevectors and two frequencies. While the frequencies correspond to the excitation of two amplitudons, as observed the (20201) reflection is only sensitive to one of these. On the other hand, the (202) peak should be sensitive to both the 0.8 and 1.2 THz oscillations, again consistent with the data.
To support the model of an amplitudon we plot the change in intensity of the (20201) reflection immediately after excitation in Figure 1(e), extracted from the fits as . The initial linear drop in intensity vs fluence ( mJ/cm2) indicates a linear decrease in modulation amplitude with laser fluence, while the gradual drop at higher fluences is due to the comparable x-ray and laser penetration depths. To illustrate this we fit the fluence curve with a simple model. We assume that the transient equilibrium modulation amplitude x is linear in laser fluence for and = 0 for . As a function of depth in the sample we write for where is the amplitude before excitation. We then calculate the lattice sum over the lattice planes into the crystal as , with the measured intensity given as . Here = 2 is the out of plane reciprocal lattice coordinate and F is the unit cell structure factor which for a satellite reflection of an incommensurate modulation is proportional to a first order Bessel function, Smaalen2007. The fit then only depends on the ratio of the x-ray to laser penetration depths and the critical incident fluence . As seen in Figure 1(e) the fit describes the data very well () with and mJ/cm2. We note that the fit is independent of the initial value in the linear regime of the Bessel function (). For comparison several other models for x(z) have been tested as outlined in the supplementary material Supplementary. To conclude the model shows how the transient equilibrium amplitude of the modulation changes linearly with the laser excitation, which leads to a displacive excitation of the amplitude mode.
The oscillations are absent at high fluences due to the strong damping, which is shown as a function of fluence in Figure 1(d). For the observed fluence range the damping time is inversely proportional to the fluence, as illustrated by the fit (, ps).
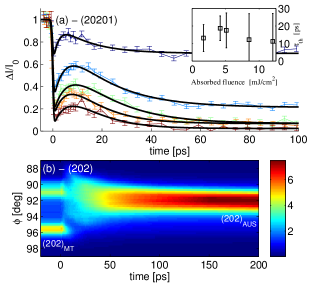
The ultrafast electronic quenching of the modulation is distinctly different from the slower thermally driven martensite transition. For comparison we show in Figure 2(a) the evolution of intensity of the (20201) reflection up to 100 ps. On this timescale the initial coherent dynamics are only visible as an immediate drop in intensity followed by a gradual recovery. This recovery is consistent with a thermalization of the electrons and the lattice leading to a restoration of the potential which give rise to the modulation. On longer timescales a second drop in intensity occurs, which at high fluences leads to a complete quenching of the modulation. To extract the timescales the data was fitted using accounting for the initial drop (), the recovery () and a second exponential drop (). The weighted mean of the recovery times is ps. The transition time shown in the inset in Figure 2(a) does not depend on the excitation fluence and has a mean value of ps. Due to the short x-ray absorption length the exponential drop in intensity is expected for a transition moving into the crystal at a constant speed, and nucleated MT domains are known to grow at the speed of sound Khachaturyan1983. The speed of sound in the [100] direction of the modulated structure is estimated to be nm/ps Li2011. A phase transition moving into the crystal at this speed would produce an exponential change in intensity with a time constant of ps. Accounting for the thermalization time between the electrons and the lattice we conclude that nucleation occurs mainly within the first 10 ps after excitation. The existence of the intermediate recovery however shows that the initial electronic quenching does not directly launch the final thermal phase transition.
The change in intensity of the satellite reflection can be compared to the change of the regular lattice peaks shown in Figure 2(b). Rocking curve scans obtained at different time delays show how the (202) MT peaks transform to a single AUS (202) reflection at a pump fluence of 12.2 mJ/cm2. The fast disappearance of the MT peaks is best seen at , where we extract a timeconstant of ps, in agrement with the time found for the (20201) reflection. That is, on this thermal timescale the disappearance of the MT splitting and the incommensurate modulation proceed together. The rising AUS lattice peak () exhibits significantly slower dynamics with a rise time of 200 ps. This is due to the fact that the thin top layer directly probed by the x-rays is oriented and strained by the lower part of the film. The transformation of the entire film is limited by the speed of sound, leading to a timescale of approximately (1 m)/(5 nm/ps) = 200 ps.
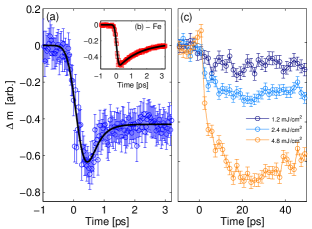
As pointed out in the introduction, the modulated structures only exist if . This raises the question if the modulation is stabilized by an interaction between structural and magnetic order. To explore this we measured the demagnetization time after laser excitation. The tr-MOKE data at times up to 3 ps are shown in Figure 3(a), with a reference trace measured on an Fe(001) single crystal shown for comparison in the insert. In both traces we observe a fast drop usually assigned to the demagnetization Kirilyuk2010; Malinowski2008, as well as a partial recovery of the signal. The Fe trace shows a demagnetization time of and is in good agreement with previous experiments Kampfrath2002. In Ni2MnGa we find a demagnetizaiton time of . Both demagnetization times were extracted by fitting the data with a step function combined with an exponential recovery. The Ni2MnGa demagnetization time is in agreement with those found for Heusler alloys with similar spin polarization factors, though these were measured in spintronic compounds with Aus structures Steil2010; Mann2012. We thus find that the demagnetization and the quenching of the structural modulation occur essentially simultaneously. If we instead measure the time evolution up to 50 ps as shown in Figure 3(c) the tr-MOKE data does not show an intermediate recovery, unlike the structural data in Figure 2(a). We conclude that the magnetization and the structural modulation have different dynamics after the initial drop. The modulation therefor then can not be stabilized by a direct coupling to the magnetic moment, though they are both rapidly quenched after the laser excitation of the electronic subsystem.
Upon laser excitation several timescales are present in Ni2MnGa. The structural modulation is fully quenched within 300 fs, about a quarter of the corresponding phonon period. The ferromagnetic order is quenched with a demagnetization time of 320 fs and the MT to AUS transition occurs after thermalization of the electron and lattice ( ps) with nucleation within 10 ps and the subsequent domain growth limited by the speed of sound. These timescales are independent of the excitation fluence and intrinsic to the system. The fact that the ultrafast structural transition appears before thermalization between the electrons and the lattice, and recovers upon thermalization despite the demagnetization indicates that the origin of the incommensurate modulation is the strong electron phonon interaction. A possible explanation is the destabilization of the incommensurate modulation by distortion of the Kohn anomaly Bungaro2003 near the Fermi edge via excitation of Ni electrons to unoccupied states just above the Fermi edge. Such states are available in both minority and majority bands Barman2005; Opeil2008 and the importance of Ni states for the structural transitions in Ni2MnGa has previously been outlined Jakob2007. An alternative mechanism could involve destruction of the suggested hybrid bonding between Ni d and Mn p states near the Fermi level Zayak2004; Kubler1983. On the other hand the quenching of both the modulation and the magnetism does not lead directly to the MT transition. The transition only occurs when a temperature above has been reached and all subsystems are in thermal equilibrium.
To summarize, we measured a coherent phonon mode and an ultrafast non-thermal structural transition in an incommensurately modulated Ni2MnGa film. Both the observation of this phase transition and the displacive excitation of the phonon is consistent with the concept of an amplitudon. The dynamics of this electronically driven ultrafast transition is distinctly different from the much slower thermally driven martensite transition, which proceeds with nucleation within 10 ps and domain growth limited by the speed of sound. The different recoveries of the demagnetization and the structural modulation indicates that the origin of the modulation is electronic. This examples shows how ultrafast pump-probe methods applying a variety of specific probes can be used to disentangle the different degrees of freedom in multiferroic materials.
Acknowledgements.
The x-ray experiments were performed on the X04SA and X05LA beamlines of the Swiss Light Source, Paul Scherrer Institut, Villigen, Switzerland. We thank P. Willmott, D. Grolimund and C. Borca for help. This work was supported by the Swiss National Foundation through NCCR MUST, by the DFG through SPP 1239 within Ja821/3-3 and by the Graduate School of Excellence “Materials Science in Mainz” (MAINZ).References
Supplementary Material
Appendix A Structure
The static x-ray diffraction experiments were performed at the Material Science beamline of the Swiss Light Source, with a (2D+2S) surface diffractometer equipped with a PILATUS 100K two-dimensional detector Willmott2013. The 2D detector allowed us to sample large three-dimensional reciprocal space volume data sets which were converted to I(h,k,l), intensity as a function of coordinates in reciprocal space Schleputz2011. From these data reciprocal space maps could subsequently be extracted. The x-ray energy was 17 keV and the x-ray incidence angle was kept constant to ensure a homogeneous footprint. The sample temperature was controlled using a nitrogen cryojet, and the transition temperatures were in agreement with magnetization measurements. The sample was initially oriented in the AUS phase, and the resulting orientation matrix was used as reference when cooling to the MT phase.
In Figure 4 we show reciprocal space maps through the reflection as the sample is cooled from 408 K to 290 K. As the temperature is lowered we first (T=372 K and 356 K) see the appearance of the satellite reflections from the pre-martensite phase Zheludev1996; Mariager2014, which has a modulation wavevector of with . As the MT transition is reached (T = 356 K and 335 K) the regular lattice peak is split and several Bragg reflections corresponding to different MT twins can be seen, though none coincide exactly with the shown lattice plane.
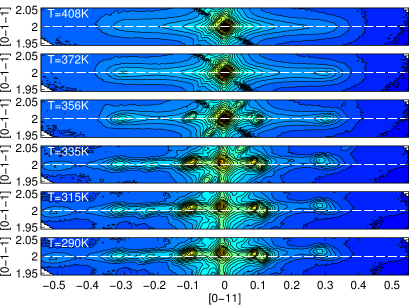
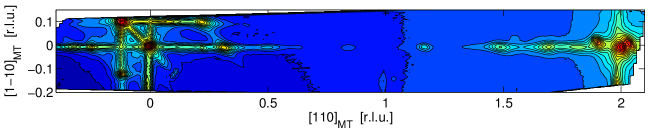
To identify the satellite reflections from the structural modulation of the MT phase, a cut has to be made between two MT peaks corresponding to the same twin. One example of such a reciprocal space map can be seen in Figure 5. It shows a cut including the and peaks corresponding to a single structural twin and can be used to identify the many satellite reflections located exactly between them.
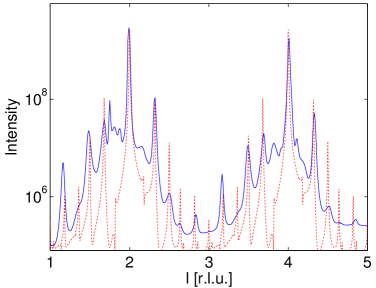
In Figure 6 we show an example of a line scan along such a rod. We note that this scan is representative, that is, if there are any satellite reflections between two Bragg reflections corresponding to a single twin, we observe exactly these peaks. This structure is somewhat similar to scans published by Eichhorn2011, where they attributed it to a 7M structure. We observe the following concerning the location of the satellite reflections. First, all peaks appear modulo 2 r.l.u. and in pairs at from the main reflections. In addition they are not placed at periodic intervals between the reflections with the main reflections occurring at . This is significantly different from the incommensurately modulated structure known from stochiometric Ni2MnGa Righi2007 and it is not consistent with the typical 5M or 7M phases in any of their manifestations. The symmetric reflections indicate a periodic modulation along the {110} axes of the sample, but the different deviations indicate that more than a single modulation period exists. In fact, the observed reflections are consistent with two wavevectors with and 0.51. Two such modulations will result in peaks at any combination of the modulation vectors, explaining the observed reflection at 0.83 (within the measurement precision). To test this we calculate the scattering from a structure with two such modulation periods Ustinov2009; Mariager2014 and as shown in Figure 6 the result is a very good agreement between observed and calculated peak positions. The intensities are not reproduced as the calculation did not include the unit cell formfactor, allowed for different modulation amplitude for different atoms or included experimental factors such as polarization and the Lorentz factor.
We finally emphasize that the observed Bragg reflections are not compatible with an adaptive phase Kaufmann2010. The satellite lattice reflections from such a structure would result in evenly spaced intermediate reflections, with only small possible deviations due to stacking faults Ustinov2009; Mariager2014
Appendix B Optical data
The photoinduced change in reflectivity was investigated in an optical pump-probe setup with a time resolution of fs. The 800 nm pump and probe pulse were generated with a 2 kHz Ti-Saphire laser system. The pump and probe pulses were cross polarized and incident along the [001] surface normal with the probe polarization aligned to the [100] crystal axis. The pump was focused to and the probe spot size was a factor of three smaller to ensure homogenous excitation of the probe region. The sample was mounted in a cryostat.
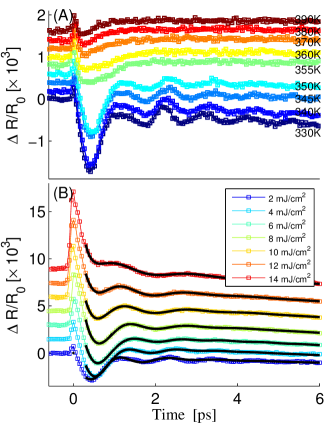
In Figure 7A we show the result of a time resolved optical pump-probe reflectivity measurements taken above and below with a pump fluence of 1 mJ/cm2. Below the signal shows clear oscillations, with a beating indicating the presence of more than a single frequency. Above no oscillations are present, beyond a single initial dip in reflectivity. In addition there is an initial electronic peak, whose amplitude as seen in Figure 7B scales with fluence. The phase transition is clearly visible as the active phonon modes change with the change in lattice symmetry. This behavior is qualitatively consistent with what we have observed in single crystal Ni2MnGa Mariager2012a. Both a Fourier analysis and a fit including two cosine functions reveal the existence of two distinct frequencies, around 1.3 and 0.9 THz just below TMT and hardening as the temperature is lowered. Given the two modulation wavevectors of the structure, the two coherent phonons can be attributed to two amplitudons, that is, an oscillation of the modulation amplitude. This is consistent with the existence of an amplitudon in stochiometric single crystal Ni2MnGa Mariager2012a. In Mariager2012a we could not distinguish between an amplitudon and a zone folded acoustic mode, but with the structure now absolutely determined as incommensurately modulated Mariager2014 the observed phonon can be assigned to the amplitudon.
Appendix C Amplitudon Model
In the fit in FIG.1(e) of the main paper we assumed that the modulation amplitude varied linearly with the laser fluence. Several other models have been tested. An assumption that the modulation amplitude falls of as a power of f results in a significantly worse fits ( for )). On the other hand a model with a true threshold where for and 0 for cannot be ruled out () due to the low number of data points at low fluence and gives mJ/cm2. This model is however complicated as it must be combined with the existence of a coherent phonon to account for the data in FIG.1(a) of the main text.
The critical fluence mJ/cm2 can be converted to a corresponding temperature, though this number depends on the laser absorption depth. For nm we find a critical energy density of 797 J/cm3, which is about 1 eV per unit cell or a temperature rise of 250 K. While it then appears that the energy needed to quench the modulation on an ultrafast timescale is significantly higher than the thermal energy needed to reach , one explanation might be that this energy is distributed in various electronic channels from which only a fraction contributes to quenching the modulation.
Appendix D Time resolved rocking curves
The data in FIG.2(b) of the main paper is composed from rocking curves (rotation of the sample around the surface normal) taken at different time delays. The rocking curves for four different pump fluences are shown in Figure 8. The un-pumped rocking curve, as seen in Figure 8A at t = -0.25 ps is, a combination of the rocking curves from 6 of the 12 MT twins, which are here probed in a single scan. The shape can be reproduced from the static x-ray data if one take into account the opening angles of the avalanche photo diode used for the time-resolved experiments. At a low fluence of 1.7 mJ/cm2 the transition is only seen as a small increase in intensity at the location of the AUS peak, while the majority of the film remains in the MT phase. Only at the high fluence of 12 mJ/cm2 in Figure 8D is the high temperature AUS phase reached. Here the entire film is transformed and a single strong AUS (202) Bragg reflection occurs at . At the intermediate fluences only parts of the film is transformed, resulting in a strained AUS structure.
The temperature rise due to a single laser pulse is given as:
| (1) |
The specific heat of Ni2MnGa is C = 0.35 - 0.4 J/gK and the density is . The laser penetration depth at nm is , the reflectivity is R = 0.15 and is the thickness of the layer in which the laser is absorbed. For m, the thickness of the film, the highest fluence of 12 mJ/cm2 corresponds to a temperature rise of K. This is just sufficient to raise the temperature of the film from 340 K to above , under the assumption that the heat is evenly distributed. This is in good agreement with the observed rocking curves where lower laser fluences only lead to a partial transformation.