Crystal field splitting in Srn+1IrnO3n+1 () iridates
probed by x-ray Raman spectroscopy
Abstract
Non-resonant Raman spectroscopy in the hard X-ray regime has been used to explore the electronic structure of the first two members of the Ruddlesden-Popper series Srn+1IrnO3n+1 of iridates. By tuning the photon energy transfer around 530 eV we have been able to explore the oxygen K near edge structure with bulk sensitivity. The angular dependence of the spectra has been exploited to assign features in the 528-535 eV energy range to specific transitions involving the Ir orbitals. This has allowed us to extract reliable values for both the – splitting arising from the cubic component of the crystal field (), in addition to the splitting of the orbitals due to tetragonal distortions. The values we obtain are (3.8, 1.6) eV and (3.55, 1.9) eV for Sr2IrO4 and Sr3Ir2O7, respectively.
I Introduction
transition metal oxides have recently attracted considerable interest as they display unusual properties primarily resulting from the effect of large spin-orbit coupling Kim et al. (2008); Moon et al. (2008); Kim et al. (2009); Pesin and Balents (2010); Wang and Senthil (2011); Kim et al. (2012a); Watanabe et al. (2013); Witczak-Krempa et al. (2014). Of particular interest is the electronic nature of Sr2IrO4Crawford et al. (1994) and Sr3Ir2O7Cao et al. (2002): despite the large bandwidth and weak correlation, both of which favour a metallic character, these systems are insulators. The opening of an electronic gap has been explained by means of a Hubbard-like model, in which the effect of correlation is enhanced by the strong spin-orbit coupling which narrows the effective bandwidth isolating the so-called stateKim et al. (2008, 2009). The state results from a particular hierarchy of energies at play, most especially the crystal field and the spin-orbit coupling.
Sr2IrO4 (Sr3Ir2O7) is the () member of the Ruddlesden-Popper series, Srn+1IrnO3n+1, and is built by the stacking of IrO2 (bi-)layers, in which IrO6 octahedra share the corner oxygens. The dominant perturbation to the half-filled iridium states in these compounds comes from the cubic component of the crystal field, written conventionally as . Indeed the – splitting, of order several eV, is often considered to be large enough that the states can be neglected, allowing the basic electronic structure to be understood in terms of a single hole occupying the orbitals (tetravalent iridium is ). In order to describe properly the ground state wave function of this hole, spin-orbit coupling and residual crystal-field effects with symmetry lower than cubic, such as tetragonal in the post-perovskite CaIrO3Hirai et al. (2009); Ohgushi et al. (2013) or trigonal in pyrochlore R2Ir2O7 (R = rare earth element)Hozoi et al. (2014), need to be considered. At the single-ion level, this is achieved by diagonalizing the Hamiltonian in the orbitals basis-setAment et al. (2011); Liu et al. (2012); Hozoi et al. (2014); Ohgushi et al. (2013); Moretti Sala et al. (2014a), where is the spin-orbit coupling and is the tetragonal (trigonal) crystal-field splitting.
Strictly speaking, the ground state is realized only for , i.e. for a perfectly cubic symmetry. In real materials this condition is relaxed to . Estimates of in Sr2IrO4 ( eVBoseggia et al. (2013a)) and its sister compound Ba2IrO4( eVMoretti Sala et al. (2014b)) indeed confirm that the requirement on the relative magnitude of and is realized, since the spin-orbit coupling in these materials of order 0.5 eVKim et al. (2008); Boseggia et al. (2013b); Moretti Sala et al. (2014b). One has to keep in mind, however, that the scenario of the ground state holds true only when the states do not contribute to the ground state wave function, i.e. if the cubic component of the crystal field is much larger than the spin-orbit coupling, . Indeed, the contribution of the states has been invoked as a possible cause of the departure of CaIrO3 from the pure ground state in LDA+SO+U calculationsSubedi (2012).
Theoretical estimates of in Sr2IrO4 range from 1.8Haskel et al. (2012) to 5 eVJin et al. (2009). Experimentally, various x-ray techniques have been used to estimate , including x-ray absorption spectroscopy (XAS), resonant elastic (REXS) and inelastic (RIXS) x-ray scattering. For example, soft XAS at the O K edge has been used to probe the empty iridium 5 states through hybridization with the oxygen 2 orbitalsKim et al. (2008); Moretti Sala et al. (2014b), providing values of for Sr2IrO4Moon et al. (2006) and Sr3Ir2O7Park et al. (2014) in the range 2.5 eV to 4 eV. However, this particular technique is highly surface sensitive, especially when performed in total-electron-yield (TEY) mode, which compromises the reliability of the extracted value of . The possibility that surface and bulk properties might be different in iridium oxides was highlighted by Liu et al., who reported the existence of weak metallicity in the near-surface electronic structure of Sr3Ir2O7 while its bulk is known to be insulatingLiu et al. (2014). In addition to the surface sensitivity, one has to deal with self-absorption effects in total-fluorescence-yield (TFY) detected XAS. As self-absorption is dependent on photon energy and experimental geometry, extreme caution has to be taken when corrections to the spectra are applied. XAS at the Ir L2,3 edges ensures bulk-sensitivity, but self-absorption equally affects hard XAS in TFY mode. Moreover, it suffers from the sizeable broadening of features due to the 2 core-hole lifetime which obscures details of the electronic structure close to the Fermi energy. This problem can at least be overcome to a certain degree by measuring partial-fluorescence-yield (PFY) detected XASHämäläinen et al. (1991): this technique provides very similar information to that of conventional XAS, but with the advantage that a shallower core-hole is left in the final state of the decay process selected by energy-discriminating the photons emitted due to radiative decay. For example, in the case of the () emission line of iridium, if is the lifetime broadening of the core-hole, and is that of the () core-hole, then the PFY broadening will be given by , since . However, even if the benefits of PFY XAS are evident, it is still difficult to extract quantitative information on from such measurementsGretarsson et al. (2011); Clancy et al. (2014).
Resonant x-ray magnetic scattering (RXMS)Kim et al. (2009, 2012a); Boseggia et al. (2012a, 2013a) and resonant inelastic x-ray scattering (RIXS)Ishii et al. (2011); Kim et al. (2012b); Liu et al. (2012); Moretti Sala et al. (2014c) in the hard x-ray regime also provide rough estimates of the cubic component of the crystal field from the RXMS/RIXS energy dependence. Indeed, that the intensity of both magnetic reflections in RXMS and intra- excitations in RIXS are enhanced a few eV below the main absorption line has been interpreted as a signature of the – splitting. Again, however, both of these techniques suffer from self-absorption effects due to the proximity of the scattered photon energy to the Ir L2,3 absorption edges.
The present work was designed to provide a reliable, bulk-sensitive probe of the electronic structure of iridium oxides. We therefore used non-resonant inelastic x-ray scattering (NIXS) in the hard x-ray energy range, more specifically x-ray Raman spectroscopy (XRS), to probe the bulk properties of iridium oxides. XRS is a x-ray scattering technique in which the energy of the incoming and scattered photons is far from absorption edges of the material, making XRS a self-absorption-free and bulk-sensitive probeSchülke (2007). Indeed, the XRS cross-section in the limit of small momentum transfer (i.e. in the dipole limit) is formally identical to that of XAS, with playing the role of photon polarization: the XRS cross-sections is then proportional to , where and are the many-body electronic wave functions of the initial and final state of the system, respectivelySchülke (2007). The main drawback of this technique is the low count-rate, which is partially overcome by collecting the scattered photons over a large solid angle. In the following we show that XRS allows the precise determination of the cubic component of the crystal-field splitting in the compounds Sr2IrO4 and Sr3Ir2O7, thus offering an alternative spectroscopic tool for the investigation of the electronic structure of iridium oxides.
II Experimental details
X-ray Raman spectroscopy measurements were performed at the ID20 beam line of the European Synchrotron Radiation Facility (ESRF), Grenoble. The X-rays produced by four U26 undulators were monochromatized to an energy-resolution of eV by the simultaneous use of a Si(111) high heat-load liquid-nitrogen cooled monochromator and a Si(311) post-monochromator. The x-rays were then focused at the sample position by means of a Kirkpatrick-Baez mirror system down to a spot size of m2 (vertical horizontal, FWHM). The scattered X-rays were collected by 12 crystal-analyzers exploiting the Si(660) reflection close to backscattering geometry (at a fixed Bragg angle of , corresponding to eV) and detected by a Maxipix detectorPonchut et al. (2011) with pixel size of m2. The resulting energy resolution was eV. In order to obtain the XRS spectrum, the incident photon energy was varied in the energy range from (the elastic energy) to eV, thus covering the oxygen K edge. The accumulation time/spectrum was about 2 hours and several spectra were recorded to improve the counting statistics. XRS spectra were collected in two different scattering geometries, corresponding to the momentum transfer along the sample -axis and in the -plane, respectively. In both geometries, the scattering plane was vertical and the incident X-rays linearly polarized in the horizontal plane. XAS spectra were recorded at the ID08 beam line of the ESRF in the TFY mode.
Single crystals of Sr2IrO4 and Sr3Ir2O7, with dimensions of mm3, were were grown using the flux method described in Ref. Boseggia et al., 2012b. All spectra were recorded at room temperature.
III Results and discussion
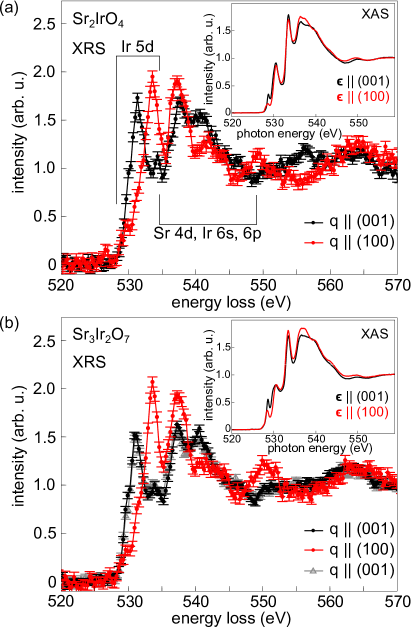
Figure 1 shows XRS scans for Sr2IrO4 (a) and Sr3Ir2O7 (b) across the oxygen K edge for (black) and (red dots). The scattering angle was fixed to , corresponding to a momentum transfer of Å-1. The background was removed by subtracting a linear fit to the pre-edge region at energies lower than 528 eV. The spectra were then normalized to unit area. For both samples, spectra taken in the two geometries are distinctly different, revealing a very strong orientation dependence of the XRS signal. In particular, one notes a large change of spectral weight between the two main features in the 530-535 eV energy range.
In agreement with XAS resultsChen et al. (1991); Schmidt et al. (1996); Moon et al. (2006), the 528-535 eV energy region is dominated by transitions to the Ir 5 states through the hybridization with O 2 orbitals, while higher energy features correspond to excitations involving Ir 6, 6 and Sr 4 statesMizokawa et al. (2001), as indicated in Fig. 1. For comparison, TFY XAS spectra were measured on the very same samples. These are shown in the insets of Fig. 1. Continuous black and red lines correspond to orthogonal directions of the photon polarization, and , respectively. As expected, the overall shape is similar to that of the XRS spectra, but the dichroic effect in the XAS spectra is very small, in stark contrast to the strong orientation dependence of the XRS measurements performed on the same samples. In order to rule out any contribution higher than dipolar to the XRS spectra, we investigated the dependence of the XRS cross-section in Sr3Ir2O7: by setting , corresponding to Å-1 (gray triangles in Fig. 1(b)), we note that the overall shape of the spectrum perfectly matches with that acquired for Å-1, thus implying that the momentum dependence of the XRS is negligible. We therefore attribute the discrepancy between XRS and XAS measurements to potential surface and/or self-absorption effects affecting soft x-ray techniques. This observation underlines the importance of complementing surface-sensitive techniques with bulk-sensitive probes.
In order to analyse our data we have calculated the number of peaks expected in the 530-535 eV energy interval and their corresponding spectral weights by pursuing the analogy between the XRS and XAS cross-sections. The relevant transitions are those from O to states with the latter hybridised with the Ir 5 orbitalsKim et al. (2008); Park et al. (2014); Moretti Sala et al. (2014b). The hybridization strength is calculated according to the orbital overlap model Slater and Koster (1954) with the hopping integral written as
| (1) |
where is a constant depending on the bond type (= or ), is the Ir-O distance ( Å and Å for apical and in-plane oxygens, respectively, in Sr2IrO4Crawford et al. (1994); while Å and Å in Sr3Ir2O7Subramanian et al. (1994)) and Harrison (1989). It should be noted that and are related by Harrison (1989).
Since the hybridization strength is inversely proportional to the distance between the atoms involved, we can distinguish the contributions of the apical (A) and in-plane (P) oxygens. Let us consider the apical oxygens first: the O state hybridizes with the Ir states, while the () mixes with the () orbitals. For the in-plane oxygens, hybridizes with the and orbitals, while and are mixed with the , and orbitals. This is summarized in Fig. 2.
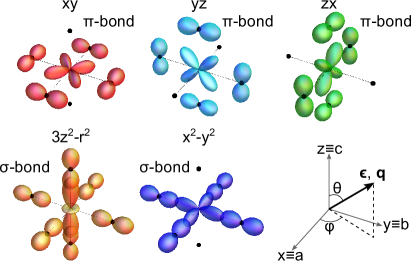
It remains to consider the cross-sections associated with transitions to different orbitals. In the framework of a single-ion model, these are obtained by calculating the matrix elements corresponding to the dipolar transitions ()Moretti Sala et al. (2014b). The cross-section is proportional to the product of , the number of available final states and a polarisation factor. The polarization (transferred momentum) dependence of the XAS (XRS, in the dipole limit) cross-sections to the , and states are given by , and , respectively, where and are the Eulerian angles describing the direction of () in the sample reference system, as sketched in Fig. 2. Merging the cross-section angular dependence and the hybridization between Ir -O states, we obtain the polarization (transferred momentum) dependence of the transitions to the , , , , orbitals as reported in Table 1. Note that we have used and expected for the state.
| Apical O | In-plane O | |
|---|---|---|
| 0 | ||
| 0 |
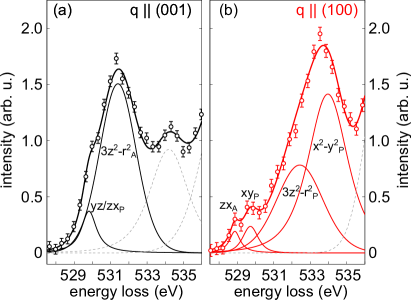
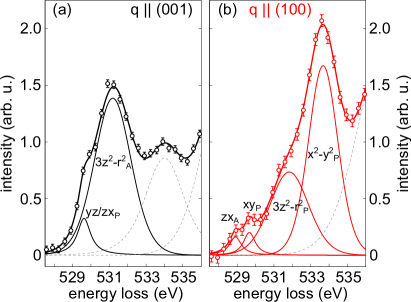
For the specific geometries used in our experiments, it transpires that only two transitions are allowed when () and four when ( and ). The appropriate cross-sections are given in Table 2. We therefore performed a fitting of our model to the data by adjusting the number of peaks accordingly and constraining their relative spectral weight to the calculated one. Extra peaks were introduced in the fit to mimic the high energy features: one for and two for , respectively. The result of the fitting is shown in Fig. 3 for Sr2IrO4 and in Fig. 4 for Sr3Ir2O7. We emphasise that, apart from an overall scale factor for the amplitude, the energy position and full width at half maximum (FWHM) of the curves are the only free fitting parameters: their values are summarized in Table 2. The agreement between the fit and the experimental data is remarkably good in both scattering geometries, allowing us to unambiguously assign each feature. In particular, the intense features at 531.4 (531.2) and 534.0 (533.7) eV in Sr2IrO4 (Sr3Ir2O7) correspond to excitations to the and orbitals via the apical and in-plane oxygens, respectively. This peak assignment is consistent with the work of Moon et al. on Sr2IrO4Moon et al. (2006), Schmidt et al. on Sr2RuO4Schmidt et al. (1996) and Park et al. on Sr3Ir2O7Park et al. (2014).
| Energy loss (eV) | FWHM (eV) | Energy loss (eV) | FWHM (eV) | |||
|---|---|---|---|---|---|---|
| Sr2IrO4 | Sr2IrO4 | Sr3Ir2O7 | Sr3Ir2O7 | |||
We are now in a position to extract the cubic component of the crystal field . This is given by the energy difference between the centres of mass of the and states for in-plane oxygens. In view of the small tetragonal crystal field measured in Sr2IrO4 ( eVBoseggia et al. (2013a)), we consider the splitting of the states due to spin-orbit coupling only in the calculation of . We obtain eV in Sr2IrO4 and eV in Sr3Ir2O7, assuming eVKim et al. (2008). Estimates of extracted from XAS and RXMS/RIXS measurements are consistent with our results. The cubic component of the crystal field is thus very large compared to the other energy scales of the system, namely the spin orbit coupling and the tetragonal crystal field, therefore validating the initial hypothesis that is the dominant energy scale. Finally, in addition to the estimate of the cubic component of the crystal field, we can deduce the sign of the tetragonal contribution to the crystal field from the splitting of the states ( eV in Sr2IrO4 and by eV in Sr3Ir2O7). Indeed, the fact that the orbital is the highest in energy is consistent with structural studies indicating an elongation of the IrO6 cage in both compounds. Note that, for tetragonally distorted octahedra, the description of states requires two parameters, and , in addition to the main crystal-field parameter . The splitting of and states is then given by and (), respectivelyBersuker (2010). In the absence of spin-orbit coupling, the states are almost degenerate (), implying . A finite splitting of the states is therefore compatible with the realization of the ground state in Sr2IrO4 and Sr3Ir2O7.
IV Conclusions
By exploiting the orientation dependence of oxygen K edge XRS cross-sections in Sr2IrO4 and Sr3Ir2O7, we have been able to assign spectral features in the 528-535 eV energy range to specific transitions involving the Ir orbitals. These assignments allow us to extract the value of the cubic crystal-field splitting of and eV in Sr2IrO4 and Sr3Ir2O7, respectively. In addition, the tetragonal crystal field was found to split the states by eV in Sr2IrO4 and by eV in Sr3Ir2O7. It is important to stress that the reliability of these values of the crystal field splittings obtained in our study is enhanced by the bulk sensitivity of the XRS technique.
V Acknowledgments
The authors are grateful for technical support by C. Henriquet and R. Verbeni, and all the colleagues from the ESRF support groups.
References
- Kim et al. (2008) B. J. Kim, H. Jin, S. J. Moon, J.-Y. Kim, B.-G. Park, C. S. Leem, J. Yu, T. W. Noh, C. Kim, S.-J. Oh, J.-H. Park, V. Durairaj, G. Cao, and E. Rotenberg, Phys. Rev. Lett. 101, 076402 (2008).
- Moon et al. (2008) S. J. Moon, H. Jin, K. W. Kim, W. S. Choi, Y. S. Lee, J. Yu, G. Cao, A. Sumi, H. Funakubo, C. Bernhard, and T. W. Noh, Phys. Rev. Lett. 101, 226402 (2008).
- Kim et al. (2009) B. J. Kim, H. Ohsumi, T. Komesu, S. Sakai, T. Morita, H. Takagi, and T. Arima, Science 323, 1329 (2009).
- Pesin and Balents (2010) D. Pesin and L. Balents, Nat. Phys. 6, 376 (2010).
- Wang and Senthil (2011) F. Wang and T. Senthil, Phys. Rev. Lett. 106, 136402 (2011).
- Kim et al. (2012a) J. W. Kim, Y. Choi, J. Kim, J. F. Mitchell, G. Jackeli, M. Daghofer, J. van den Brink, G. Khaliullin, and B. J. Kim, Phys. Rev. Lett. 109, 037204 (2012a).
- Watanabe et al. (2013) H. Watanabe, T. Shirakawa, and S. Yunoki, Phys. Rev. Lett. 110, 027002 (2013).
- Witczak-Krempa et al. (2014) W. Witczak-Krempa, G. Chen, Y. B. Kim, and L. Balents, Annual Review of Condensed Matter Physics 5, 57 (2014).
- Crawford et al. (1994) M. K. Crawford, M. A. Subramanian, R. L. Harlow, J. A. Fernandez-Baca, Z. R. Wang, and D. C. Johnston, Phys. Rev. B 49, 9198 (1994).
- Cao et al. (2002) G. Cao, Y. Xin, C. S. Alexander, J. E. Crow, P. Schlottmann, M. K. Crawford, R. L. Harlow, and W. Marshall, Phys. Rev. B 66, 214412 (2002).
- Hirai et al. (2009) S. Hirai, M. D. Welch, F. Aguado, and S. A. T. Redfern, Z. Kristallogr. 224, 345 (2009).
- Ohgushi et al. (2013) K. Ohgushi, J.-i. Yamaura, H. Ohsumi, K. Sugimoto, S. Takeshita, A. Tokuda, H. Takagi, M. Takata, and T.-h. Arima, Phys. Rev. Lett. 110, 217212 (2013).
- Hozoi et al. (2014) L. Hozoi, H. Gretarsson, J. P. Clancy, B.-G. Jeon, B. Lee, K. H. Kim, V. Yushankhai, P. Fulde, D. Casa, T. Gog, J. Kim, A. H. Said, M. H. Upton, Y.-J. Kim, and J. van den Brink, Phys. Rev. B 89, 115111 (2014).
- Ament et al. (2011) L. J. P. Ament, G. Khaliullin, and J. van den Brink, Phys. Rev. B 84, 020403 (2011).
- Liu et al. (2012) X. Liu, V. M. Katukuri, L. Hozoi, W.-G. Yin, M. P. M. Dean, M. H. Upton, J. Kim, D. Casa, A. Said, T. Gog, T. F. Qi, G. Cao, A. M. Tsvelik, J. van den Brink, and J. P. Hill, Phys. Rev. Lett. 109, 157401 (2012).
- Moretti Sala et al. (2014a) M. Moretti Sala, S. Boseggia, D. F. McMorrow, and G. Monaco, Phys. Rev. Lett. 112, 026403 (2014a).
- Boseggia et al. (2013a) S. Boseggia, H. C. Walker, J. Vale, R. Springell, Z. Feng, R. S. Perry, M. M. Sala, H. M. Rønnow, S. P. Collins, and D. F. McMorrow, Journal of Physics: Condensed Matter 25, 422202 (2013a).
- Moretti Sala et al. (2014b) M. Moretti Sala, M. Rossi, S. Boseggia, J. Akimitsu, N. B. Brookes, M. Isobe, M. Minola, H. Okabe, H. M. Rønnow, L. Simonelli, D. F. McMorrow, and G. Monaco, Phys. Rev. B 89, 121101 (2014b).
- Boseggia et al. (2013b) S. Boseggia, R. Springell, H. C. Walker, H. M. Rønnow, C. Rüegg, H. Okabe, M. Isobe, R. S. Perry, S. P. Collins, and D. F. McMorrow, Phys. Rev. Lett. 110, 117207 (2013b).
- Subedi (2012) A. Subedi, Phys. Rev. B 85, 020408 (2012).
- Haskel et al. (2012) D. Haskel, G. Fabbris, M. Zhernenkov, P. P. Kong, C. Q. Jin, G. Cao, and M. van Veenendaal, Phys. Rev. Lett. 109, 027204 (2012).
- Jin et al. (2009) H. Jin, H. Jeong, T. Ozaki, and J. Yu, Phys. Rev. B 80, 075112 (2009).
- Moon et al. (2006) S. J. Moon, M. W. Kim, K. W. Kim, Y. S. Lee, J.-Y. Kim, J.-H. Park, B. J. Kim, S.-J. Oh, S. Nakatsuji, Y. Maeno, I. Nagai, S. I. Ikeda, G. Cao, and T. W. Noh, Phys. Rev. B 74, 113104 (2006).
- Park et al. (2014) H. J. Park, C. H. Sohn, D. W. Jeong, G. Cao, K. W. Kim, S. J. Moon, H. Jin, D.-Y. Cho, and T. W. Noh, Phys. Rev. B 89, 155115 (2014).
- Liu et al. (2014) C. Liu, S.-Y. Xu, N. Alidoust, T.-R. Chang, H. Lin, C. Dhital, S. Khadka, M. Neupane, I. Belopolski, G. Landolt, H.-T. Jeng, R. Markiewicz, J. H. Dil, A. Bansil, S. D. Wilson, and M. Zahid Hasan, ArXiv e-prints (2014), arXiv:1403.2704 [cond-mat.str-el] .
- Hämäläinen et al. (1991) K. Hämäläinen, D. P. Siddons, J. B. Hastings, and L. E. Berman, Phys. Rev. Lett. 67, 2850 (1991).
- Gretarsson et al. (2011) H. Gretarsson, J. Kim, D. Casa, T. Gog, K. R. Choi, S. W. Cheong, and Y.-J. Kim, Phys. Rev. B 84, 125135 (2011).
- Clancy et al. (2014) J. P. Clancy, A. Lupascu, H. Gretarsson, Z. Islam, Y. F. Hu, D. Casa, C. S. Nelson, S. C. LaMarra, G. Cao, and Y.-J. Kim, Phys. Rev. B 89, 054409 (2014).
- Boseggia et al. (2012a) S. Boseggia, R. Springell, H. C. Walker, A. T. Boothroyd, D. Prabhakaran, S. P. Collins, and D. F. McMorrow, Journal of Physics: Condensed Matter 24, 312202 (2012a).
- Ishii et al. (2011) K. Ishii, I. Jarrige, M. Yoshida, K. Ikeuchi, J. Mizuki, K. Ohashi, T. Takayama, J. Matsuno, and H. Takagi, Phys. Rev. B 83, 115121 (2011).
- Kim et al. (2012b) J. Kim, D. Casa, M. H. Upton, T. Gog, Y.-J. Kim, J. F. Mitchell, M. van Veenendaal, M. Daghofer, J. van den Brink, G. Khaliullin, and B. J. Kim, Phys. Rev. Lett. 108, 177003 (2012b).
- Moretti Sala et al. (2014c) M. Moretti Sala, K. Ohgushi, A. Al-Zein, Y. Hirata, G. Monaco, and M. Krisch, Phys. Rev. Lett. 112, 176402 (2014c).
- Schülke (2007) W. Schülke, Electron Dynamics by Inelastic X-Ray Scattering, Oxford Series on Synchrotron Radiation (OUP Oxford, 2007).
- Ponchut et al. (2011) C. Ponchut, J. M. Rigal, J. Clément, E. Papillon, A. Homs, and S. Petitdemange, Journal of Instrumentation 6, C01069 (2011).
- Boseggia et al. (2012b) S. Boseggia, R. Springell, H. C. Walker, A. T. Boothroyd, D. Prabhakaran, D. Wermeille, L. Bouchenoire, S. P. Collins, and D. F. McMorrow, Phys. Rev. B 85, 184432 (2012b).
- Chen et al. (1991) C. T. Chen, F. Sette, Y. Ma, M. S. Hybertsen, E. B. Stechel, W. M. C. Foulkes, M. Schulter, S.-W. Cheong, A. S. Cooper, L. W. Rupp, B. Batlogg, Y. L. Soo, Z. H. Ming, A. Krol, and Y. H. Kao, Phys. Rev. Lett. 66, 104 (1991).
- Schmidt et al. (1996) M. Schmidt, T. R. Cummins, M. Bürk, D. H. Lu, N. Nücker, S. Schuppler, and F. Lichtenberg, Phys. Rev. B 53, R14761 (1996).
- Mizokawa et al. (2001) T. Mizokawa, L. H. Tjeng, G. A. Sawatzky, G. Ghiringhelli, O. Tjernberg, N. B. Brookes, H. Fukazawa, S. Nakatsuji, and Y. Maeno, Phys. Rev. Lett. 87, 077202 (2001).
- Slater and Koster (1954) J. C. Slater and G. F. Koster, Phys. Rev. 94, 1498 (1954).
- Subramanian et al. (1994) M. Subramanian, M. Crawford, and R. Harlow, Materials Research Bulletin 29, 645 (1994).
- Harrison (1989) W. Harrison, Electronic structure and the properties of solids: the physics of the chemical bond, Dover Books on Physics (Dover Publications, 1989).
- Bersuker (2010) I. B. Bersuker, Electronic Structure and Properties of Transition Metal Compounds: Introduction to the Theory (Wiley, 2010).